Original link: https://judithcurry.com/2019/01/21/is-ocean-warming-accelerating-faster-than-thought/?fbclid=IwAR08glgOmK-OqdyLjz3loIzqvaIvtowzFz9wMXqoZBQDPrTVoCeciQ5dTAY#_ednref1
There are a number of statements in Cheng et al. (2019)
‘How fast are the oceans warming’, (‘the paper’) that appear to be
mistaken and/or potentially misleading. My analysis of these issues is
followed by a reply from the paper’s authors.
Contrary to what the paper indicates:
- Contemporary estimates of the trend in 0–2000 m depth ocean heat content over 1971–2010 are closely in line with that assessed in the IPCC AR5 report five years ago
- Contemporary estimates of the trend in 0–2000 m depth ocean heat content over 2005–2017 are significantly (> 95% probability) smaller than the mean CMIP5 model simulation trend.
Ocean warming over 1971–2010 per IPCC AR5 and contemporary estimates
1. The paper states: “The warming is larger over the
1971–2010 period than reported in AR5. The OHC trend for the upper 2000
m in AR5 ranged from 0.20 to 0.32 Wm−2 during this period (4: AR5). The three more contemporary estimates that cover the same time period suggest a warming rate of 0.36 ± 0.05 (6: Ishii ), 0.37 ± 0.04 (10: Domingues), and 0.39 ± 0.09 (2: Cheng) Wm−2.”
[Numbered references in this article are to the same numbered
references in the paper. The number is followed by the lead author’s
name, or AR5, where this aids clarity.]
2. AR5 (4) featured 0–700 m depth ocean
heat content (OHC) 1971-2010 linear trend estimates from five studies,
ranging from 0.15 to 0.27 Wm−2 of the Earth’s surface. Adding the AR5 700–2000 m OHC 1971-2010 trend estimate of 0.09 Wm−2 brings the range up to 0.24 to 0.36 Wm−2 , not to 0.20 to 0.32 Wm−2 as stated. The warming rates plotted in Supplementary Figure S1 agree to my values, not to those stated in the paper.
3. Importantly, although AR5
featured several OHC trend estimates for 0–700 m depth, its assessment
of the Earth’s energy uptake (Section 3.2.3 and Box 3.1) used only the
highest one (10: Domingues), adding the Levitus (12) 700–2000 m OHC trend to give a best estimate 0–2000 m warming rate over 1971–2010 of 0.36 Wm−2. That rate is identical to one (6: Ishii)
of the three more contemporary estimates given in the paper and
extremely close to the other two of them – within the innermost
one-third of their uncertainty ranges.
See Figure 1, left hand section, and compare with the ‘Updated OHC
estimates compared with AR5’ figure [Fig 2] in the paper. It is
therefore misleading to claim that the warming is larger over the
1971–2010 period than reported in AR5.
4. Moreover, over the final decade covered by AR5,
2002–2011, the trend of the 0–2000 m OHC time series that AR5 adopted
for its assessment, 0.60 Wm−2, was noticeably higher than those for two of the three more contemporary estimated OHC datasets given in the paper (0.35 (6: Ishii) and 0.52 (2: Cheng) Wm−2) and, unsurprisingly, almost identical to the third (10: Domingues + 12: Levitus).
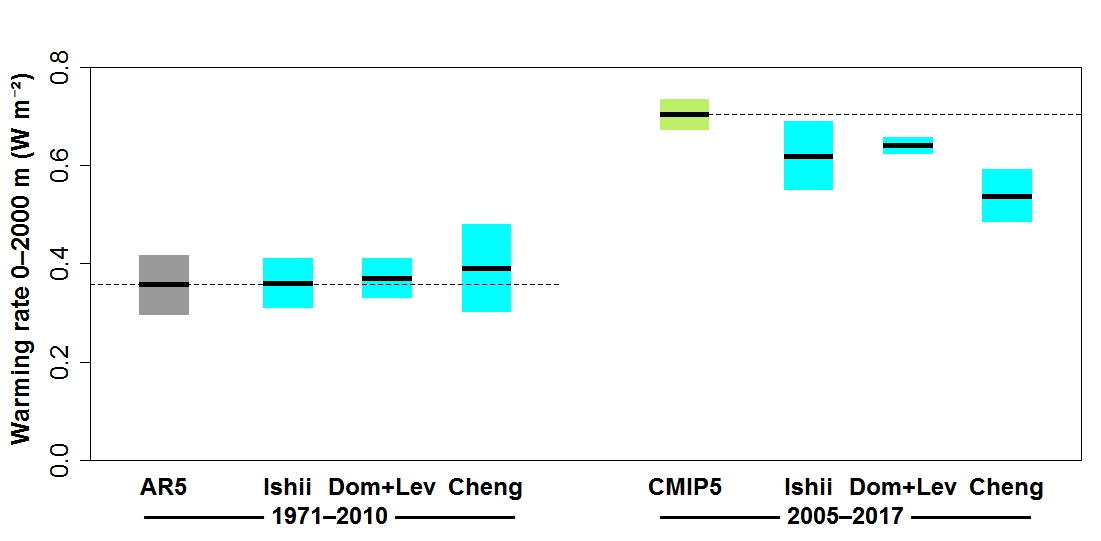
Figure 1: Updated 0–2000 m OHC linear trend estimates compared with
AR5 and the CMIP5 mean. Error bars are 90% confidence intervals; black
lines are means. Units relate to the Earth’s entire surface area.
Ocean warming over 2005–2017 per CMIP5 models and contemporary estimates
5. The paper’s ‘Past and future ocean heat content
changes’ figure [Fig 1] caption states: “Annual observational OHC
changes are consistent with each other and consistent with the ensemble
means of the CMIP5 models for historical simulations pre-2005 and
projections from 2005–2017, giving confidence in future projections to
2100 (RCP2.6 and RCP8.5).” This does not appear to be true for the
linear trends of the annual values for the 2005–2017 projections, at
least.
The main text states: “Over this period (2005–2017) for the top 2000
m, the linear warming rate for the ensemble mean of the CMIP5 models is
0.68 ± 0.02 Wm−2, whereas observations give rates of 0.54 ± 0.02 (2), 0.64 ± 0.02 (10), and 0.68 ± 0.60 (11) Wm−2.”
6. Five problems with this claim regarding 2005–2017 warming rates are:
(i) the CMIP5 RCP2.6 and RCP8.5 projections top 2000 m OHC data
archived for the paper shows an ensemble-mean linear warming rate over
2005–2017 of 0.70 ± 0.03 Wm−2, not 0.68 ± 0.02 Wm−2. The same is true when also including data from the third scenario used in the paper (RCP4.5).
(ii) the underlying time series from which the third observational estimate is derived (Fig. 3.b in 11: Resplandy)
spans 1991–2016, and has a lower (and highly uncertain) linear trend
from 2005 to 2016 (its final year) than the stated 0.68 Wm−2 (which is calculated over 1991–2016), so this estimate should be excluded;
(iii) the statement inexplicably omits the Ishii et al. (6) observational data, which also have a lower estimated trend (0.62 ± 0.07 Wm−2) than per CMIP5 over this period; and
(iv) the uncertainty range for the Cheng (2) estimate
appears to be seriously understated: I calculate that the estimate
should be 0.54 ± 0.06 (rounding 0.055 up), not 0.54 ± 0.02.
(v) adding the uncertainty ranges in quadrature, since CMIP5 and
observational errors are independent, the CMIP5 ensemble mean trend is
statistically inconsistent with the all three of these observational
trend estimates (2: Cheng, 6: Ishii, 10: Domingues);
The right hand section of Figure 1 shows a corrected comparison of
CMIP5 mean and observational 0–2000 m depth ocean warming rates over
2005–2017.
7. Although it is pointed out in the paper’s
Supplementary material that volcanic eruptions after 2000 have not been
taken into account in CMIP5 models (with a minor effect on projected
warming since then), it has been shown that when underestimation of
other growth in other drivers of climate change is accounted for there
is no overall bias in post-2000 CMIP5 model forcing growth (Outten et
al. 2015).
Other issues
8. The straight black line in the ‘Past and future
ocean heat content changes’ figure [Fig 1] for the Resplandy et al. (11)
OHC estimate gives a misleading impression of close agreement with the
three OHC time series based on in situ observations over 1991–2016: its trend uncertainty range is so large (0.08 to 1.28 Wm−2) that the apparent close agreement is most likely due to chance.
9. The Press release for the paper claimed that ‘If
no actions are taken (“business as usual”), the upper ocean above 2000
meters will warm by 2020 ZetaJoules by 2081-2100″, which is based on
CMIP5 model RCP8.5 scenario simulations. That is misleading. RCP8.5
involves not only no actions (including those already carried out) being
taken, but also emissions being unusually high for a business as usual
scenario.[ii]
Nicholas Lewis January 2019
[i]
The paper does not directly claim that ocean warming is accelerating
faster than thought; that is the headline of The New York Times article
about the paper.
[ii]
As the source paper (Riahi, K., et al., 2011: RCP 8.5–A scenario of
comparatively high greenhouse gas emissions. DOI
10.1007/s10584-011-0149-y) states: “RCP8.5 combines assumptions about
high population and relatively slow income growth with modest rates of
technological change and energy intensity improvements, leading in the
long term to high energy demand and GHG emissions in absence of climate
change policies.”, and that “[RCP] 8.5 corresponds to a high greenhouse
gas emissions pathway compared to the scenario literature”. As Riahi et
al. (2011) make clear, the assumed energy intensity improvement rates
are only about half the historical average while middling world GDP
growth is assumed, leading to coal use increasing almost 10 fold by
2100.
References
2. L. Cheng et al., Sci. Adv. 3, e1601545 (2017).
4. M. Rhein et al., in Climate Change 2013: The Physical Science Basis. Contribution of Working Group I to the Fifth Assessment Report of the Intergovernmental Panel on Climate Change, T. F. Stocker et al., Eds. (Cambridge Univ. Press, 2013), pp. 215–315.
6. M. Ishii et al., Sci. Online Lett. Atmos. 13, 163 (2017).
10. C. M. Domingues et al., Nature 453, 1090 (2008).
11. L. Resplandy et al., Nature 563, 105 (2018).
12. S. Levitus et al., Geophys. Res. Lett. 39, L10603 (2012).
Additional references
Cheng, L., Abraham, J., Hausfather, Z. and Trenberth, K.E. (2019). How fast are the oceans warming?. Science, 363(6423), pp.128-129.
Outten, S., P. Thorne, I. Bethke, and Ø. Seland (2015), Investigating the recent apparent hiatus in surface temperature increases: 1. Construction of two 30-member Earth System Model ensembles, J. Geophys. Res. Atmos., 120, doi:10.1002/2015JD023859


