[[DJS -- Caution: this article does NOT refute average, global sea level rise. It only shows that it does not happen as we would intuitively expect. --]]
Jerry Mitrovica has been overturning
accepted wisdom for decades. A solid Earth geophysicist at Harvard, he
studies the internal structure and processes of the Earth, which has
implications for fields from climatology to the timing of human
migration and even to the search for life on other planets. Early in his
career he and colleagues showed that Earth’s tectonic plates not only
move from side to side, creating continental drift, but also up and
down. By refocusing attention from the horizontal of modern Earth
science to the vertical, he helped to found what he has nicknamed postmodern
geophysics. Recently Mitrovica has revived and reinvigorated
longstanding insights into factors that cause huge geographic variation
in sea level, with important implications for the study of climate
change today on glaciers and ice sheets.
We caught up with
Mitrovica in his airy office next to Harvard’s renowned mineral
collection. Though a practiced public speaker and recipient of numerous
awards, in person he speaks softly and deflects plaudits. He refers
frequently to the colleagues, graduate students, and mentors who have
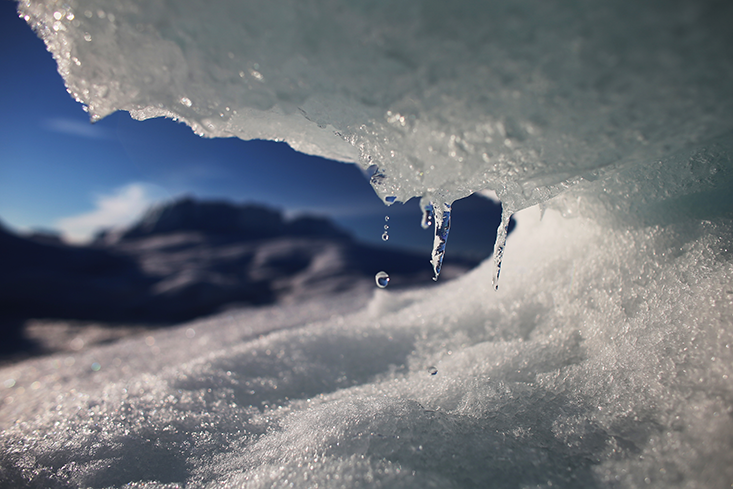
inspired him and contributed to his work. Global melting:
Though it may seem counterintuitive, meltingglaciers in one area may
cause local sea levels to drop—whilecausing a rise in sea levels
farther away.Joe Raedle/Getty ImagesSome of your recent research follows from the attraction of ocean water to ice sheets. That seems surprising.
This
is just Newton’s law of gravitation applied to the Earth. An ice sheet,
like the sun and the moon, produces a gravitational attraction on the
surrounding water. There’s no doubt about that.
What happens when a big glacier like the Greenland Ice Sheet melts?
Three
things happen. One is that you’re dumping all of this melt water into
the ocean. So the mass of the entire ocean would definitely be going up
if ice sheets were melting—as they are today. The second thing that
happens is that this gravitational attraction that the ice sheet exerts
on the surrounding water diminishes. As a consequence, water migrates
away from the ice sheet. The third thing is, as the ice sheet melts, the
land underneath the ice sheet pops up; it rebounds.
So what is the combined impact of the ice-sheet melt, water flow, and diminished gravity?
Gravity
has a very strong effect. So what happens when an ice sheet melts is
sea level falls in the vicinity of the melting ice sheet. That is
counterintuitive. The question is, how far from the ice sheet do you
have to go before the effects of diminished gravity and uplifting crust
are small enough that you start to raise sea level? That’s also
counterintuitive. It’s 2,000 kilometers away from the ice sheet. So if
the Greenland ice sheet were to catastrophically collapse tomorrow, the
sea level in Iceland, Newfoundland, Sweden, Norway—all within this 2,000
kilometer radius of the Greenland ice sheet—would fall. It might have a
30 to 50 meter drop at the shore of Greenland. But the farther you get
away from Greenland, the greater the price you pay. If the Greenland ice
sheet melts, sea level in most of the Southern Hemisphere will increase
about 30 percent more than the global average. So this is no small
effect.
The last time we were as warm as we are today, the ice sheets that we think of as the least stable disappeared.
What happens with melting in Antarctica?
If
the Antarctic ice sheets melt, sea level falls close to Antarctic. But
it would rise more than you’d otherwise expect in the Northern
Hemisphere. These are known as sea-level fingerprints, because each ice
sheet has its own geometry. Greenland produces one geometry of sea level
change and the Antarctic has its own. Mountain glaciers have their own
fingerprint. This explains a lot of variability in sea level. It’s also a
really important opportunity. If you have people denying climate change
because they say there’s geographic variation in sea level changes—it
doesn’t go up uniformly—you can say, “Well, that is incorrect because
ice sheets produce a geographically variable change in sea level when
they melt.” You can also use that variability to say this percentage is
coming from Greenland, this percentage is coming from the Antarctic, and
this percentage is coming from mountain glaciers. You can source the
melt. And that’s an important argument from a public-hazard viewpoint.
Why is the source of the melt important?
If
you’re living on the U.S. east coast, or Holland, you don’t need to
worry what global average sea-level rise is doing. I was in Holland a
few summers ago and was trying to convince the Dutch that if the
Greenland ice sheet melts, they have less to worry about than the
Antarctic ice sheet melting. But it doesn’t register. When I give public
talks, people just shake their heads. They don’t believe it when I show
this bull’s-eye around the melting [Greenland] ice sheet, which is an
area where sea level will fall. Our intuition is built from walking
along a shoreline or turning a tap on. It isn’t from considering what
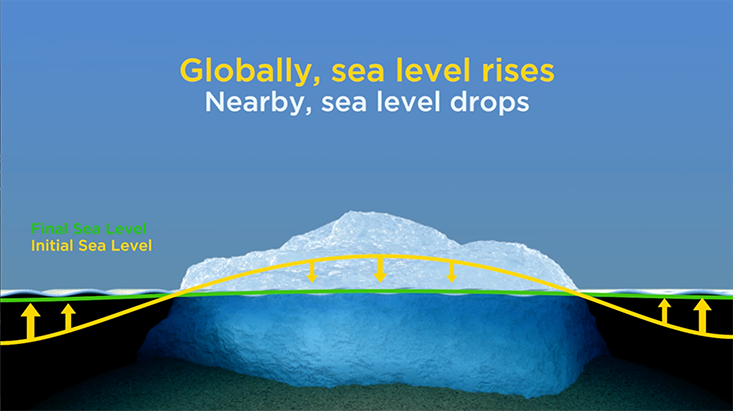
would happen if a major large-scale ice sheet melts. RISE AND FALL:
A melting ice sheet has two effects on sealevel. Diminished
gravitational attraction lowers the sea nearan ice sheet. At the same
time, water flowing into the oceanraises it. So if the Greenland ice
sheet collapsed into the sea,the melt water would dramatically raise
global sea levels. Butnearby countries would see sea levels dip.Graphic by SimonWerdmuller, courtesy of Maureen Raymo.Why are you so confident that the world’s glaciers, including the polar ice sheets, will keep melting?
One
way to understand where we’re heading in this warming world of ours is
to run a climate model. The other way is to look to the past and ask
what the ice sheets did the last time we were this warm or a little bit
warmer. We’re currently in an interglacial—a warm period between glacial
cycles. If humans weren’t warming the climate, Earth might be poised to
enter into another Ice Age in the future. The last interglacial prior
to the present one was about 120,000 years ago. Of course, 120,000 years
ago, humans weren’t having any impact on climate. That was natural
climatic variability.
What did the ice sheets do the last time the climate was this warm?
The
last time we were as warm as we are today, the ice sheets that we think
of as the least stable disappeared, albeit over a protracted period. So
why should we expect that the issue is going to be any different in the
next few hundreds to thousands of years? There’s no reason to believe
it, unless we do something to reverse what we’re doing.
OK. So we’d expect warming to cause ice sheets to melt and raise sea level. But what’s the evidence that we’re seeing that now?
The
average sea level change in the 20th century was 1.2 millimeters per
year. What we’ve seen in the last 20 years is an average of three
millimeters per year—that’s a factor of two-and-a-half increase from the
20th century to now. So that’s a nice way to address the skeptic’s
argument that it hasn’t changed or that it’s not getting worse. It’s
already gotten worse. And if you look back thousands of years, you have a
wide range of tools at your disposal. One is eclipse records, and one
is the Roman fish tanks.
What do Roman fish tanks tell us about sea levels?
Wealthy
Romans at the time of Augustus were building fish holding tanks. The
fishermen would come in with the fish, they’d put them there so that the
fish were fresh when they ate them—they wanted to keep them alive for a
few days or weeks or whatever. The Romans were engineers, so they built
these fish tanks at very precise levels relative to sea level at the
time. You didn’t want the walls to be too low because at high tide the
fish would swim out; you didn’t want it to be too high because you
wanted tides to refresh the water within the tanks.
Kurt Lambeck,
a professor at the Australian National University, recognized that by
looking at the present day elevation of those fish tanks, we could say
something about how sea level had changed over the 2,500 years since
then. If sea level over the last 2,500 years was going up at the rate
that it went up in the 20th century, those fish tanks would be under 4
meters of water—12 feet of water—and I can assure you they’re not. You
can see them. You can walk along the coast, they’re visible. What that
tells you is that it is impossible that sea level went up by the rates
that we saw in the 20th century for any extended period of time earlier
than that. Sea level has not gone up over the last 2,500 years like it
has in the 20th century.
This is an entirely different way to show that ice sheets are melting.
What can records of Babylonian eclipses 2,500 years ago tell us about climate change?
When
we look at eclipse records, we can say “here’s when a Babylonian
eclipse was recorded.” Now, I can do a calculation and ask when that
Babylonian eclipse should have occurred if the present rotation rate of
the Earth had stayed constant in the time between the eclipse and
present day. And you can do that for Greek, Arabic, Babylonian, Chinese
eclipses, and this is what a professor in the U.K., F. Richard
Stephenson, did. He tabulated, as others did before him, a large suite
of such eclipses that show a clear slowing of the Earth’s rotation rate
over the last few thousand years. Say you have two clocks synchronized
2,500 years ago. One kept time perfectly and the other was connected to
the Earth whose rotation rate was slowing. Over 2,500 years, they would
go out of sync by about four hours. That’s kind of the level of slowing.
So what we know is that the Earth’s rotation rate has slowed over the
last 2,500 years. But the Earth’s slowing isn’t what we would predict
exactly.
Why would you expect the Earth’s rotation to slow at all?
I just published this paper in Science Advances
on something called Munk’s Enigma. What we showed is that it comes from
three different effects. One is what’s known as “tidal dissipation.”
Tides crash into the shoreline and each time they do they dissipate
energy, and for a variety of reasons they slow the Earth’s rotation.
Another thing we talk about is that there is a very subtle coupling
between the core of the Earth, which is iron, and the rocky part of the
Earth, the mantle, which acts to change the Earth’s rotation rate we see
sitting on the surface of the planet.
Is it like the friction
of the fluid in a car’s a transmission; it has to do with how viscous
the connection is between the inner and outer parts of the planet?
It’s
not friction, but it’s pretty darn close. It’s the fact that you’ve got
one fluid moving against another fluid that’s moving at a different
rate. If they come out of sync, their rates will influence each other.
But it is as you say, a connection.
So, this is another effect.
We have the tides crashing in and what geophysicists would call
core-mantle coupling. We can predict both of those pretty accurately,
but you’re still left with a difference and that difference is due to
the ice age and we model that. We’ve got tidal dissipation, core-mantle
coupling, and now we add the Ice Age Effect, which I’m the expert on.
And lo and behold, when I add that to these other two effects, I get
precisely the four-hour slowing I saw.
What is the Ice Age Effect?
The Earth is growing
more spherical because 20,000 years ago we had a lot more ice at the
poles. When ice sheets were at the poles they kind of squished the Earth
from both poles and the Earth flattened a little bit. When those ice
sheets melted, that flattening started to rebound and we’re becoming
spherical, so our spin rate should be increasing, like a ballerina or a
figure skater. The ice age correction is a speeding up of the rotation
rate.
So these three factors—core-mantle coupling, post ice
rebounding of poles, and tidal dissipation—explain changes in the speed
of the Earth until the 20th century. What’s happening now?
We
want to take that same ice age model and correct for 20th-century
changes in Earth’s rotation. When we do, we get a difference that we
haven’t explained yet. So now we say; well, maybe that’s due to polar
ice sheet melting or polar glacier melting.
The way to do that is
to go to the IPCC, their last assessment report, and look at the
calculation of mountain glacier melting, because those tabulations
suggest that the ice sheets weren’t changing that much in the 20th
century. Ice sheets have only really started to melt in the last 20
years or so, but the glaciers were popping off all through the 20th
century. We take that glacier melting that the IPCC tells us, compute
its effect on rotation, and one effect would be to slow the Earth’s
rotation just like the figure skater, and compare it to these ice-age
corrected observations.
Is water moving off glaciers, slowing the Earth’s rotation, this time analogous to a figure skater putting arms out?
Right.
Glaciers are mostly near the axis. They’re near the North and South
Poles and the bulk of the ocean is not. In other words, you’re taking
glaciers from high latitudes like Alaska and Patagonia, you’re melting
them, they distribute around the globe, but in general, that’s like a
mass flux toward the equator because you’re taking material from the
poles and you’re moving it into the oceans. That tends to move material
closer to the equator than it once was.
So the melting mountain glaciers and polar caps are moving bulk toward the equator?
Yes.
Of course, there is ocean everywhere, but if you’re moving the ice from
a high latitude and you’re sticking it over oceans, in effect, you’re
adding to mass in the equator and you’re taking mass away from the polar
areas and that’s going to slow the earth down. That’s the calculation
we did. We also computed how those glaciers would affect the orientation
of poles. In both cases, when you do that calculation and you compare
it to this ice age corrected satellite and astronomical observations,
you fit them precisely.
What we showed in this recent paper is
that when you look at the modern data on rotation and you correct for
ice age, you have a leftover, and that leftover is precisely what it
should be if it were due to the kind of melting that global change
scientists believe happened in the 20th century.
There are some things that you can explain, but as a scientist you’re always going to face things that are counterintuitive.
With all those steps, it’s amazing that the calculations work out.
This
is an entirely different way to show that ice sheets are melting. It’s a
very good way because if you’re looking at Greenland and you say, “Oh,
it’s melting in the southern sector, I can see ice diminishing,” you
don’t necessarily know what it’s doing in the northern sector. You don’t
get a good integrated view of what the Greenland ice sheet is doing.
But rotation doesn’t care about north vs. south, it just cares about how
much mass is moving from Greenland into the oceans. And so rotation
provides what a scientist would call a really elegant integrated measure
of the mass balance of polar ice sheets.
What inspired you to become a scientist?
In
my family, we had more discussions about Renaissance history than we
ever did about science. I’m the only scientist in my family. I went into
what’s called an engineering science or engineering physics program. I
took a course in plate tectonics in my third year, and I thought,
“Whoa!” And my first paper—it wasn’t my idea, it was my advisor’s
idea—about what caused the flooding of the western part of North America
50 to 80 million years ago—that was quite a thrill. You’re a few years
into research graduate school, and you’ve just published a paper that
explains why North America was underwater, the western part.
What is the explanation?
Some
said it was some ice effect, that ice volumes had changed. More often
people thought that it was linked to changes in the rate at which
tectonic plates were created. But in my work and that of some colleagues
we’ve shown that those sorts of events when continents flood typically
are due not to some global change in sea level. Rather, it’s due to the
vertical motion of the continent itself reacting to the flow that’s
driving plate tectonics and driving continents up and down.
So many of your results seem abstract and counterintuitive. Is that a coincidence?
There
are so many interesting problems in our science that you can see with
your eyes. But your eyes can fool you. Richard Feynman, the great
physicist, used to start his physics lectures by showing students their
intuition could take them a long way. They could do things just through
intuition that would get them roughly the right answer. Then he used to
throw some counterintuitive examples at them. Then he said, “This is why
you need physics. You need to understand when your intuition might go
wrong.” I firmly am a Feynman acolyte. There are some things that you
can explain, but as a scientist you’re always going to face things that
are counterintuitive. You’re never going to understand that water is
falling near an ice sheet from your everyday experiences of the bathtub.
You need to bring in something more; in this case, Newton’s second law
of gravitation. You have to bring in physics; otherwise, you’re never
going to explain that.
Where do your “A-ha!” moments come from?
I
think some scientists would disagree with me, but I think you really do
have to give yourself time to think. You need to have some way in your
life as a scientist to mull over what you’re seeing. And I strongly
encourage my graduate students to have other interests, because the best
way to have that time is to take a break from science. I’ve had moments
where I’ve seen something in my models that I’d never seen before and I
think, “Well, you know, a good scientist is never going to walk away
from that.” A good scientist at that point sort of burrows in and says,
“Why am I seeing that?” Because to see the unexpected is the reward of
science.
Daniel Grossman is a freelance science journalist and radio producer based in Boston.