Greenhouse gas emissions from human activities strengthen the greenhouse effect, causing climate change. Most is carbon dioxide from burning fossil fuels: coal, oil, and natural gas. The largest emitters include coal in China and large oil and gas companies, many state-owned by OPEC and Russia. Human-caused emissions have increased atmospheric carbon dioxide by about 50% over pre-industrial levels. The growing levels of emissions have varied, but it was consistent among all greenhouse gases. Emissions in the 2010s averaged 56 billion tons a year, higher than ever before.
Electricity generation and transport are major emitters, the largest single source being coal-fired power stations with 20% of GHG. Deforestation and other changes in land use also emit carbon dioxide and methane. The largest source of anthropogenic methane emissions is agriculture, closely followed by gas venting and fugitive emissions from the fossil-fuel industry. The largest agricultural methane source is livestock. Agricultural soils emit nitrous oxide partly due to fertilizers. Similarly, fluorinated gases from refrigerants play an outsized role in total human emissions.
At current emission rates averaging six and a half tonnes per person per year, before 2030 temperatures may have increased by 1.5 °C (2.7 °F) over pre-industrial levels, which is the limit for the G7 countries and aspirational limit of the Paris Agreement.
Measurements and calculations
Global greenhouse gas emissions are about 50 Gt per year (6.6t per person) and for 2019 have been estimated at 57 Gt CO2 eq including 5 Gt due to land use change. In 2019, approximately 34% [20 GtCO2-eq] of total net anthropogenic GHG emissions came from the energy supply sector, 24% [14 GtCO2-eq] from industry, 22% [13 GtCO2-eq]from agriculture, forestry and other land use (AFOLU), 15% [8.7 GtCO2-eq] from transport and 6% [3.3 GtCO2-eq] from buildings.
Carbon dioxide (CO2), nitrous oxide (N
2O), methane, three groups of fluorinated gases (sulfur hexafluoride (SF
6), hydrofluorocarbons (HFCs) and perfluorocarbons (PFCs)) are the major anthropogenic greenhouse gases, and are regulated under the Paris Agreement.
Although CFCs are greenhouse gases, they are regulated by the Montreal Protocol, which was motivated by CFCs' contribution to ozone depletion rather than by their contribution to global warming. Note that ozone depletion has only a minor role in greenhouse warming, though the two processes are sometimes confused in the media. In 2016, negotiators from over 170 nations meeting at the summit of the United Nations Environment Programme reached a legally binding accord to phase out hydrofluorocarbons (HFCs) in the Kigali Amendment to the Montreal Protocol.
There are several ways of measuring greenhouse gas emissions. Some variables that have been reported include:
- Definition of measurement boundaries: Emissions can be attributed geographically, to the area where they were emitted (the territory principle) or by the activity principle to the territory that produced the emissions. These two principles result in different totals when measuring, for example, electricity importation from one country to another, or emissions at an international airport.
- Time horizon of different gases: The contribution of given greenhouse gas is reported as a CO2 equivalent. The calculation to determine this takes into account how long that gas remains in the atmosphere. This is not always known accurately and calculations must be regularly updated to reflect new information.
- The measurement protocol itself: This may be via direct measurement or estimation. The four main methods are the emission factor-based method, mass balance method, predictive emissions monitoring systems, and continuous emissions monitoring systems. These methods differ in accuracy, cost, and usability. Public information from space-based measurements of carbon dioxide by Climate Trace is expected to reveal individual large plants before the 2021 United Nations Climate Change Conference.
These measures are sometimes used by countries to assert various policy/ethical positions on climate change. The use of different measures leads to a lack of comparability, which is problematic when monitoring progress towards targets. There are arguments for the adoption of a common measurement tool, or at least the development of communication between different tools.
Emissions may be tracked over long time periods, known as historical or cumulative emissions measurements. Cumulative emissions provide some indicators of what is responsible for greenhouse gas atmospheric concentration build-up.
The national accounts balance tracks emissions based on the difference between a country's exports and imports. For many richer nations, the balance is negative because more goods are imported than they are exported. This result is mostly due to the fact that it is cheaper to produce goods outside of developed countries, leading developed countries to become increasingly dependent on services and not goods. A positive account balance would mean that more production was occurring within a country, so more operational factories would increase carbon emission levels.
Emissions may also be measured across shorter time periods. Emissions changes may, for example, be measured against the base year of 1990. 1990 was used in the United Nations Framework Convention on Climate Change (UNFCCC) as the base year for emissions, and is also used in the Kyoto Protocol (some gases are also measured from the year 1995). A country's emissions may also be reported as a proportion of global emissions for a particular year.
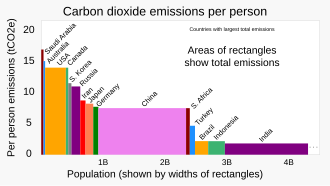
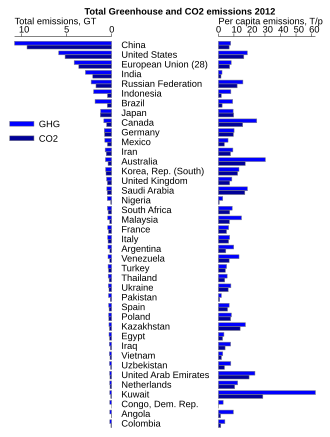
Another measurement is of per capita emissions. This divides a country's total annual emissions by its mid-year population. Per capita emissions may be based on historical or annual emissions.
While cities are sometimes considered to be disproportionate contributors to emissions, per-capita emissions tend to be lower for cities than the averages in their countries.
At current emission rates, before 2030 temperatures may have increased by 1.5 °C (2.7 °F) over pre-industrial levels, which is the limit for the G7 countries and aspirational limit of the Paris Agreement.
Sources
Overview of main sources
Since about 1750, human activity has increased the concentration of carbon dioxide and other greenhouse gases. As of 2021, measured atmospheric concentrations of carbon dioxide were almost 50% higher than pre-industrial levels. Natural sources of carbon dioxide are more than 20 times greater than sources due to human activity, but over periods longer than a few years natural sources are closely balanced by natural sinks, mainly photosynthesis of carbon compounds by plants and marine plankton. Absorption of terrestrial infrared radiation by longwave absorbing gases makes Earth a less efficient emitter. Therefore, in order for Earth to emit as much energy as is absorbed, global temperatures must increase.
Burning fossil fuels is estimated to have emitted 62% of 2015 human GhG. The largest single source is coal-fired power stations, with 20% of GHG as of 2021.
The main sources of greenhouse gases due to human activity are:
- burning of fossil fuels and deforestation leading to higher carbon dioxide concentrations in the air.
- land use change (mainly deforestation in the tropics) accounts for about a quarter of total anthropogenic GHG emissions.
- livestock enteric fermentation and manure management, paddy rice farming, land use and wetland changes, man-made lakes, pipeline losses, and covered vented landfill emissions leading to higher methane atmospheric concentrations. Many of the newer style fully vented septic systems that enhance and target the fermentation process also are sources of atmospheric methane.
- use of chlorofluorocarbons (CFCs) in refrigeration systems, and use of CFCs and halons in fire suppression systems and manufacturing processes.
- agricultural activities, including the use of fertilizers, that lead to higher nitrous oxide (N
2O) concentrations.
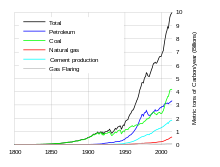
The seven sources of CO2 from fossil fuel combustion are (with percentage contributions for 2000–2004):
- Liquid fuels (e.g., gasoline, fuel oil): 36%
- Solid fuels (e.g., coal): 35%
- Gaseous fuels (e.g., natural gas): 20%
- Cement production: 3 %
- Flaring gas industrially and at wells: 1%
- Non-fuel hydrocarbons: 1%
- "International bunker fuels" of transport not included in national inventories: 4%
The largest source of anthropogenic methane emissions is agriculture, closely followed by gas venting and fugitive emissions from the fossil-fuel industry. The largest agricultural methane source is livestock. Agricultural soils emit nitrous oxide partly due to fertilizers.
The major sources of Greenhouse gases (GHG) are:
- Land Use (CO2 emissions)
- Forestry (CO2-LULUCF)
- Nitrous Acid (N2O)
- Fluorinated gases (F-gases)
- Compromising hydrofluorocarbons (HFCs)
- Perfluorocarbons (PFCs)
- sulphur hexafluoride (SF6)
- nitrogen trifluoride (NF3)
A 2017 survey of corporations responsible for global emissions found that 100 companies were responsible for 71% of global direct and indirect emissions, and that state-owned companies were responsible for 59% of their emissions.
By socio-economic class
Fueled by the consumptive lifestyle of wealthy people, the wealthiest 5% of the global population has been responsible for 37% of the absolute increase in greenhouse gas emissions worldwide. Almost half of the increase in absolute global emissions has been caused by the richest 10% of the population. In the newest report from the IPCC 2022, it states that the lifestyle consumptions of the poor and middle class in emerging economies produce approximately 5–50 times less the amount that the high class in already developed high-income countries. Variations in regional, and national per capita emissions partly reflect different development stages, but they also vary widely at similar income levels. The 10% of households with the highest per capita emissions contribute a disproportionately large share of global household GHG emissions.
By energy source
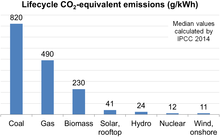
| Technology | Min. | Median | Max. |
|---|---|---|---|
| Currently commercially available technologies | |||
| Coal – PC | 740 | 820 | 910 |
| Gas – combined cycle | 410 | 490 | 650 |
| Biomass – Dedicated | 130 | 230 | 420 |
| Solar PV – Utility scale | 18 | 48 | 180 |
| Solar PV – rooftop | 26 | 41 | 60 |
| Geothermal | 6.0 | 38 | 79 |
| Concentrated solar power | 8.8 | 27 | 63 |
| Hydropower | 1.0 | 24 | 22001 |
| Wind Offshore | 8.0 | 12 | 35 |
| Nuclear | 3.7 | 12 | 110 |
| Wind Onshore | 7.0 | 11 | 56 |
| Pre‐commercial technologies | |||
| Ocean (Tidal and wave) | 5.6 | 17 | 28 |
1 see also environmental impact of reservoirs#Greenhouse gases.
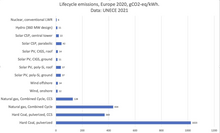
| Technology | gCO2eq/kWh | |
|---|---|---|
| Hard coal | PC, without CCS | 1000 |
| IGCC, without CCS | 850 | |
| SC, without CCS | 950 | |
| PC, with CCS | 370 | |
| IGCC, with CCS | 280 | |
| SC, with CCS | 330 | |
| Natural gas | NGCC, without CCS | 430 |
| NGCC, with CCS | 130 | |
| Hydro | 660 MW | 150 |
| 360 MW | 11 | |
| Nuclear | average | 5.1 |
| CSP | tower | 22 |
| trough | 42 | |
| PV | poly-Si, ground-mounted | 37 |
| poly-Si, roof-mounted | 37 | |
| CdTe, ground-mounted | 12 | |
| CdTe, roof-mounted | 15 | |
| CIGS, ground-mounted | 11 | |
| CIGS, roof-mounted | 14 | |
| Wind | onshore | 12 |
| offshore, concrete foundation | 14 | |
| offshore, steel foundation | 13 | |
List of acronyms:
- PC — pulverized coal
- CCS — carbon capture and storage
- IGCC — integrated gasification combined cycle
- SC — supercritical
- NGCC — natural gas combined cycle
- CSP — concentrated solar power
- PV — photovoltaic power
Relative CO2 emission from various fuels
One liter of gasoline, when used as a fuel, produces 2.32 kg (about 1300 liters or 1.3 cubic meters) of carbon dioxide, a greenhouse gas. One US gallon produces 19.4 lb (1,291.5 gallons or 172.65 cubic feet).
The mass of carbon dioxide that is released when one MJ of energy
is released from fuel can be estimated to a good approximation. For the chemical formula of diesel we use as an approximation C
nH
2n.
Note that diesel is a mixture of different molecules. As carbon has a
molar mass of 12 g/mol and hydrogen (atomic!) has a molar mass of about 1
g/mol, so the fraction by weight of carbon in diesel is roughly 12/14.
The reaction of diesel combustion is given by:
2C
nH
2n + 3nO
2 ⇌ 2nCO
2 + 2nH
2O
Carbon dioxide has a molar mass of 44g/mol as it consists of 2 atoms of oxygen (16 g/mol) and 1 atom of carbon (12 g/mol). So 12 g of carbon yield 44 g of Carbon dioxide. Diesel has an energy content of 42.6 MJ per kg or 23.47 gram of Diesel contain 1 MJ of energy. Putting everything together the mass of carbon dioxide that is produced by releasing 1MJ of energy from diesel fuel can be calculated as:
For gasoline, with 22 g/MJ and a ratio of carbon to hydrogen atoms of about 6 to 14, the estimated value of carbon emission for 1MJ of energy is:
| Fuel name | CO2 emitted (lbs/106 Btu) |
CO2 emitted (g/MJ) |
CO2 emitted (g/kWh) |
|---|---|---|---|
| Hydrogen gas | 0 | 0.0 | 0.0 |
| Natural gas | 117 | 50.30 | 181.08 |
| Liquefied petroleum gas | 139 | 59.76 | 215.14 |
| Propane | 139 | 59.76 | 215.14 |
| Aviation gasoline | 153 | 65.78 | 236.81 |
| Automobile gasoline | 156 | 67.07 | 241.45 |
| Kerosene | 159 | 68.36 | 246.10 |
| Fuel oil | 161 | 69.22 | 249.19 |
| Tires/tire derived fuel | 189 | 81.26 | 292.54 |
| Wood and wood waste | 195 | 83.83 | 301.79 |
| Coal (bituminous) | 205 | 88.13 | 317.27 |
| Coal (sub-bituminous) | 213 | 91.57 | 329.65 |
| Coal (lignite) | 215 | 92.43 | 332.75 |
| Petroleum coke | 225 | 96.73 | 348.23 |
| Coal (anthracite) | 227 | 97.59 | 351.32 |
Emissions by sector
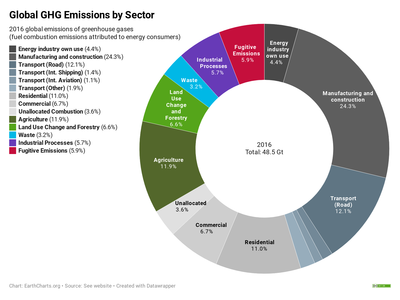
Global greenhouse gas emissions can be attributed to different sectors of the economy. This provides a picture of the varying contributions of different types of economic activity to global warming, and helps in understanding the changes required to mitigate climate change.
Manmade greenhouse gas emissions can be divided into those that arise from the combustion of fuels to produce energy, and those generated by other processes. Around two thirds of greenhouse gas emissions arise from the combustion of fuels.
Energy may be produced at the point of consumption, or by a generator for consumption by others. Thus emissions arising from energy production may be categorized according to where they are emitted, or where the resulting energy is consumed. If emissions are attributed at the point of production, then electricity generators contribute about 25% of global greenhouse gas emissions. If these emissions are attributed to the final consumer then 24% of total emissions arise from manufacturing and construction, 17% from transportation, 11% from domestic consumers, and 7% from commercial consumers. Around 4% of emissions arise from the energy consumed by the energy and fuel industry itself.
The remaining third of emissions arise from processes other than energy production. 12% of total emissions arise from agriculture, 7% from land use change and forestry, 6% from industrial processes, and 3% from waste. Around 6% of emissions are fugitive emissions, which are waste gases released by the extraction of fossil fuels.
As of 2020 Secunda CTL is the world's largest single emitter, at 56.5 million tonnes CO2 a year.
Agriculture
Agriculture contributes towards climate change through greenhouse gas emissions and by the conversion of non-agricultural land such as forests into agricultural land. In 2019 the IPCC reported that 13%-21% of anthropogenic greenhouse gasses came specifically from the Agriculture, Forestry, and Other Land Uses Sector (AFOLU). Emissions from agriculture of nitrous oxide, methane and carbon dioxide make up to half of the greenhouse-gases produced by the overall food industry, or 80% of agricultural emissions. Animal husbandry is a major source of greenhouse gas emissions.
The agricultural food system is responsible for a significant amount of greenhouse gas emissions. In addition to being a significant user of land and consumer of fossil fuel, agriculture contributes directly to greenhouse gas emissions through practices such as rice production and the raising of livestock. The three main causes of the increase in greenhouse gases observed over the past 250 years have been fossil fuels, land use, and agriculture. Farm animal digestive systems can be put into two categories: monogastric and ruminant. Ruminant cattle for beef and dairy rank high in greenhouse-gas emissions; monogastric, or pigs and poultry-related foods, are low. The consumption of the monogastric types may yield less emissions. Monogastric animals have a higher feed-conversion efficiency, and also do not produce as much methane.
There are many strategies that can be used to help soften the effects, and the further production of greenhouse gas emissions - this is also referred to as climate-smart agriculture. Some of these strategies include a higher efficiency in livestock farming, which includes management, as well as technology; a more effective process of managing manure; a lower dependence upon fossil-fuels and nonrenewable resources; a variation in the animals' eating and drinking duration, time and location; and a cutback in both the production and consumption of animal-sourced foods. A range of policies may reduce greenhouse gas emissions from the agriculture sector for a more sustainable food system.Aviation
Approximately 3.5% of the overall human impacts on climate are from the aviation sector. The impact of the sector on climate in the late 20 years had doubled, but the part of the contribution of the sector in comparison to other sectors did not change because other sectors grew as well.
Buildings and construction
In 2018, manufacturing construction materials and maintaining buildings accounted for 39% of carbon dioxide emissions from energy and process-related emissions. Manufacture of glass, cement, and steel accounted for 11% of energy and process-related emissions. Because building construction is a significant investment, more than two-thirds of buildings in existence will still exist in 2050. Retrofitting existing buildings to become more efficient will be necessary to meet the targets of the Paris Agreement; it will be insufficient to only apply low-emission standards to new construction. Buildings that produce as much energy as they consume are called zero-energy buildings, while buildings that produce more than they consume are energy-plus. Low-energy buildings are designed to be highly efficient with low total energy consumption and carbon emissions—a popular type is the passive house.
The global design and construction industry is responsible for approximately 39 percent of greenhouse gas emissions. Green building practices that avoid emissions or capture the carbon already present in the environment, allow for reduced footprint of the construction industry, for example, use of hempcrete, cellulose fiber insulation, and landscaping.
In 2019, the building sector was responsible for 12 GtCO2-eq emissions. More than 95% of these emissions were carbon, and the remaining 5% were CH4 N20 and halocarbon.
Digital sector
The digital sector produces between 2% and 4% of global GHG emissions, a large part of which is from chipmaking. However the sector reduces emissions from other sectors which have a larger global share, such as transport of people, and possibly buildings and industry.
Health care
The healthcare sector produces 4.4% - 4.6% of global greenhouse gas emissions.
Steel and aluminum
Steel and aluminum are key economic sectors for the carbon capture and storage. According to a 2013 study, "in 2004, the steel industry along emits about 590M tons of CO2, which accounts for 5.2% of the global anthropogenic GHG emissions. CO2 emitted from steel production primarily comes from energy consumption of fossil fuel as well as the use of limestone to purify iron oxides."
Electricity generation
Coal-fired power stations are the single largest emitter, with over 20% of global GhG in 2018. Although much less polluting than coal plants, natural gas-fired power plants are also major emitters, taking electricity generation as a whole over 25% in 2018. Notably, just 5% of the world's power plants account for almost three-quarters of carbon emissions from electricity generation, based on an inventory of more than 29,000 fossil-fuel power plants across 221 countries. In the 2022 IPCC report, it is noted that providing modern energy services universally would only increase greenhouse gas emissions by a few percent at most. This slight increase means that the additional energy demand that comes from supporting decent living standards for all would be far lower than current average energy consumption.
Plastics
Plastics are produced mainly from fossil fuels. It was estimated that between 3% and 4% of global GHG emissions are associated with plastics' life cycles. The EPA estimates as many as five mass units of carbon dioxide are emitted for each mass unit of polyethylene terephthalate (PET) produced—the type of plastic most commonly used for beverage bottles, the transportation produce greenhouse gases also. Plastic waste emits carbon dioxide when it degrades. In 2018 research claimed that some of the most common plastics in the environment release the greenhouse gases methane and ethylene when exposed to sunlight in an amount that can affect the earth climate.
Due to the lightness of plastic versus glass or metal, plastic may reduce energy consumption. For example, packaging beverages in PET plastic rather than glass or metal is estimated to save 52% in transportation energy, if the glass or metal package is single-use, of course.
In 2019 a new report "Plastic and Climate" was published. According to the report, the production and incineration of plastics will contribute in the equivalent of 850 million tonnes of carbon dioxide (CO2) to the atmosphere in 2019. With the current trend, annual life cycle greenhouse gas emissions of plastics will grow to 1.34 billion tonnes by 2030. By 2050, the life cycle emissions of plastics could reach 56 billion tonnes, as much as 14 percent of the Earth's remaining carbon budget. The report says that only solutions which involve a reduction in consumption can solve the problem, while others like biodegradable plastic, ocean cleanup, using renewable energy in plastic industry can do little, and in some cases may even worsen it.
Sanitation sector
Wastewater as well as sanitation systems are known to contribute to greenhouse-gas emissions (GHG) mainly through the breakdown of excreta during the treatment process. This results in the generation of methane gas, that is then released into the environment. Emissions from the sanitation and wastewater sector have been focused mainly on treatment systems, particularly treatment plants, and this accounts for the bulk of the carbon footprint for the sector.
In as much as climate impacts from wastewater and sanitation systems present global risks, low-income countries experience greater risks in many cases. In recent years, attention to adaptation needs within the sanitation sector is just beginning to gain momentum.
Tourism
According to UNEP, global tourism is a significant contributor to the increasing concentrations of greenhouse gases in the atmosphere.
Trucking and haulage
Over a quarter of global transport CO2 emissions are from road freight, so many countries are further restricting truck CO2 emissions to help limit climate change.
Deforestation
Deforestation is a major source of greenhouse gas emissions. A study shows annual carbon emissions (or carbon loss) from tropical deforestation have doubled during the last two decades and continue to increase. (0.97 ±0.16 PgC per year in 2001–2005 to 1.99 ±0.13 PgC per year in 2015–2019)
Regional and national attribution of emissions
From land-use change
Land-use change, e.g., the clearing of forests for agricultural use, can affect the concentration of greenhouse gases in the atmosphere by altering how much carbon flows out of the atmosphere into carbon sinks. Accounting for land-use change can be understood as an attempt to measure "net" emissions, i.e., gross emissions from all sources minus the removal of emissions from the atmosphere by carbon sinks.
There are substantial uncertainties in the measurement of net carbon emissions. Additionally, there is controversy over how carbon sinks should be allocated between different regions and over time. For instance, concentrating on more recent changes in carbon sinks is likely to favour those regions that have deforested earlier, e.g., Europe.
Greenhouse gas intensity
Greenhouse gas intensity is a ratio between greenhouse gas emissions and another metric, e.g., gross domestic product (GDP) or energy use. The terms "carbon intensity" and "emissions intensity" are also sometimes used. Emission intensities may be calculated using market exchange rates (MER) or purchasing power parity (PPP). Calculations based on MER show large differences in intensities between developed and developing countries, whereas calculations based on PPP show smaller differences. According to a study discussing the relationship between urbanization and carbon emissions, urbanization is becoming a huge player in the global carbon cycle. Depending on total carbon emissions done by a city that hasn't invested in carbon efficiency or improved resource management, the global carbon cycle is projected to reach 75% of the world population by 2030.
Cumulative and historical emissions
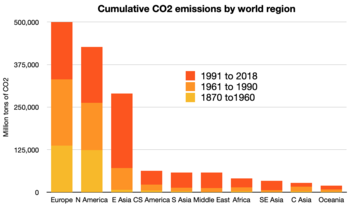
Cumulative anthropogenic (i.e., human-emitted) emissions of CO2 from fossil fuel use are a major cause of global warming, and give some indication of which countries have contributed most to human-induced climate change. In particular, CO2 stays in the atmosphere for at least 150 years, whilst methane and nitrous oxides generally disappear within a decade or so. The graph gives some indication of which regions have contributed most to human-induced climate change. When these numbers are calculated per capita cumulative emissions based on then-current population the situation is shown even more clearly. The ratio in per capita emissions between industrialized countries and developing countries was estimated at more than 10 to 1.
Non-OECD countries accounted for 42% of cumulative energy-related CO2 emissions between 1890 and 2007. Over this time period, the US accounted for 28% of emissions; the EU, 23%; Japan, 4%; other OECD countries 5%; Russia, 11%; China, 9%; India, 3%; and the rest of the world, 18%.
Overall, developed countries accounted for 83.8% of industrial CO2 emissions over this time period, and 67.8% of total CO2 emissions. Developing countries accounted for industrial CO2 emissions of 16.2% over this time period, and 32.2% of total CO2 emissions.
In comparison, humans have emitted more greenhouse gases than the Chicxulub meteorite impact event which caused the extinction of the dinosaurs.
Transport, together with electricity generation, is the major source of greenhouse gas emissions in the EU. Greenhouse gas emissions from the transportation sector continue to rise, in contrast to power generation and nearly all other sectors. Since 1990, transportation emissions have increased by 30%. The transportation sector accounts for around 70% of these emissions. The majority of these emissions are caused by passenger vehicles and vans. Road travel is the first major source of greenhouse gas emissions from transportation, followed by aircraft and maritime. Waterborne transportation is still the least carbon-intensive mode of transportation on average, and it is an essential link in sustainable multimodal freight supply chains.
Buildings, like industry, are directly responsible for around one-fifth of greenhouse gas emissions, primarily from space heating and hot water consumption. When combined with power consumption within buildings, this figure climbs to more than one-third.
Within the EU, the agricultural sector presently accounts for roughly 10% of total greenhouse gas emissions, with methane from livestock accounting for slightly more than half of 10%.
Estimates of total CO2 emissions do include biotic carbon emissions, mainly from deforestation. Including biotic emissions brings about the same controversy mentioned earlier regarding carbon sinks and land-use change. The actual calculation of net emissions is very complex, and is affected by how carbon sinks are allocated between regions and the dynamics of the climate system.
The graphic shows the logarithm of 1850–2019 fossil fuel CO2 emissions; natural log on left, actual value of Gigatons per year on right. Although emissions increased during the 170-year period by about 3% per year overall, intervals of distinctly different growth rates (broken at 1913, 1945, and 1973) can be detected. The regression lines suggest that emissions can rapidly shift from one growth regime to another and then persist for long periods of time. The most recent drop in emissions growth - by almost 3 percentage points - was at about the time of the 1970s energy crisis. Percent changes per year were estimated by piecewise linear regression on the log data and are shown on the plot; the data are from The Integrated Carbon Observation system.
Changes since a particular base year
The sharp acceleration in CO2
emissions since 2000 to more than a 3% increase per year (more than
2 ppm per year) from 1.1% per year during the 1990s is attributable to
the lapse of formerly declining trends in carbon intensity
of both developing and developed nations. China was responsible for
most of global growth in emissions during this period. Localised
plummeting emissions associated with the collapse of the Soviet Union
have been followed by slow emissions growth in this region due to more efficient energy use, made necessary by the increasing proportion of it that is exported. In comparison, methane has not increased appreciably, and N
2O by 0.25% y−1.
Using different base years for measuring emissions has an effect on estimates of national contributions to global warming. This can be calculated by dividing a country's highest contribution to global warming starting from a particular base year, by that country's minimum contribution to global warming starting from a particular base year. Choosing between base years of 1750, 1900, 1950, and 1990 has a significant effect for most countries. Within the G8 group of countries, it is most significant for the UK, France and Germany. These countries have a long history of CO2 emissions (see the section on Cumulative and historical emissions).
Annual emissions
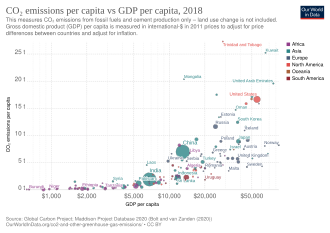
Annual per capita emissions in the industrialized countries are typically as much as ten times the average in developing countries. Due to China's fast economic development, its annual per capita emissions are quickly approaching the levels of those in the Annex I group of the Kyoto Protocol (i.e., the developed countries excluding the US). Other countries with fast growing emissions are South Korea, Iran, and Australia (which apart from the oil rich Persian Gulf states, now has the highest per capita emission rate in the world). On the other hand, annual per capita emissions of the EU-15 and the US are gradually decreasing over time. Emissions in Russia and Ukraine have decreased fastest since 1990 due to economic restructuring in these countries.
Energy statistics for fast-growing economies are less accurate than those for industrialized countries.
The greenhouse gas footprint refers to the emissions resulting from the creation of products or services. It is more comprehensive than the commonly used carbon footprint, which measures only carbon dioxide, one of many greenhouse gases.
2015 was the first year to see both total global economic growth and a reduction of carbon emissions.
Top emitter countries
Annual
In 2019, China, the United States, India, the EU27+UK, Russia, and Japan - the world's largest CO2 emitters - together accounted for 51% of the population, 62.5% of global gross domestic product, 62% of total global fossil fuel consumption and emitted 67% of total global fossil CO2. Emissions from these five countries and the EU28 show different changes in 2019 compared to 2018: the largest relative increase is found for China (+3.4%), followed by India (+1.6%). On the contrary, the EU27+UK (-3.8%), the United States (-2.6%), Japan (-2.1%) and Russia (-0.8%) reduced their fossil CO2 emissions.
| Country | total emissions (Mton) |
Share (%) |
per capita (ton) |
per GDP (ton/k$) |
|---|---|---|---|---|
| Global Total | 38,016.57 | 100.00 | 4.93 | 0.29 |
| 11,535.20 | 30.34 | 8.12 | 0.51 | |
| 5,107.26 | 13.43 | 15.52 | 0.25 | |
| EU27+UK | 3,303.97 | 8.69 | 6.47 | 0.14 |
| 2,597.36 | 6.83 | 1.90 | 0.28 | |
| 1,792.02 | 4.71 | 12.45 | 0.45 | |
| 1,153.72 | 3.03 | 9.09 | 0.22 | |
| International Shipping | 730.26 | 1.92 | - | - |
| 702.60 | 1.85 | 8.52 | 0.16 | |
| 701.99 | 1.85 | 8.48 | 0.68 | |
| 651.87 | 1.71 | 12.70 | 0.30 | |
| International Aviation | 627.48 | 1.65 | - | - |
| 625.66 | 1.65 | 2.32 | 0.20 | |
| 614.61 | 1.62 | 18.00 | 0.38 | |
| 584.85 | 1.54 | 15.69 | 0.32 | |
| 494.86 | 1.30 | 8.52 | 0.68 | |
| 485.00 | 1.28 | 3.67 | 0.19 | |
| 478.15 | 1.26 | 2.25 | 0.15 | |
| 433.38 | 1.14 | 17.27 | 0.34 | |
| 415.78 | 1.09 | 5.01 | 0.18 | |
| 364.91 | 0.96 | 5.45 | 0.12 | |
| 331.56 | 0.87 | 5.60 | 0.13 | |
| 317.65 | 0.84 | 8.35 | 0.25 | |
| 314.74 | 0.83 | 4.81 | 0.10 | |
| 305.25 | 0.80 | 3.13 | 0.39 | |
| 277.36 | 0.73 | 14.92 | 0.57 | |
| 276.78 | 0.73 | 11.65 | 0.23 | |
| 275.06 | 0.72 | 3.97 | 0.21 | |
| 259.31 | 0.68 | 5.58 | 0.13 | |
| 255.37 | 0.67 | 2.52 | 0.22 | |
| 248.83 | 0.65 | 7.67 | 0.27 | |
| 223.63 | 0.59 | 1.09 | 0.22 | |
| 222.61 | 0.59 | 22.99 | 0.34 | |
| 199.41 | 0.52 | 4.42 | 0.20 | |
| 197.61 | 0.52 | 4.89 | 0.46 | |
| 196.40 | 0.52 | 4.48 | 0.36 | |
| 180.57 | 0.47 | 4.23 | 0.37 | |
| 156.41 | 0.41 | 9.13 | 0.16 | |
| 150.64 | 0.40 | 1.39 | 0.16 | |
| 110.16 | 0.29 | 0.66 | 0.14 | |
| 110.06 | 0.29 | 3.36 | 0.39 | |
| 106.53 | 0.28 | 38.82 | 0.41 | |
| 105.69 | 0.28 | 9.94 | 0.25 | |
| 104.41 | 0.27 | 9.03 | 0.18 | |
| 100.22 | 0.26 | 0.50 | 0.10 | |
| 98.95 | 0.26 | 23.29 | 0.47 | |
| 94.99 | 0.25 | 2.90 | 0.40 | |
| 92.78 | 0.24 | 18.55 | 0.67 | |
| 90.52 | 0.24 | 15.23 | 0.98 | |
| 89.89 | 0.24 | 4.90 | 0.20 | |
| 86.55 | 0.23 | 1.74 | 0.12 | |
| 78.63 | 0.21 | 4.04 | 0.14 | |
| 73.91 | 0.19 | 2.02 | 0.27 | |
| 72.36 | 0.19 | 8.25 | 0.14 | |
| 70.69 | 0.19 | 7.55 | 0.44 | |
| 68.33 | 0.18 | 7.96 | 0.18 | |
| 66.34 | 0.17 | 7.03 | 0.37 | |
| 65.57 | 0.17 | 5.89 | 0.20 | |
| 56.29 | 0.15 | 1.71 | 0.13 | |
| 53.37 | 0.14 | 9.09 | 0.10 | |
| 53.18 | 0.14 | 5.51 | 0.17 | |
| 52.05 | 0.14 | 7.92 | 0.51 | |
| 48.47 | 0.13 | 4.73 | 0.14 | |
| 48.31 | 0.13 | 0.89 | 0.17 | |
| 47.99 | 0.13 | 8.89 | 0.14 | |
| 44.75 | 0.12 | 4.45 | 0.08 | |
| 44.02 | 0.12 | 5.88 | 0.10 | |
| 43.41 | 0.11 | 7.81 | 0.16 | |
| 43.31 | 0.11 | 6.20 | 0.27 | |
| 42.17 | 0.11 | 1.64 | 0.36 | |
| 40.70 | 0.11 | 2.38 | 0.21 | |
| 39.37 | 0.10 | 4.57 | 0.07 | |
| 38.67 | 0.10 | 8.07 | 0.18 | |
| 36.55 | 0.10 | 7.54 | 0.09 | |
| 35.99 | 0.09 | 6.60 | 0.20 | |
| 35.98 | 0.09 | 3.59 | 0.25 | |
| 35.93 | 0.09 | 11.35 | 0.91 | |
| 35.44 | 0.09 | 21.64 | 0.48 | |
| 33.50 | 0.09 | 9.57 | 0.68 | |
| 32.74 | 0.09 | 23.81 | 0.90 | |
| 32.07 | 0.08 | 2.72 | 0.25 | |
| 31.12 | 0.08 | 5.39 | 0.09 | |
| 31.04 | 0.08 | 2.70 | 0.11 | |
| 29.16 | 0.08 | 1.58 | 1.20 | |
| 28.34 | 0.07 | 2.81 | 0.28 | |
| 27.57 | 0.07 | 1.31 | 0.10 | |
| 27.44 | 0.07 | 4.52 | 0.27 | |
| 27.28 | 0.07 | 2.48 | 0.14 | |
| 25.82 | 0.07 | 0.81 | 0.12 | |
| 24.51 | 0.06 | 2.15 | 0.24 | |
| 22.57 | 0.06 | 0.40 | 0.13 | |
| 21.20 | 0.06 | 1.21 | 0.15 | |
| 19.81 | 0.05 | 0.38 | 0.09 | |
| 19.12 | 0.05 | 4.62 | 0.16 | |
| 18.50 | 0.05 | 14.19 | 0.38 | |
| 18.25 | 0.05 | 0.17 | 0.07 | |
| 16.84 | 0.04 | 0.56 | 0.10 | |
| 16.49 | 0.04 | 1.00 | 0.23 | |
| 15.66 | 0.04 | 55.25 | 1.67 | |
| 15.37 | 0.04 | 7.38 | 0.19 | |
| 15.02 | 0.04 | 0.50 | 0.15 | |
| 13.77 | 0.04 | 4.81 | 0.13 | |
| 13.56 | 0.04 | 0.53 | 0.10 | |
| 13.47 | 0.04 | 3.45 | 0.24 | |
| 13.34 | 0.04 | 0.22 | 0.09 | |
| 11.92 | 0.03 | 1.92 | 0.35 | |
| 11.63 | 0.03 | 2.75 | 0.09 | |
| 11.00 | 0.03 | 0.30 | 0.13 | |
| 10.89 | 0.03 | 0.37 | 0.17 | |
| 10.86 | 0.03 | 0.63 | 0.26 | |
| 10.36 | 0.03 | 1.08 | 0.19 | |
| 10.10 | 0.03 | 0.40 | 0.11 | |
| 9.81 | 0.03 | 0.59 | 0.18 | |
| 9.74 | 0.03 | 16.31 | 0.14 | |
| 9.26 | 0.02 | 0.29 | 0.24 | |
| 9.23 | 0.02 | 2.29 | 0.27 | |
| 8.98 | 0.02 | 1.80 | 0.09 | |
| 8.92 | 0.02 | 4.28 | 0.26 | |
| 8.92 | 0.02 | 0.96 | 0.28 | |
| 8.47 | 0.02 | 1.21 | 0.09 | |
| 8.38 | 0.02 | 4.38 | 0.14 | |
| 8.15 | 0.02 | 0.69 | 0.21 | |
| 7.66 | 0.02 | 1.64 | 0.33 | |
| 7.50 | 0.02 | 0.41 | 0.12 | |
| 7.44 | 0.02 | 2.56 | 0.26 | |
| 7.41 | 0.02 | 6.19 | 0.21 | |
| 7.15 | 0.02 | 1.11 | 0.13 | |
| 7.04 | 0.02 | 2.96 | 0.17 | |
| 7.02 | 0.02 | 15.98 | 0.26 | |
| 6.78 | 0.02 | 0.96 | 0.12 | |
| 6.56 | 0.02 | 1.89 | 0.09 | |
| 5.92 | 0.02 | 2.02 | 0.15 | |
| 5.91 | 0.02 | 36.38 | 1.51 | |
| 5.86 | 0.02 | 0.92 | 0.17 | |
| 5.80 | 0.02 | 1.05 | 0.33 | |
| 5.66 | 0.01 | 1.93 | 0.14 | |
| 5.34 | 0.01 | 0.12 | 0.06 | |
| 4.40 | 0.01 | 1.67 | 0.18 | |
| 4.33 | 0.01 | 3.41 | 0.15 | |
| 4.20 | 0.01 | 0.16 | 0.09 | |
| 4.07 | 0.01 | 0.47 | 0.11 | |
| 3.93 | 0.01 | 11.53 | 0.19 | |
| 3.91 | 0.01 | 1.07 | 0.04 | |
| 3.83 | 0.01 | 13.34 | 0.85 | |
| 3.64 | 0.01 | 0.18 | 0.08 | |
| 3.58 | 0.01 | 0.32 | 0.18 | |
| 3.48 | 0.01 | 1.65 | 0.11 | |
| 3.47 | 0.01 | 2.55 | 0.14 | |
| 3.02 | 0.01 | 3.40 | - | |
| 2.98 | 0.01 | 0.03 | 0.03 | |
| 2.92 | 0.01 | 0.22 | 0.09 | |
| 2.85 | 0.01 | 0.35 | 0.22 | |
| 2.45 | 0.01 | 6.08 | 0.18 | |
| 2.36 | 0.01 | 0.10 | 0.08 | |
| 2.12 | 0.01 | 2.57 | 0.24 | |
| 2.06 | 0.01 | 3.59 | 0.22 | |
| 1.95 | 0.01 | 5.07 | - | |
| 1.87 | 0.00 | 4.17 | - | |
| 1.62 | 0.00 | 0.08 | 0.08 | |
| 1.52 | 0.00 | 1.94 | 0.20 | |
| 1.40 | 0.00 | 0.18 | 0.10 | |
| 1.36 | 0.00 | 1.48 | 0.11 | |
| 1.33 | 0.00 | 59.88 | 4.09 | |
| 1.27 | 0.00 | 1.98 | 0.02 | |
| 1.21 | 0.00 | 0.24 | 0.17 | |
| 1.15 | 0.00 | 0.09 | 0.04 | |
| 1.14 | 0.00 | 0.81 | 0.11 | |
| 1.05 | 0.00 | 1.06 | 0.20 | |
| 1.05 | 0.00 | 10.98 | 0.37 | |
| 1.04 | 0.00 | 2.41 | 0.05 | |
| 1.03 | 0.00 | 0.05 | 0.02 | |
| 1.02 | 0.00 | 1.83 | 0.26 | |
| 0.97 | 0.00 | 0.06 | 0.57 | |
| 0.91 | 0.00 | 2.02 | 0.09 | |
| 0.89 | 0.00 | 0.06 | 0.04 | |
| 0.78 | 0.00 | 7.39 | 0.19 | |
| 0.75 | 0.00 | 0.14 | 0.08 | |
| 0.75 | 0.00 | 0.33 | 0.13 | |
| 0.69 | 0.00 | 19.88 | 0.45 | |
| 0.61 | 0.00 | 2.06 | - | |
| 0.60 | 0.00 | 2.08 | 0.10 | |
| 0.59 | 0.00 | 0.27 | 0.11 | |
| 0.54 | 0.00 | 9.47 | 0.19 | |
| 0.51 | 0.00 | 4.90 | 0.24 | |
| 0.49 | 0.00 | 0.10 | 0.11 | |
| 0.44 | 0.00 | 0.22 | 0.11 | |
| 0.40 | 0.00 | 6.38 | 0.09 | |
| 0.38 | 0.00 | 0.28 | 0.10 | |
| 0.37 | 0.00 | 0.95 | 0.14 | |
| 0.35 | 0.00 | 5.75 | 0.14 | |
| 0.34 | 0.00 | 0.03 | 0.04 | |
| 0.30 | 0.00 | 1.65 | 0.11 | |
| 0.30 | 0.00 | 0.51 | - | |
| 0.23 | 0.00 | 2.10 | 0.12 | |
| 0.21 | 0.00 | 0.25 | 0.08 | |
| 0.19 | 0.00 | 3.44 | 0.14 | |
| 0.16 | 0.00 | 0.75 | 0.19 | |
| 0.15 | 0.00 | 1.32 | 0.11 | |
| 0.14 | 0.00 | 0.70 | 0.11 | |
| 0.14 | 0.00 | 0.22 | 0.09 | |
| 0.13 | 0.00 | 1.16 | 0.20 | |
| 0.13 | 0.00 | 3.70 | 0.13 | |
| 0.12 | 0.00 | 3.77 | 0.17 | |
| 0.10 | 0.00 | 1.38 | 0.12 | |
| 0.09 | 0.00 | 0.30 | 0.09 | |
| 0.06 | 0.00 | 9.72 | - | |
| 0.04 | 0.00 | 2.51 | - | |
| 0.03 | 0.00 | 10.87 | - | |
| 0.03 | 0.00 | 0.28 | 0.13 | |
| 0.02 | 0.00 | 1.54 | 0.12 | |
| 0.02 | 0.00 | 3.87 | - | |
| Faroes | 0.00 | 0.00 | 0.04 | 0.00 |
Embedded emissions
One way of attributing greenhouse gas emissions is to measure the embedded emissions (also referred to as "embodied emissions") of goods that are being consumed. Emissions are usually measured according to production, rather than consumption. For example, in the main international treaty on climate change (the UNFCCC), countries report on emissions produced within their borders, e.g., the emissions produced from burning fossil fuels. Under a production-based accounting of emissions, embedded emissions on imported goods are attributed to the exporting, rather than the importing, country. Under a consumption-based accounting of emissions, embedded emissions on imported goods are attributed to the importing country, rather than the exporting, country.
Davis and Caldeira (2010) found that a substantial proportion of CO2 emissions are traded internationally. The net effect of trade was to export emissions from China and other emerging markets to consumers in the US, Japan, and Western Europe.
Fiscal decentralisation and carbon reductions
As carbon oxides are one important source of greenhouse gas, having means to reduce it is important. One suggestion, is to consider some means in relation to fiscal decentralisation. Previous research found that the linear term of fiscal decentralization promotes carbon emissions, while the non-linear term mitigates it. It verified the inverted U-shaped curve between fiscal decentralization and carbon emissions. Besides, increasing energy prices for non-renewable energy decrease carbon emission due to a substitution effect. Among other explanatory variables, improvement in the quality of institutions decreases carbon emissions, while the gross domestic product increases it. Strengthening fiscal decentralization, lowering non-renewable energy prices, and improving institutional quality to check the deteriorating environmental quality in the study sample and other worldwide regions can reduce carbon emissions.
Effect of policy
Governments have taken action to reduce greenhouse gas emissions to mitigate climate change. Assessments of policy effectiveness have included work by the Intergovernmental Panel on Climate Change, International Energy Agency, and United Nations Environment Programme. Policies implemented by governments have included national and regional targets to reduce emissions, promoting energy efficiency, and support for a renewable energy transition, such as Solar energy, as an effective use of renewable energy because solar uses energy from the sun and does not release pollutants into the air.
Countries and regions listed in Annex I of the United Nations Framework Convention on Climate Change (UNFCCC) (i.e., the OECD and former planned economies of the Soviet Union) are required to submit periodic assessments to the UNFCCC of actions they are taking to address climate change.
Due to the COVID-19 pandemic, there was a significant reduction in CO2 emissions globally in 2020.
In 2020, carbon dioxide (CO2) reductions were at an all-time low since World War II. However, by December 2020, carbon emissions surpassed those in 2019 by 2%.
Projections
| Futures studies |
|---|
| Concepts |
| Techniques |
| Technology assessment and forecasting |
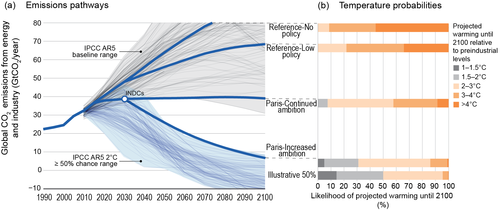
Climate change scenarios or socioeconomic scenarios are projections of future greenhouse gas (GHG) emissions used by analysts to assess future vulnerability to climate change. Scenarios and pathways are created by scientists to survey any long term routes and explore the effectiveness of mitigation and helps us understand what the future may hold this will allow us to envision the future of human environment system. Producing scenarios requires estimates of future population levels, economic activity, the structure of governance, social values, and patterns of technological change. Economic and energy modelling (such as the World3 or the POLES models) can be used to analyze and quantify the effects of such drivers.
Scientists can develop separate international, regional and national climate change scenarios. These scenarios are designed to help stakeholders understand what kinds of decisions will have meaningful effects on climate change mitigation or adaptation. Most countries developing adaptation plans or Nationally Determined Contributions will commission scenario studies in order to better understand the decisions available to them.
International goals for mitigating climate change through international processes like the Intergovernmental Panel on Climate Change (IPCC), the Paris Agreement and Sustainable Development Goal 13 ("Take urgent action to combat climate change and its impacts") are based on reviews of these scenarios. For example, the Special Report on Global Warming of 1.5 °C was released in 2018 order to reflect more up-to-date models of emissions, Nationally Determined Contributions, and impacts of climate change than its predecessor IPCC Fifth Assessment Report published in 2014 before the Paris Agreement.