In thermodynamics, a critical point (or critical state) is the end point of a phase equilibrium curve. One example is the liquid–vapor critical point, the end point of the pressure–temperature curve that designates conditions under which a liquid and its vapor can coexist. At higher temperatures, the gas comes into a supercritical phase, and so cannot be liquefied by pressure alone. At the critical point, defined by a critical temperature Tc and a critical pressure pc, phase boundaries vanish. Other examples include the liquid–liquid critical points in mixtures, and the ferromagnet–paramagnet transition (Curie temperature) in the absence of an external magnetic field.
Liquid–vapor critical point
Overview

For simplicity and clarity, the generic notion of critical point is best introduced by discussing a specific example, the vapor–liquid critical point. This was the first critical point to be discovered, and it is still the best known and most studied one.
The figure shows the schematic P-T diagram of a pure substance (as opposed to mixtures, which have additional state variables and richer phase diagrams, discussed below). The commonly known phases solid, liquid and vapor are separated by phase boundaries, i.e. pressure–temperature combinations where two phases can coexist. At the triple point, all three phases can coexist. However, the liquid–vapor boundary terminates in an endpoint at some critical temperature Tc and critical pressure pc. This is the critical point.
The critical point of water occurs at 647.096 K (373.946 °C; 705.103 °F) and 22.064 megapascals (3,200.1 psi; 217.75 atm; 220.64 bar).
In the vicinity of the critical point, the physical properties of the liquid and the vapor change dramatically, with both phases becoming even more similar. For instance, liquid water under normal conditions is nearly incompressible, has a low thermal expansion coefficient, has a high dielectric constant, and is an excellent solvent for electrolytes. Near the critical point, all these properties change into the exact opposite: water becomes compressible, expandable, a poor dielectric, a bad solvent for electrolytes, and mixes more readily with nonpolar gases and organic molecules.
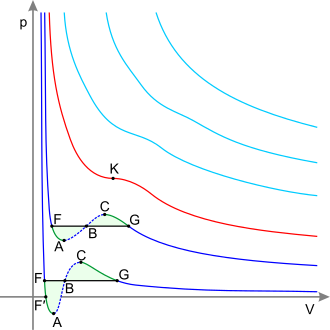
At the critical point, only one phase exists. The heat of vaporization is zero. There is a stationary inflection point in the constant-temperature line (critical isotherm) on a PV diagram. This means that at the critical point:

Above the critical point there exists a state of matter that is continuously connected with (can be transformed without phase transition into) both the liquid and the gaseous state. It is called supercritical fluid. The common textbook knowledge that all distinction between liquid and vapor disappears beyond the critical point has been challenged by Fisher and Widom, who identified a p–T line that separates states with different asymptotic statistical properties (Fisher–Widom line).
Sometimes the critical point does not manifest in most thermodynamic or mechanical properties, but is "hidden" and reveals itself in the onset of inhomogeneities in elastic moduli, marked changes in the appearance and local properties of non-affine droplets, and a sudden enhancement in defect pair concentration.
History

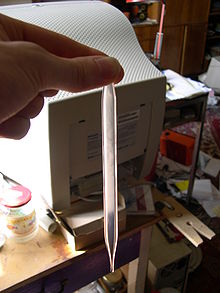
The existence of a critical point was first discovered by Charles Cagniard de la Tour in 1822 and named by Dmitri Mendeleev in 1860 and Thomas Andrews in 1869. Cagniard showed that CO2 could be liquefied at 31 °C at a pressure of 73 atm, but not at a slightly higher temperature, even under pressures as high as 3000 atm.
Theory
Solving the above condition for the van der Waals equation, one can compute the critical point as
However, the van der Waals equation, based on a mean-field theory, does not hold near the critical point. In particular, it predicts wrong scaling laws.
To analyse properties of fluids near the critical point, reduced state variables are sometimes defined relative to the critical properties
The principle of corresponding states indicates that substances at equal reduced pressures and temperatures have equal reduced volumes. This relationship is approximately true for many substances, but becomes increasingly inaccurate for large values of pr.
For some gases, there is an additional correction factor, called Newton's correction, added to the critical temperature and critical pressure calculated in this manner. These are empirically derived values and vary with the pressure range of interest.
Table of liquid–vapor critical temperature and pressure for selected substances
| Substance | Critical temperature | Critical pressure (absolute) |
|---|---|---|
| Argon | −122.4 °C (150.8 K) | 48.1 atm (4,870 kPa) |
| Ammonia (NH3) | 132.4 °C (405.5 K) | 111.3 atm (11,280 kPa) |
| R-134a | 101.06 °C (374.21 K) | 40.06 atm (4,059 kPa) |
| R-410A | 72.8 °C (345.9 K) | 47.08 atm (4,770 kPa) |
| Bromine | 310.8 °C (584.0 K) | 102 atm (10,300 kPa) |
| Caesium | 1,664.85 °C (1,938.00 K) | 94 atm (9,500 kPa) |
| Chlorine | 143.8 °C (416.9 K) | 76.0 atm (7,700 kPa) |
| Ethane (C2H6) | 31.17 °C (304.32 K) | 48.077 atm (4,871.4 kPa) |
| Ethanol (C2H5OH) | 241 °C (514 K) | 62.18 atm (6,300 kPa) |
| Fluorine | −128.85 °C (144.30 K) | 51.5 atm (5,220 kPa) |
| Helium | −267.96 °C (5.19 K) | 2.24 atm (227 kPa) |
| Hydrogen | −239.95 °C (33.20 K) | 12.8 atm (1,300 kPa) |
| Krypton | −63.8 °C (209.3 K) | 54.3 atm (5,500 kPa) |
| Methane (CH4) | −82.3 °C (190.8 K) | 45.79 atm (4,640 kPa) |
| Neon | −228.75 °C (44.40 K) | 27.2 atm (2,760 kPa) |
| Nitrogen | −146.9 °C (126.2 K) | 33.5 atm (3,390 kPa) |
| Oxygen (O2) | −118.6 °C (154.6 K) | 49.8 atm (5,050 kPa) |
| Carbon dioxide (CO2) | 31.04 °C (304.19 K) | 72.8 atm (7,380 kPa) |
| Nitrous oxide (N2O) | 36.4 °C (309.5 K) | 71.5 atm (7,240 kPa) |
| Sulfuric acid (H2SO4) | 654 °C (927 K) | 45.4 atm (4,600 kPa) |
| Xenon | 16.6 °C (289.8 K) | 57.6 atm (5,840 kPa) |
| Lithium | 2,950 °C (3,220 K) | 652 atm (66,100 kPa) |
| Mercury | 1,476.9 °C (1,750.1 K) | 1,720 atm (174,000 kPa) |
| Sulfur | 1,040.85 °C (1,314.00 K) | 207 atm (21,000 kPa) |
| Iron | 8,227 °C (8,500 K) |
|
| Gold | 6,977 °C (7,250 K) | 5,000 atm (510,000 kPa) |
| Aluminium | 7,577 °C (7,850 K) |
|
| Water (H2O)[ | 373.946 °C (647.096 K) | 217.7 atm (22,060 kPa) |
Mixtures: liquid–liquid critical point

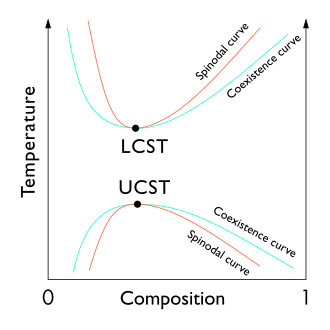
The liquid–liquid critical point of a solution, which occurs at the critical solution temperature, occurs at the limit of the two-phase region of the phase diagram. In other words, it is the point at which an infinitesimal change in some thermodynamic variable (such as temperature or pressure) leads to separation of the mixture into two distinct liquid phases, as shown in the polymer–solvent phase diagram to the right. Two types of liquid–liquid critical points are the upper critical solution temperature (UCST), which is the hottest point at which cooling induces phase separation, and the lower critical solution temperature (LCST), which is the coldest point at which heating induces phase separation.


