Search This Blog

Wednesday, June 19, 2024

Stock market crash

From Wikipedia, the free encyclopedia
https://en.wikipedia.org/wiki/Stock_market_crash
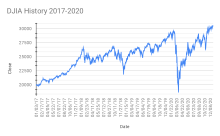
Stock price graph illustrating the 2020 stock market crash, showing a sharp drop in stock price, followed by a recovery

A stock market crash is a sudden dramatic decline of stock prices across a major cross-section of a stock market, resulting in a significant loss of paper wealth. Crashes are driven by panic selling and underlying economic factors. They often follow speculation and economic bubbles.

A stock market crash is a social phenomenon where external economic events combine with crowd psychology in a positive feedback loop where selling by some market participants drives more market participants to sell. Generally speaking, crashes usually occur under the following conditions: a prolonged period of rising stock prices (a bull market) and excessive economic optimism, a market where price–earnings ratios exceed long-term averages, and extensive use of margin debt and leverage by market participants. Other aspects such as wars, large corporate hacks, changes in federal laws and regulations, and natural disasters within economically productive areas may also influence a significant decline in the stock market value of a wide range of stocks. Stock prices for corporations competing against the affected corporations may rise despite the crash.

There is no numerically specific definition of a stock market crash but the term commonly applies to declines of over 10% in a stock market index over a period of several days. Crashes are often distinguished from bear markets (periods of declining stock market prices that are measured in months or years) as crashes include panic selling and abrupt, dramatic price declines. Crashes are often associated with bear markets; however, they do not necessarily occur simultaneously. Black Monday (1987), for example, did not lead to a bear market. Likewise, the bursting of the Japanese asset price bubble occurred over several years without any notable crashes. Stock market crashes are not common.

Crashes are generally unexpected. As Niall Ferguson stated, "Before the crash, our world seems almost stationary, deceptively so, balanced, at a set point. So that when the crash finally hits — as inevitably it will — everyone seems surprised. And our brains keep telling us it’s not time for a crash."

Examples

Tulip Mania

Tulip Mania (1634–1637), in which some single tulip bulbs allegedly sold for more than 10 times the annual income of a skilled artisan, is often considered to be the first recorded economic bubble.

Panic of 1907

In 1907 and in 1908, stock prices fell by nearly 50% due to a variety of factors, led by the manipulation of copper stocks by the Knickerbocker Trust Company. Shares of United Copper rose gradually up to October, and thereafter crashed, leading to panic. Several investment trusts and banks that had invested their money in the stock market fell and started to close down. Further bank runs were prevented due to the intervention of J. P. Morgan. The panic continued to 1908 and led to the formation of the Federal Reserve in 1913.

Wall Street Crash of 1929
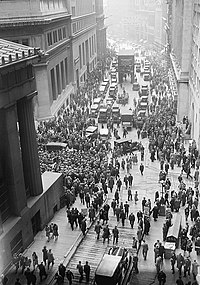
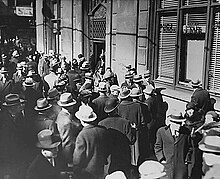
Crowd gathering on Wall Street the day after the 1929 crash

The economy grew for most of the Roaring Twenties. It was a technological golden age, as innovations such as the radio, automobile, aviation, telephone, and the electric power transmission grid were deployed and adopted. Companies that had pioneered these advances, including Radio Corporation of America (RCA) and General Motors, saw their stocks soar. Financial corporations also did well, as Wall Street bankers floated mutual fund companies (then known as investment trusts) like the Goldman Sachs Trading Corporation. Investors were infatuated with the returns available in the stock market, especially by the use of leverage through margin debt (i.e., borrowing money from your stockbroker to finance part of your purchase of stocks, using the bought securities as collateral).

On August 24, 1921, the Dow Jones Industrial Average (DJIA) was at 63.9. By September 3, 1929, it had risen more than sixfold to 381.2. It did not regain this level for another 25 years. By the summer of 1929, it was clear that the economy was contracting, and the stock market went through a series of unsettling price declines. These declines fed investor anxiety, and events came to a head on October 24, 28, and 29 (known respectively as Black Thursday, Black Monday, and Black Tuesday).

On Black Monday, the DJIA fell 38.33 points to 260, a drop of 12.8%. The deluge of selling overwhelmed the ticker tape system that normally gave investors the current prices of their shares. Telephone lines and telegraphs were clogged and were unable to cope. This information vacuum only led to more fear and panic. The technology of the New Era, previously much celebrated by investors, now served to deepen their suffering.

The following day, Black Tuesday, was a day of chaos. Forced to liquidate their stocks because of margin calls, overextended investors flooded the exchange with sell orders. The Dow fell 30.57 points to close at 230.07 on that day. The glamour stocks of the age saw their values plummet. Across the two days, the DJIA fell 23%.

By the end of the weekend of November 11, 1929, the index stood at 228, a cumulative drop of 40% from the September high. The markets rallied in succeeding months, but it was a temporary recovery that led unsuspecting investors into further losses. The DJIA lost 89% of its value before finally bottoming out in July 1932. The crash was followed by the Great Depression, the worst economic crisis of modern times, which plagued the stock market and Wall Street throughout the 1930s.

October 19, 1987
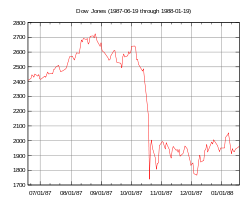
DJIA (19 July 1987 through 19 January 1988)

The mid-1980s were a time of strong economic optimism. From August 1982 to its peak in August 1987, the Dow Jones Industrial Average (DJIA) rose from 776 to 2722. The rise in market indices for the 19 largest markets in the world averaged 296% during this period. The average number of shares traded on the New York Stock Exchange rose from 65 million shares to 181 million shares.

The crash on October 19, 1987, Black Monday, was the climactic culmination of a market decline that had begun five days before on October 14. The DJIA fell 3.81% on October 14, followed by another 4.60% drop on Friday, October 16. On Black Monday, the DJIA plummeted 508 points, losing 22.6% of its value in one day. The S&P 500 Index dropped 20.4%, falling from 282.7 to 225.06. The NASDAQ Composite lost only 11.3%, not because of restraint on the part of sellers, but because the NASDAQ market system failed. Deluged with sell orders, many stocks on the NYSE faced trading halts and delays. Of the 2,257 NYSE-listed stocks, there were 195 trading delays and halts during the day. The NASDAQ market fared much worse. Because of its reliance on a "market making" system that allowed market makers to withdraw from trading, liquidity in NASDAQ stocks dried up. Trading in many stocks encountered a pathological condition where the bid price for a stock exceeded the ask price. These "locked" conditions severely curtailed trading. On October 19, trading in Microsoft shares on the NASDAQ lasted a total of 54 minutes.

The crash was the greatest single-day loss that Wall Street had ever suffered in continuous trading up to that point. Between the start of trading on October 14 to the close on October 19, the DJIA lost 760 points, a decline of over 31%.

In October 1987, all major world markets crashed or declined substantially. The FTSE 100 Index lost 10.8% on that Monday and a further 12.2% the following day. The least affected was Austria (a fall of 11.4%) while the most affected was Hong Kong with a drop of 45.8%. Out of 23 major industrial countries, 19 had a decline greater than 20%.

Despite fears of a repeat of the Great Depression, the market rallied immediately after the crash, posting a record one-day gain of 102.27 the very next day and 186.64 points on Thursday, October 22. It took only two years for the Dow to recover completely; by September 1989, the market had regained all of the value it had lost in the 1987 crash. The DJIA gained 0.6% during calendar year 1987.

No definitive conclusions have been reached on the reasons behind the 1987 Crash. Stocks had been in a multi-year bull run and market price–earnings ratios in the U.S. were above the post-war average. The S&P 500 was trading at 23 times earnings, a postwar high and well above the average of 14.5 times earnings. Herd behavior and psychological feedback loops play a critical part in all stock market crashes but analysts have also tried to look for external triggering events. Aside from the general worries of stock market overvaluation, blame for the collapse has been apportioned to such factors as program trading, portfolio insurance and derivatives, and prior news of worsening economic indicators (i.e. a large U.S. merchandise trade deficit and a falling U.S. dollar, which seemed to imply future interest rate hikes).

One of the consequences of the 1987 Crash was the introduction of the circuit breaker or trading curb on the NYSE. Based upon the idea that a cooling-off period would help dissipate panic selling, these mandatory market shutdowns are triggered whenever a large pre-defined market decline occurs during the trading day.

Crash of 2008–2009
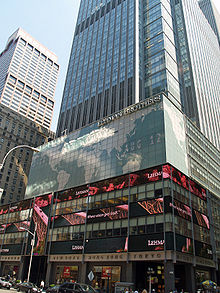
The collapse of Lehman Brothers was a symbol of the Crash of 2008.
OMX Iceland 15 closing prices during the five trading weeks from September 29, 2008, to October 31, 2008
During the 2008 global financial crisis, the BSE Sensex experienced a sharp decline. It dropped from over 21,000 points in January 2008 to below 8,000 points in October 2008.

On September 15, 2008, the bankruptcy of Lehman Brothers and the collapse of Merrill Lynch along with a liquidity crisis of American International Group, all primarily due to exposure to packaged subprime loans and credit default swaps issued to insure these loans and their issuers, rapidly devolved into a global crisis. This resulted in several bank failures in Europe and sharp reductions in the value of stocks and commodities worldwide. The failure of banks in Iceland resulted in a devaluation of the Icelandic króna and threatened the government with bankruptcy. Iceland obtained an emergency loan from the International Monetary Fund in November. In the United States, 15 banks failed in 2008, while several others were rescued through government intervention or acquisitions by other banks. On October 11, 2008, the head of the International Monetary Fund (IMF) warned that the world financial system was teetering on the "brink of systemic meltdown".

The economic crisis caused countries to close their markets temporarily.

On October 8, the Indonesian stock market halted trading, after a 10% drop in one day.

The Times of London reported that the meltdown was being called the Crash of 2008, and older traders were comparing it with Black Monday in 1987. The fall that week of 21% compared to a 28.3% fall 21 years earlier, but some traders were saying it was worse. "At least then it was a short, sharp, shock on one day. This has been relentless all week." Other media also referred to the events as the "Crash of 2008".

From October 6–10, 2008, the Dow Jones Industrial Average (DJIA) closed lower in all five sessions. Volume levels were record-breaking. The DJIA fell over 1,874 points, or 18%, in its worst weekly decline ever on both a points and percentage basis. The S&P 500 fell more than 20%. The week also set 3 top ten NYSE Group Volume Records with October 8 at #5, October 9 at #10, and October 10 at #1.

Having been suspended for three successive trading days (October 9, 10, and 13), the Icelandic stock market reopened on 14 October, with the main index, the OMX Iceland 15, closing at 678.4, which was about 77% lower than the 3,004.6 at the close on October 8. This reflected that the value of the three big banks, which had formed 73.2% of the value of the OMX Iceland 15, had been set to zero.

On October 24, 2008, many of the world's stock exchanges experienced the worst declines in their history, with drops of around 10% in most indices. In the U.S., the DJIA fell 3.6%, although not as much as other markets. The United States dollar and Japanese yen soared against other major currencies, particularly the British pound and Canadian dollar, as world investors sought safe havens. Later that day, the deputy governor of the Bank of England, Charlie Bean, suggested that "This is a once in a lifetime crisis, and possibly the largest financial crisis of its kind in human history."

By March 6, 2009, the DJIA had dropped 54% to 6,469 from its peak of 14,164 on October 9, 2007, over a span of 17 months, before beginning to recover.

COVID-19 pandemic (2020)
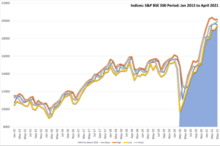
Indices: S&P BSE 500 (January 2015 to November 2020). Blue highlight reflects COVID-19 period (taken to start from March 2020 as per first lockdown).
Indices: S&P BSE 500 (Period Jan – 2015 to May – 2020). Open, High, Low, Close visible. Fall depicted in black. Rise depicted in white.

During the week of February 24–28, 2020, stock markets dropped as the COVID-19 pandemic spread globally. The FTSE 100 dropped 13%, while the DJIA and S&P 500 Index dropped 11–12% in the biggest downward weekly drop since the financial crisis of 2007–2008.

On Monday, March 9, 2020, after the launch of the 2020 Russia–Saudi Arabia oil price war, the FTSE and other major European stock market indices fell by nearly 8%. Asian markets fell sharply and the S&P 500 Index dropped 7.60%. The Italian FTSE MIB fell 2,323.98 points, or 11.17%.

On March 12, 2020, a day after US President Donald Trump announced a travel ban from Europe, stock prices again fell sharply. The DJIA declined 9.99% — the largest daily decline since Black Monday (1987) — despite the Federal Reserve announcing it would inject $1.5 trillion into money markets. The S&P 500 and the Nasdaq each dropped by approximately 9.5%. The major European stock market indexes all fell over 10%.

On March 16, 2020, after it became clear that a recession was inevitable, the DJIA dropped 12.93%, or 2,997 points, the largest point drop since Black Monday (1987), surpassing the drop in the prior week, the Nasdaq Composite dropped 12.32%, and the S&P 500 Index dropped 11.98%.

By the end of May 2020, the stock market indices briefly recovered to their levels at the end of February 2020.

In June 2020 the Nasdaq surpassed its pre-crash high followed by the S&P 500 in August and the Dow in November.

Mathematical theory

Random walk theory

The conventional assumption is that stock markets behave according to a random log-normal distribution. This implies that the expected volatility is the same all the time. Among others, mathematician Benoit Mandelbrot suggested as early as 1963 that the statistics prove this assumption incorrect. Mandelbrot observed that large movements in prices (i.e. crashes) are much more common than would be predicted from a log-normal distribution. Mandelbrot and others suggested that the nature of market moves is generally much better explained using non-linear analysis and concepts of chaos theory. This has been expressed in non-mathematical terms by George Soros in his discussions of what he calls reflexivity of markets and their non-linear movement. George Soros said in late October 1987, 'Mr. Robert Prechter's reversal proved to be the crack that started the avalanche'.

Self-organized criticality

Research at the Massachusetts Institute of Technology suggests that there is evidence that the frequency of stock market crashes follows an inverse cubic power law. This and other studies such as Didier Sornette's work suggest that stock market crashes are a sign of self-organized criticality in financial markets.

Lévy flight

In 1963, Mandelbrot proposed that instead of following a strict random walk, stock price variations executed a Lévy flight. A Lévy flight is a random walk that is occasionally disrupted by large movements. In 1995, Rosario Mantegna and Gene Stanley analyzed a million records of the S&P 500 Index, calculating the returns over a five-year period. Researchers continue to study this theory, particularly using computer simulation of crowd behavior, and the applicability of models to reproduce crash-like phenomena.

Result of investor imitation

In 2011, using statistical analysis tools of complex systems, research at the New England Complex Systems Institute found that the panics that lead to crashes come from a dramatic increase in imitation among investors, which always occurred during the year before each market crash. When investors closely follow each other's cues, it is easier for panic to take hold and affect the market. This work is a mathematical demonstration of a significant advance warning sign of impending market crashes.

Trading curbs and trading halts

One mitigation strategy has been the introduction of trading curbs, also known as "circuit breakers", which are a trading halt in the cash market and the corresponding trading halt in the derivative markets triggered by the halt in the cash market, all of which are affected based on substantial movements in a broad market indicator. Since their inception after Black Monday (1987), trading curbs have been modified to prevent both speculative gains and dramatic losses within a small time frame.

United States

There are three thresholds, which represent different levels of decline in the S&P 500 Index: 7% (Level 1), 13% (Level 2), and 20% (Level 3).

  • If Threshold Level 1 (a 7% drop) is breached before 3:25pm, trading halts for a minimum of 15 minutes. At or after 3:25 pm, trading continues unless there is a Level 3 halt.
  • If Threshold Level 2 (a 13% drop) is breached before 1 pm, the market closes for two hours. If such a decline occurs between 1 pm and 2 pm, there is a one-hour pause. The market would close for the day if stocks sank to that level after 2 pm
  • If Threshold Level 3 (a 20% drop) is breached, the market would close for the day, regardless of the time.

France

For the CAC 40 stock market index in France, daily price limits are implemented in cash and derivative markets. Securities traded on the markets are divided into three categories according to the number and volume of daily transactions. Price limits for each security vary by category. For instance, for the most liquid category, when the price movement of a security from the previous day's closing price exceeds 10%, trading is suspended for 15 minutes. If the price then goes up or down by more than 5%, transactions are again suspended for 15 minutes. The 5% threshold may apply once more before transactions are halted for the rest of the day. When such a suspension occurs, transactions on options based on the underlying security are also suspended. Further, when stocks representing more than 35% of the capitalization of the CAC40 Index are halted, the calculation of the CAC40 Index is suspended and the index is replaced by a trend indicator. When stocks representing less than 25% of the capitalization of the CAC40 Index are halted, trading on the derivative markets are suspended for half an hour or one hour, and additional margin deposits are requested.

Standard score

From Wikipedia, the free encyclopedia
https://en.wikipedia.org/wiki/Standard_score
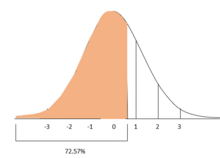
Comparison of the various grading methods in a normal distribution, including: standard deviations, cumulative percentages, percentile equivalents, z-scores, T-scores

In statistics, the standard score is the number of standard deviations by which the value of a raw score (i.e., an observed value or data point) is above or below the mean value of what is being observed or measured. Raw scores above the mean have positive standard scores, while those below the mean have negative standard scores.

It is calculated by subtracting the population mean from an individual raw score and then dividing the difference by the population standard deviation. This process of converting a raw score into a standard score is called standardizing or normalizing (however, "normalizing" can refer to many types of ratios; see Normalization for more).

Standard scores are most commonly called z-scores; the two terms may be used interchangeably, as they are in this article. Other equivalent terms in use include z-value, z-statistic, normal score, standardized variable and pull in high energy physics.

Computing a z-score requires knowledge of the mean and standard deviation of the complete population to which a data point belongs; if one only has a sample of observations from the population, then the analogous computation using the sample mean and sample standard deviation yields the t-statistic.

Calculation

If the population mean and population standard deviation are known, a raw score x is converted into a standard score by

where:

μ is the mean of the population,
σ is the standard deviation of the population.

The absolute value of z represents the distance between that raw score x and the population mean in units of the standard deviation. z is negative when the raw score is below the mean, positive when above.

Calculating z using this formula requires use of the population mean and the population standard deviation, not the sample mean or sample deviation. However, knowing the true mean and standard deviation of a population is often an unrealistic expectation, except in cases such as standardized testing, where the entire population is measured.

When the population mean and the population standard deviation are unknown, the standard score may be estimated by using the sample mean and sample standard deviation as estimates of the population values.

In these cases, the z-score is given by

where:

is the mean of the sample,
S is the standard deviation of the sample.

Though it should always be stated, the distinction between use of the population and sample statistics often is not made. In either case, the numerator and denominator of the equations have the same units of measure so that the units cancel out through division and z is left as a dimensionless quantity.

Applications

Z-test

The z-score is often used in the z-test in standardized testing – the analog of the Student's t-test for a population whose parameters are known, rather than estimated. As it is very unusual to know the entire population, the t-test is much more widely used.

Prediction intervals

The standard score can be used in the calculation of prediction intervals. A prediction interval [L,U], consisting of a lower endpoint designated L and an upper endpoint designated U, is an interval such that a future observation X will lie in the interval with high probability , i.e.

For the standard score Z of X it gives:

By determining the quantile z such that

it follows:

Process control

In process control applications, the Z value provides an assessment of the degree to which a process is operating off-target.

Comparison of scores measured on different scales: ACT and SAT

The z score for Student A was 1, meaning Student A was 1 standard deviation above the mean. Thus, Student A performed in the 84.13 percentile on the SAT.

When scores are measured on different scales, they may be converted to z-scores to aid comparison. Dietz et al. give the following example, comparing student scores on the (old) SAT and ACT high school tests. The table shows the mean and standard deviation for total scores on the SAT and ACT. Suppose that student A scored 1800 on the SAT, and student B scored 24 on the ACT. Which student performed better relative to other test-takers?


SAT ACT
Mean 1500 21
Standard deviation 300 5
The z score for Student B was 0.6, meaning Student B was 0.6 standard deviation above the mean. Thus, Student B performed in the 72.57 percentile on the SAT.

The z-score for student A is

The z-score for student B is

Because student A has a higher z-score than student B, student A performed better compared to other test-takers than did student B.

Percentage of observations below a z-score

Continuing the example of ACT and SAT scores, if it can be further assumed that both ACT and SAT scores are normally distributed (which is approximately correct), then the z-scores may be used to calculate the percentage of test-takers who received lower scores than students A and B.

Cluster analysis and multidimensional scaling

"For some multivariate techniques such as multidimensional scaling and cluster analysis, the concept of distance between the units in the data is often of considerable interest and importance… When the variables in a multivariate data set are on different scales, it makes more sense to calculate the distances after some form of standardization."

Principal components analysis

In principal components analysis, "Variables measured on different scales or on a common scale with widely differing ranges are often standardized."

Relative importance of variables in multiple regression: standardized regression coefficients

Standardization of variables prior to multiple regression analysis is sometimes used as an aid to interpretation. (page 95) state the following.

"The standardized regression slope is the slope in the regression equation if X and Y are standardized … Standardization of X and Y is done by subtracting the respective means from each set of observations and dividing by the respective standard deviations … In multiple regression, where several X variables are used, the standardized regression coefficients quantify the relative contribution of each X variable."

However, Kutner et al. (p 278) give the following caveat: "… one must be cautious about interpreting any regression coefficients, whether standardized or not. The reason is that when the predictor variables are correlated among themselves, … the regression coefficients are affected by the other predictor variables in the model … The magnitudes of the standardized regression coefficients are affected not only by the presence of correlations among the predictor variables but also by the spacings of the observations on each of these variables. Sometimes these spacings may be quite arbitrary. Hence, it is ordinarily not wise to interpret the magnitudes of standardized regression coefficients as reflecting the comparative importance of the predictor variables."

Standardizing in mathematical statistics

In mathematical statistics, a random variable X is standardized by subtracting its expected value and dividing the difference by its standard deviation

If the random variable under consideration is the sample mean of a random sample of X:

then the standardized version is


Where the standardised sample mean's variance was calculated as follows:


T-score

In educational assessment, T-score is a standard score Z shifted and scaled to have a mean of 50 and a standard deviation of 10. It is also known as hensachi in Japanese, where the concept is much more widely known and used in the context of high school and university admissions.

In bone density measurements, the T-score is the standard score of the measurement compared to the population of healthy 30-year-old adults, and has the usual mean of 0 and standard deviation of 1.

Panic buying

From Wikipedia, the free encyclopedia
https://en.wikipedia.org/wiki/Panic_buying

Panic buying (alternatively hyphenated as panic-buying; also known as panic purchasing) occurs when consumers buy unusually large amounts of a product in anticipation of, or after, a disaster or perceived disaster, or in anticipation of a large price increase, or shortage.

Panic buying during various health crises is influenced by "(1) individuals' perception of the threat of a health crisis and scarcity of products; (2) fear of the unknown, which is caused by emotional pressure and uncertainty; (3) coping behaviour, which views panic buying as a venue to relieve anxiety and regain control over the crisis; and (4) social psychological factors, which account for the influence of the social network of an individual".

Panic buying is a type of herd behavior. It is of interest in consumer behavior theory, the broad field of economic study dealing with explanations for "collective action such as fads and fashions, stock market movements, runs on nondurable goods, buying sprees, hoarding, and banking panics".

Fishing-rod panic buying in Corpus Christi, Texas, during the COVID-19 pandemic

Panic buying can lead to genuine shortages regardless of whether the risk of a shortage is real or perceived; the latter scenario is an example of self-fulfilling prophecy.

Examples

Panic buying occurred before, during, or following:

COVID-19 pandemic

Panic buying became a major international phenomenon between February and March 2020 during the early onset of the COVID-19 pandemic, and continued in smaller, more localized waves throughout during sporadic lockdowns across the world. Stores around the world were depleted of items such as face masks, food, bottled water, milk, toilet paper, hand sanitizer, rubbing alcohol, antibacterial wipes and painkillers. As a result, many retailers rationed the sale of these items.

Online retailers such as eBay and Amazon began to pull certain items listed for sale by third parties such as toilet paper, face masks, pasta, canned vegetables, hand sanitizer and antibacterial wipes over price gouging concerns. As a result, Amazon restricted the sale of these items and others (such as thermometers and ventilators) to healthcare professionals and government agencies. Additionally, panic renting of self-storage units took place during the onset of the pandemic.

The massive buyouts of toilet paper caused bewilderment and confusion from the public. Images of empty shelves of toilet paper were shared on social media in many countries around the world, e.g. Australia, United States, the United Kingdom, Canada, Singapore, Hong Kong and Japan. In Australia, two women were charged over a physical altercation over toilet paper at a supermarket. The severity of the panic buying drew criticism; particularly from Prime Minister of Australia Scott Morrison, calling for Australians to "stop it".

Research on this specific social phenomenon of toilet paper hoarding suggested that social media had played a crucial role in stimulating mass-anxiety and panic. Social media research found that many people posting about toilet paper panic buying were negative, either expressing anger or frustration over the frantic situation. This high amount of negative viral posts could act as an emotional trigger of anxiety and panic, spontaneously spreading fear and fueling psychological reactions in midst of the crisis. It may have triggered a snowball effect in the public, encouraged by the images and videos of empty shelves and people fighting over toilet rolls.

Bank run

From Wikipedia, the free encyclopedia
https://en.wikipedia.org/wiki/Bank_run
American Union Bank, New York City, April 26, 1932

A bank run or run on the bank occurs when many clients withdraw their money from a bank, because they believe the bank may fail in the near future. In other words, it is when, in a fractional-reserve banking system (where banks normally only keep a small proportion of their assets as cash), numerous customers withdraw cash from deposit accounts with a financial institution at the same time because they believe that the financial institution is, or might become, insolvent. When they transfer funds to another institution, it may be characterized as a capital flight. As a bank run progresses, it may become a self-fulfilling prophecy: as more people withdraw cash, the likelihood of default increases, triggering further withdrawals. This can destabilize the bank to the point where it runs out of cash and thus faces sudden bankruptcy. To combat a bank run, a bank may acquire more cash from other banks or from the central bank, or limit the amount of cash customers may withdraw, either by imposing a hard limit or by scheduling quick deliveries of cash, encouraging high-return term deposits to reduce on-demand withdrawals or suspending withdrawals altogether.

A banking panic or bank panic is a financial crisis that occurs when many banks suffer runs at the same time, as people suddenly try to convert their threatened deposits into cash or try to get out of their domestic banking system altogether. A systemic banking crisis is one where all or almost all of the banking capital in a country is wiped out. The resulting chain of bankruptcies can cause a long economic recession as domestic businesses and consumers are starved of capital as the domestic banking system shuts down. According to former U.S. Federal Reserve chairman Ben Bernanke, the Great Depression was caused by the failure of the Federal Reserve System to prevent deflation, and much of the economic damage was caused directly by bank runs. The cost of cleaning up a systemic banking crisis can be huge, with fiscal costs averaging 13% of GDP and economic output losses averaging 20% of GDP for important crises from 1970 to 2007.

Several techniques have been used to try to prevent bank runs or mitigate their effects. They have included a higher reserve requirement (requiring banks to keep more of their reserves as cash), government bailouts of banks, supervision and regulation of commercial banks, the organization of central banks that act as a lender of last resort, the protection of deposit insurance systems such as the U.S. Federal Deposit Insurance Corporation, and after a run has started, a temporary suspension of withdrawals. These techniques do not always work: for example, even with deposit insurance, depositors may still be motivated by beliefs they may lack immediate access to deposits during a bank reorganization.

History

10 livres tournois banknote issued by Banque Royale, France, 1720. In 1720, shareholders demanded cash payment, leading to a run on the bank and financial chaos in France. On display at the British Museum.
The run on the Montreal City and District Savings Bank, with the mayor addressing the crowd. Printed in 1872 in the Canadian Illustrated News.

Bank runs first appeared as a part of cycles of credit expansion and its subsequent contraction. From the 16th century onwards, English goldsmiths issuing promissory notes suffered severe failures due to bad harvests, plummeting parts of the country into famine and unrest. Other examples are the Dutch tulip manias (1634–37), the British South Sea Bubble (1717–19), the French Mississippi Company (1717–20), the post-Napoleonic depression (1815–30), and the Great Depression (1929–39).

Bank runs have also been used to blackmail individuals and governments. In 1832, for example, the British government under the Duke of Wellington overturned a majority government on the orders of the king, William IV, to prevent reform (the later Reform Act 1832 (2 & 3 Will. 4. c. 45)). Wellington's actions angered reformers, and they threatened a run on the banks under the rallying cry "Stop the Duke, go for gold!".

Many of the recessions in the United States were caused by banking panics. The Great Depression contained several banking crises consisting of runs on multiple banks from 1929 to 1933; some of these were specific to regions of the U.S. Bank runs were most common in states whose laws allowed banks to operate only a single branch, dramatically increasing risk compared to banks with multiple branches particularly when single-branch banks were located in areas economically dependent on a single industry.

Banking panics began in the Southern United States in November 1930, one year after the stock market crash, triggered by the collapse of a string of banks in Tennessee and Kentucky, which brought down their correspondent networks. In December, New York City experienced massive bank runs that were contained to the many branches of a single bank. Philadelphia was hit a week later by bank runs that affected several banks, but were successfully contained by quick action by the leading city banks and the Federal Reserve Bank. Withdrawals became worse after financial conglomerates in New York and Los Angeles failed in prominently-covered scandals. Much of the US Depression's economic damage was caused directly by bank runs, though Canada had no bank runs during this same era due to different banking regulations.

Money supply decreased substantially between Black Tuesday and the Bank Holiday in March 1933 when there were massive bank runs across the United States.

Milton Friedman and Anna Schwartz argued that steady withdrawals from banks by nervous depositors ("hoarding") were inspired by news of the fall 1930 bank runs and forced banks to liquidate loans, which directly caused a decrease in the money supply, shrinking the economy. Bank runs continued to plague the United States for the next several years. Citywide runs hit Boston (December 1931), Chicago (June 1931 and June 1932), Toledo (June 1931), and St. Louis (January 1933), among others. Institutions put into place during the Depression have prevented runs on U.S. commercial banks since the 1930s, even under conditions such as the U.S. savings and loan crisis of the 1980s and 1990s.

The global financial crisis that began in 2007 was centered around market-liquidity failures that were comparable to a bank run. The crisis contained a wave of bank nationalizations, including those associated with Northern Rock of the UK and IndyMac of the U.S. This crisis was caused by low real interest rates stimulating an asset price bubble fuelled by new financial products that were not stress tested and that failed in the downturn.

Theory

A poster for the 1896 Broadway melodrama The War of Wealth depicts a 19th-century bank run in the U.S.

Under fractional-reserve banking, the type of banking currently used in most developed countries, banks retain only a fraction of their demand deposits as cash. The remainder is invested in securities and loans, whose terms are typically longer than the demand deposits, resulting in an asset–liability mismatch. No bank has enough reserves on hand to cope with all deposits being taken out at once.

Diamond and Dybvig developed an influential model to explain why bank runs occur and why banks issue deposits that are more liquid than their assets. According to the model, the bank acts as an intermediary between borrowers who prefer long-maturity loans and depositors who prefer liquid accounts. The Diamond–Dybvig model provides an example of an economic game with more than one Nash equilibrium, where it is logical for individual depositors to engage in a bank run once they suspect one might start, even though that run will cause the bank to collapse.

In the model, business investment requires expenditures in the present to obtain returns that take time in coming, for example, spending on machines and buildings now for production in future years. A business or entrepreneur that needs to borrow to finance investment will want to give their investments a long time to generate returns before full repayment, and will prefer long maturity loans, which offer little liquidity to the lender. The same principle applies to individuals and households seeking financing to purchase large-ticket items such as housing or automobiles. The households and firms who have the money to lend to these businesses may have sudden, unpredictable needs for cash, so they are often willing to lend only on the condition of being guaranteed immediate access to their money in the form of liquid demand deposit accounts, that is, accounts with shortest possible maturity. Since borrowers need money and depositors fear to make these loans individually, banks provide a valuable service by aggregating funds from many individual deposits, portioning them into loans for borrowers, and spreading the risks both of default and sudden demands for cash. Banks can charge much higher interest on their long-term loans than they pay out on demand deposits, allowing them to earn a profit.

Depositors clamor to withdraw their savings from a bank in Berlin, 13 July 1931

If only a few depositors withdraw at any given time, this arrangement works well. Barring some major emergency on a scale matching or exceeding the bank's geographical area of operation, depositors' unpredictable needs for cash are unlikely to occur at the same time; that is, by the law of large numbers, banks can expect only a small percentage of accounts withdrawn on any one day because individual expenditure needs are largely uncorrelated. A bank can make loans over a long horizon, while keeping only relatively small amounts of cash on hand to pay any depositors who may demand withdrawals.

However, if many depositors withdraw all at once, the bank itself (as opposed to individual investors) may run short of liquidity, and depositors will rush to withdraw their money, forcing the bank to liquidate many of its assets at a loss, and eventually to fail. If such a bank were to attempt to call in its loans early, businesses might be forced to disrupt their production while individuals might need to sell their homes and/or vehicles, causing further losses to the larger economy. Even so, many, if not most, debtors would be unable to pay the bank in full on demand and would be forced to declare bankruptcy, possibly affecting other creditors in the process.

A bank run can occur even when started by a false story. Even depositors who know the story is false will have an incentive to withdraw, if they suspect other depositors will believe the story. The story becomes a self-fulfilling prophecy. Indeed, Robert K. Merton, who coined the term self-fulfilling prophecy, mentioned bank runs as a prime example of the concept in his book Social Theory and Social Structure. Mervyn King, governor of the Bank of England, once noted that it may not be rational to start a bank run, but it is rational to participate in one once it had started.

Systemic banking crisis

Bank run during the Great Depression in the United States, February 1933

A bank run is the sudden withdrawal of deposits of just one bank. A banking panic or bank panic is a financial crisis that occurs when many banks suffer runs at the same time, as a cascading failure. In a systemic banking crisis, all or almost all of the banking capital in a country is wiped out; this can result when regulators ignore systemic risks and spillover effects.

Systemic banking crises are associated with substantial fiscal costs and large output losses. Frequently, emergency liquidity support and blanket guarantees have been used to contain these crises, not always successfully. Although fiscal tightening may help contain market pressures if a crisis is triggered by unsustainable fiscal policies, expansionary fiscal policies are typically used. In crises of liquidity and solvency, central banks can provide liquidity to support illiquid banks. Depositor protection can help restore confidence, although it tends to be costly and does not necessarily speed up economic recovery. Intervention is often delayed in the hope that recovery will occur, and this delay increases the stress on the economy.

Some measures are more effective than others in containing economic fallout and restoring the banking system after a systemic crisis. These include establishing the scale of the problem, targeted debt relief programs to distressed borrowers, corporate restructuring programs, recognizing bank losses, and adequately capitalizing banks. Speed of intervention appears to be crucial; intervention is often delayed in the hope that insolvent banks will recover if given liquidity support and relaxation of regulations, and in the end this delay increases stress on the economy. Programs that are targeted, that specify clear quantifiable rules that limit access to preferred assistance, and that contain meaningful standards for capital regulation, appear to be more successful. According to IMF, government-owned asset management companies (bad banks) are largely ineffective due to political constraints.

A silent run occurs when the implicit fiscal deficit from a government's unbooked loss exposure to zombie banks is large enough to deter depositors of those banks. As more depositors and investors begin to doubt whether a government can support a country's banking system, the silent run on the system can gather steam, causing the zombie banks' funding costs to increase. If a zombie bank sells some assets at market value, its remaining assets contain a larger fraction of unbooked losses; if it rolls over its liabilities at increased interest rates, it squeezes its profits along with the profits of healthier competitors. The longer the silent run goes on, the more benefits are transferred from healthy banks and taxpayers to the zombie banks. The term is also used when many depositors in countries with deposit insurance draw down their balances below the limit for deposit insurance.

The cost of cleaning up after a crisis can be huge. In systemically important banking crises in the world from 1970 to 2007, the average net recapitalization cost to the government was 6% of GDP, fiscal costs associated with crisis management averaged 13% of GDP (16% of GDP if expense recoveries are ignored), and economic output losses averaged about 20% of GDP during the first four years of the crisis.

Prevention and mitigation

2007 run on Northern Rock, a UK bank, during the late-2000s financial crisis
A run on a Bank of East Asia branch in Hong Kong, caused by "malicious rumours" in 2008

Several techniques have been used to help prevent or mitigate bank runs.

Individual banks

Some prevention techniques apply to individual banks, independently of the rest of the economy.

  • Banks often project an appearance of stability, with solid architecture and conservative dress.
  • A bank may try to hide information that might spark a run. For example, in the days before deposit insurance, it made sense for a bank to have a large lobby and fast service, to prevent the formation of a line of depositors extending out into the street which might cause passers-by to infer a bank run.
  • A bank may try to slow down the bank run by artificially slowing the process. One technique is to get a large number of friends and relatives of bank employees to stand in line and make many small, slow transactions.
  • Scheduling prominent deliveries of cash can convince participants in a bank run that there is no need to withdraw deposits hastily.
  • Banks can encourage customers to make term deposits that cannot be withdrawn on demand. If term deposits form a high enough percentage of a bank's liabilities, its vulnerability to bank runs will be reduced considerably. The drawback is that banks have to pay a higher interest rate on term deposits.
  • A bank can temporarily suspend withdrawals to stop a run; this is called suspension of convertibility. In many cases, the threat of suspension prevents the run, which means the threat need not be carried out.
  • Emergency acquisition of a vulnerable bank by another institution with stronger capital reserves. This technique is commonly used by the U.S. Federal Deposit Insurance Corporation to dispose of insolvent banks, rather than paying depositors directly from its own funds.
  • If there is no immediate prospective buyer for a failing institution, a regulator or deposit insurer may set up a bridge bank which operates temporarily until the business can be liquidated or sold.
  • To clean up after a bank failure, the government may set up a "bad bank", which is a new government-run asset management corporation that buys individual nonperforming assets from one or more private banks, reducing the proportion of junk bonds in their asset pools, and then acts as the creditor in the insolvency cases that follow. This, however, creates a moral hazard problem, essentially subsidizing bankruptcy: temporarily underperforming debtors can be forced to file for bankruptcy in order to make them eligible to be sold to the bad bank.

Systemic techniques

Some prevention techniques apply across the whole economy, though they may still allow individual institutions to fail.

  • Deposit insurance systems insure each depositor up to a certain amount, so that depositors' savings are protected even if the bank fails. This removes the incentive to withdraw one's deposits simply because others are withdrawing theirs. However, depositors may still be motivated by fears they may lack immediate access to deposits during a bank reorganization. To avoid such fears triggering a run, the U.S. FDIC keeps its takeover operations secret, and re-opens branches under new ownership on the next business day. Government deposit insurance programs can be ineffective if the government itself is perceived to be running short of cash.
  • Bank capital requirements reduces the possibility that a bank becomes insolvent. The Basel III agreement strengthens bank capital requirements and introduces new regulatory requirements on bank liquidity and bank leverage.
    • Full-reserve banking is the hypothetical case where the reserve ratio is set to 100%, and funds deposited are not lent out by the bank as long as the depositor retains the legal right to withdraw the funds on demand. Under this approach, banks would be forced to match maturities of loans and deposits, thus greatly reducing the risk of bank runs.
    • A less severe alternative to full-reserve banking is a reserve ratio requirement, which limits the proportion of deposits which a bank can lend out, making it less likely for a bank run to start, as more reserves will be available to satisfy the demands of depositors. This practice sets a limit on the fraction in fractional-reserve banking.
  • Transparency may help prevent crises from spreading through the banking system. In the context of the 2007-2010 subprime mortgage crisis, the extreme complexity of certain types of assets made it difficult for market participants to assess which financial institutions would survive, which amplified the crisis by making most institutions very reluctant to lend to one another.
  • Central banks act as a lender of last resort. To prevent a bank run, the central bank guarantees that it will make short-term loans to banks, to ensure that, if they remain economically viable, they will always have enough liquidity to honor their deposits. Walter Bagehot's book Lombard Street provides an influential early analysis of the role of the lender of last resort.

The role of the lender of last resort, and the existence of deposit insurance, both create moral hazard, since they reduce banks' incentive to avoid making risky loans. They are nonetheless standard practice, as the benefits of collective prevention are commonly believed to outweigh the costs of excessive risk-taking.

Techniques to deal with a banking panic when prevention have failed:

  • Declaring an emergency bank holiday
  • Government or central bank announcements of increased lines of credit, loans, or bailouts for vulnerable banks

Depictions in fiction

The bank panic of 1933 is the setting of Archibald MacLeish's 1935 play, Panic. Other fictional depictions of bank runs include those in American Madness (1932), It's a Wonderful Life (1946, set in 1932 U.S.), Silver River (1948), Mary Poppins (1964, set in 1910 London), Rollover (1981), Noble House (1988) and The Pope Must Die (1991).

Arthur Hailey's novel The Moneychangers includes a potentially fatal run on a fictitious US bank.

A run on a bank is one of the many causes of the characters' suffering in Upton Sinclair's The Jungle.

In The Simpsons season 6 episode 21 The PTA Disbands as a prank Bart Simpson causes a bank run at the First Bank of Springfield.

Lie group

From Wikipedia, the free encyclopedia https://en.wikipedia.org/wiki/Lie_group In mathematics , a Lie gro...