Search This Blog

Thursday, August 29, 2024

Molecular clock

From Wikipedia, the free encyclopedia

Early discovery and genetic equidistance

The notion of the existence of a so-called "molecular clock" was first attributed to Émile Zuckerkandl and Linus Pauling who, in 1962, noticed that the number of amino acid differences in hemoglobin between different lineages changes roughly linearly with time, as estimated from fossil evidence. They generalized this observation to assert that the rate of evolutionary change of any specified protein was approximately constant over time and over different lineages (known as the molecular clock hypothesis).

The genetic equidistance phenomenon was first noted in 1963 by Emanuel Margoliash, who wrote: "It appears that the number of residue differences between cytochrome c of any two species is mostly conditioned by the time elapsed since the lines of evolution leading to these two species originally diverged. If this is correct, the cytochrome c of all mammals should be equally different from the cytochrome c of all birds. Since fish diverges from the main stem of vertebrate evolution earlier than either birds or mammals, the cytochrome c of both mammals and birds should be equally different from the cytochrome c of fish. Similarly, all vertebrate cytochrome c should be equally different from the yeast protein." For example, the difference between the cytochrome c of a carp and a frog, turtle, chicken, rabbit, and horse is a very constant 13% to 14%. Similarly, the difference between the cytochrome c of a bacterium and yeast, wheat, moth, tuna, pigeon, and horse ranges from 64% to 69%. Together with the work of Emile Zuckerkandl and Linus Pauling, the genetic equidistance result led directly to the formal postulation of the molecular clock hypothesis in the early 1960s.

Similarly, Vincent Sarich and Allan Wilson in 1967 demonstrated that molecular differences among modern Primates in albumin proteins showed that approximately constant rates of change had occurred in all the lineages they assessed. The basic logic of their analysis involved recognizing that if one species lineage had evolved more quickly than a sister species lineage since their common ancestor, then the molecular differences between an outgroup (more distantly related) species and the faster-evolving species should be larger (since more molecular changes would have accumulated on that lineage) than the molecular differences between the outgroup species and the slower-evolving species. This method is known as the relative rate test. Sarich and Wilson's paper reported, for example, that human (Homo sapiens) and chimpanzee (Pan troglodytes) albumin immunological cross-reactions suggested they were about equally different from Ceboidea (New World Monkey) species (within experimental error). This meant that they had both accumulated approximately equal changes in albumin since their shared common ancestor. This pattern was also found for all the primate comparisons they tested. When calibrated with the few well-documented fossil branch points (such as no Primate fossils of modern aspect found before the K-T boundary), this led Sarich and Wilson to argue that the human-chimp divergence probably occurred only ~4–6 million years ago.

Relationship with neutral theory

The observation of a clock-like rate of molecular change was originally purely phenomenological. Later, the work of Motoo Kimura developed the neutral theory of molecular evolution, which predicted a molecular clock. Let there be N individuals, and to keep this calculation simple, let the individuals be haploid (i.e. have one copy of each gene). Let the rate of neutral mutations (i.e. mutations with no effect on fitness) in a new individual be . The probability that this new mutation will become fixed in the population is then 1/N, since each copy of the gene is as good as any other. Every generation, each individual can have new mutations, so there are N new neutral mutations in the population as a whole. That means that each generation, new neutral mutations will become fixed. If most changes seen during molecular evolution are neutral, then fixations in a population will accumulate at a clock-rate that is equal to the rate of neutral mutations in an individual.

Calibration

To use molecular clocks to estimate divergence times, molecular clocks need to be "calibrated". This is because molecular data alone does not contain any information on absolute times. For viral phylogenetics and ancient DNA studies—two areas of evolutionary biology where it is possible to sample sequences over an evolutionary timescale—the dates of the intermediate samples can be used to calibrate the molecular clock. However, most phylogenies require that the molecular clock be calibrated using independent evidence about dates, such as the fossil record. There are two general methods for calibrating the molecular clock using fossils: node calibration and tip calibration.

Node calibration

Sometimes referred to as node dating, node calibration is a method for time-scaling phylogenetic trees by specifying time constraints for one or more nodes in the tree. Early methods of clock calibration only used a single fossil constraint (e.g. non-parametric rate smoothing), but newer methods (BEAST and r8s) allow for the use of multiple fossils to calibrate molecular clocks. The oldest fossil of a clade is used to constrain the minimum possible age for the node representing the most recent common ancestor of the clade. However, due to incomplete fossil preservation and other factors, clades are typically older than their oldest fossils. In order to account for this, nodes are allowed to be older than the minimum constraint in node calibration analyses. However, determining how much older the node is allowed to be is challenging. There are a number of strategies for deriving the maximum bound for the age of a clade including those based on birth-death models, fossil stratigraphic distribution analyses, or taphonomic controls. Alternatively, instead of a maximum and a minimum, a probability density can be used to represent the uncertainty about the age of the clade. These calibration densities can take the shape of standard probability densities (e.g. normal, lognormal, exponential, gamma) that can be used to express the uncertainty associated with divergence time estimates.  Determining the shape and parameters of the probability distribution is not trivial, but there are methods that use not only the oldest fossil but a larger sample of the fossil record of clades to estimate calibration densities empirically. Studies have shown that increasing the number of fossil constraints increases the accuracy of divergence time estimation.

Tip calibration

Sometimes referred to as tip dating, tip calibration is a method of molecular clock calibration in which fossils are treated as taxa and placed on the tips of the tree. This is achieved by creating a matrix that includes a molecular dataset for the extant taxa along with a morphological dataset for both the extinct and the extant taxa. Unlike node calibration, this method reconstructs the tree topology and places the fossils simultaneously. Molecular and morphological models work together simultaneously, allowing morphology to inform the placement of fossils. Tip calibration makes use of all relevant fossil taxa during clock calibration, rather than relying on only the oldest fossil of each clade. This method does not rely on the interpretation of negative evidence to infer maximum clade ages.

Expansion calibration

Demographic changes in populations can be detected as fluctuations in historical coalescent effective population size from a sample of extant genetic variation in the population using coalescent theory. Ancient population expansions that are well documented and dated in the geological record can be used to calibrate a rate of molecular evolution in a manner similar to node calibration. However, instead of calibrating from the known age of a node, expansion calibration uses a two-epoch model of constant population size followed by population growth, with the time of transition between epochs being the parameter of interest for calibration. Expansion calibration works at shorter, intraspecific timescales in comparison to node calibration, because expansions can only be detected after the most recent common ancestor of the species in question. Expansion dating has been used to show that molecular clock rates can be inflated at short timescales (< 1 MY) due to incomplete fixation of alleles, as discussed below.

Total evidence dating

This approach to tip calibration goes a step further by simultaneously estimating fossil placement, topology, and the evolutionary timescale. In this method, the age of a fossil can inform its phylogenetic position in addition to morphology. By allowing all aspects of tree reconstruction to occur simultaneously, the risk of biased results is decreased. This approach has been improved upon by pairing it with different models. One current method of molecular clock calibration is total evidence dating paired with the fossilized birth-death (FBD) model and a model of morphological evolution. The FBD model is novel in that it allows for "sampled ancestors", which are fossil taxa that are the direct ancestor of a living taxon or lineage. This allows fossils to be placed on a branch above an extant organism, rather than being confined to the tips.

Methods

Bayesian methods can provide more appropriate estimates of divergence times, especially if large datasets—such as those yielded by phylogenomics—are employed.

Non-constant rate of molecular clock

Sometimes only a single divergence date can be estimated from fossils, with all other dates inferred from that. Other sets of species have abundant fossils available, allowing the hypothesis of constant divergence rates to be tested. DNA sequences experiencing low levels of negative selection showed divergence rates of 0.7–0.8% per Myr in bacteria, mammals, invertebrates, and plants. In the same study, genomic regions experiencing very high negative or purifying selection (encoding rRNA) were considerably slower (1% per 50 Myr).

In addition to such variation in rate with genomic position, since the early 1990s variation among taxa has proven fertile ground for research too, even over comparatively short periods of evolutionary time (for example mockingbirds). Tube-nosed seabirds have molecular clocks that on average run at half speed of many other birds, possibly due to long generation times, and many turtles have a molecular clock running at one-eighth the speed it does in small mammals, or even slower. Effects of small population size are also likely to confound molecular clock analyses. Researchers such as Francisco J. Ayala have more fundamentally challenged the molecular clock hypothesis. According to Ayala's 1999 study, five factors combine to limit the application of molecular clock models:

  • Changing generation times (If the rate of new mutations depends at least partly on the number of generations rather than the number of years)
  • Population size (Genetic drift is stronger in small populations, and so more mutations are effectively neutral)
  • Species-specific differences (due to differing metabolism, ecology, evolutionary history, ...)
  • Change in function of the protein studied (can be avoided in closely related species by utilizing non-coding DNA sequences or emphasizing silent mutations)
  • Changes in the intensity of natural selection.
Phylogram showing three groups, one of which has strikingly longer branches than the two others
Woody bamboos (tribes Arundinarieae and Bambuseae) have long generation times and lower mutation rates, as expressed by short branches in the phylogenetic tree, than the fast-evolving herbaceous bamboos (Olyreae).

Molecular clock users have developed workaround solutions using a number of statistical approaches including maximum likelihood techniques and later Bayesian modeling. In particular, models that take into account rate variation across lineages have been proposed in order to obtain better estimates of divergence times. These models are called relaxed molecular clocks because they represent an intermediate position between the 'strict' molecular clock hypothesis and Joseph Felsenstein's many-rates model and are made possible through MCMC techniques that explore a weighted range of tree topologies and simultaneously estimate parameters of the chosen substitution model. It must be remembered that divergence dates inferred using a molecular clock are based on statistical inference and not on direct evidence.

The molecular clock runs into particular challenges at very short and very long timescales. At long timescales, the problem is saturation. When enough time has passed, many sites have undergone more than one change, but it is impossible to detect more than one. This means that the observed number of changes is no longer linear with time, but instead flattens out. Even at intermediate genetic distances, with phylogenetic data still sufficient to estimate topology, signal for the overall scale of the tree can be weak under complex likelihood models, leading to highly uncertain molecular clock estimates.

At very short time scales, many differences between samples do not represent fixation of different sequences in the different populations. Instead, they represent alternative alleles that were both present as part of a polymorphism in the common ancestor. The inclusion of differences that have not yet become fixed leads to a potentially dramatic inflation of the apparent rate of the molecular clock at very short timescales.

Uses

The molecular clock technique is an important tool in molecular systematics, macroevolution, and phylogenetic comparative methods. Estimation of the dates of phylogenetic events, including those not documented by fossils, such as the divergences between living taxa has allowed the study of macroevolutionary processes in organisms that had limited fossil records. Phylogenetic comparative methods rely heavily on calibrated phylogenies.

Molecular phylogenetics

From Wikipedia, the free encyclopedia
https://en.wikipedia.org/wiki/Molecular_phylogenetics

Molecular phylogenetics (/məˈlɛkjʊlər ˌfləˈnɛtɪks, mɒ-, m-/) is the branch of phylogeny that analyzes genetic, hereditary molecular differences, predominantly in DNA sequences, to gain information on an organism's evolutionary relationships. From these analyses, it is possible to determine the processes by which diversity among species has been achieved. The result of a molecular phylogenetic analysis is expressed in a phylogenetic tree. Molecular phylogenetics is one aspect of molecular systematics, a broader term that also includes the use of molecular data in taxonomy and biogeography.

Molecular phylogenetics and molecular evolution correlate. Molecular evolution is the process of selective changes (mutations) at a molecular level (genes, proteins, etc.) throughout various branches in the tree of life (evolution). Molecular phylogenetics makes inferences of the evolutionary relationships that arise due to molecular evolution and results in the construction of a phylogenetic tree.

History

The theoretical frameworks for molecular systematics were laid in the 1960s in the works of Emile Zuckerkandl, Emanuel Margoliash, Linus Pauling, and Walter M. Fitch. Applications of molecular systematics were pioneered by Charles G. Sibley (birds), Herbert C. Dessauer (herpetology), and Morris Goodman (primates), followed by Allan C. Wilson, Robert K. Selander, and John C. Avise (who studied various groups). Work with protein electrophoresis began around 1956. Although the results were not quantitative and did not initially improve on morphological classification, they provided tantalizing hints that long-held notions of the classifications of birds, for example, needed substantial revision. In the period of 1974–1986, DNA-DNA hybridization was the dominant technique used to measure genetic difference.

Theoretical background

Early attempts at molecular systematics were also termed chemotaxonomy and made use of proteins, enzymes, carbohydrates, and other molecules that were separated and characterized using techniques such as chromatography. These have been replaced in recent times largely by DNA sequencing, which produces the exact sequences of nucleotides or bases in either DNA or RNA segments extracted using different techniques. In general, these are considered superior for evolutionary studies, since the actions of evolution are ultimately reflected in the genetic sequences. At present, it is still a long and expensive process to sequence the entire DNA of an organism (its genome). However, it is quite feasible to determine the sequence of a defined area of a particular chromosome. Typical molecular systematic analyses require the sequencing of around 1000 base pairs. At any location within such a sequence, the bases found in a given position may vary between organisms. The particular sequence found in a given organism is referred to as its haplotype. In principle, since there are four base types, with 1000 base pairs, we could have 41000 distinct haplotypes. However, for organisms within a particular species or in a group of related species, it has been found empirically that only a minority of sites show any variation at all, and most of the variations that are found are correlated, so that the number of distinct haplotypes that are found is relatively small.

In a phylogenetic tree, numerous groupings (clades) exist. A clade may be defined as a group of organisms having a common ancestor throughout evolution. This figure illustrates how a clade in a phylogenetic tree may be expressed.

In a molecular systematic analysis, the haplotypes are determined for a defined area of genetic material; a substantial sample of individuals of the target species or other taxon is used; however, many current studies are based on single individuals. Haplotypes of individuals of closely related, yet different, taxa are also determined. Finally, haplotypes from a smaller number of individuals from a definitely different taxon are determined: these are referred to as an outgroup. The base sequences for the haplotypes are then compared. In the simplest case, the difference between two haplotypes is assessed by counting the number of locations where they have different bases: this is referred to as the number of substitutions (other kinds of differences between haplotypes can also occur, for example, the insertion of a section of nucleic acid in one haplotype that is not present in another). The difference between organisms is usually re-expressed as a percentage divergence, by dividing the number of substitutions by the number of base pairs analysed: the hope is that this measure will be independent of the location and length of the section of DNA that is sequenced.

An older and superseded approach was to determine the divergences between the genotypes of individuals by DNA-DNA hybridization. The advantage claimed for using hybridization rather than gene sequencing was that it was based on the entire genotype, rather than on particular sections of DNA. Modern sequence comparison techniques overcome this objection by the use of multiple sequences.

Once the divergences between all pairs of samples have been determined, the resulting triangular matrix of differences is submitted to some form of statistical cluster analysis, and the resulting dendrogram is examined in order to see whether the samples cluster in the way that would be expected from current ideas about the taxonomy of the group. Any group of haplotypes that are all more similar to one another than any of them is to any other haplotype may be said to constitute a clade, which may be visually represented as the figure displayed on the right demonstrates. Statistical techniques such as bootstrapping and jackknifing help in providing reliability estimates for the positions of haplotypes within the evolutionary trees.

Techniques and applications

Every living organism contains deoxyribonucleic acid (DNA), ribonucleic acid (RNA), and proteins. In general, closely related organisms have a high degree of similarity in the molecular structure of these substances, while the molecules of organisms distantly related often show a pattern of dissimilarity. Conserved sequences, such as mitochondrial DNA, are expected to accumulate mutations over time, and assuming a constant rate of mutation, provide a molecular clock for dating divergence. Molecular phylogeny uses such data to build a "relationship tree" that shows the probable evolution of various organisms. With the invention of Sanger sequencing in 1977, it became possible to isolate and identify these molecular structures. High-throughput sequencing may also be used to obtain the transcriptome of an organism, allowing inference of phylogenetic relationships using transcriptomic data.

The most common approach is the comparison of homologous sequences for genes using sequence alignment techniques to identify similarity. Another application of molecular phylogeny is in DNA barcoding, wherein the species of an individual organism is identified using small sections of mitochondrial DNA or chloroplast DNA. Another application of the techniques that make this possible can be seen in the very limited field of human genetics, such as the ever-more-popular use of genetic testing to determine a child's paternity, as well as the emergence of a new branch of criminal forensics focused on evidence known as genetic fingerprinting.

Molecular phylogenetic analysis

There are several methods available for performing a molecular phylogenetic analysis. One method, including a comprehensive step-by-step protocol on constructing a phylogenetic tree, including DNA/Amino Acid contiguous sequence assembly, multiple sequence alignment, model-test (testing best-fitting substitution models), and phylogeny reconstruction using Maximum Likelihood and Bayesian Inference, is available at Nature Protocol.

Another molecular phylogenetic analysis technique has been described by Pevsner and shall be summarized in the sentences to follow (Pevsner, 2015). A phylogenetic analysis typically consists of five major steps. The first stage comprises sequence acquisition. The following step consists of performing a multiple sequence alignment, which is the fundamental basis of constructing a phylogenetic tree. The third stage includes different models of DNA and amino acid substitution. Several models of substitution exist. A few examples include Hamming distance, the Jukes and Cantor one-parameter model, and the Kimura two-parameter model (see Models of DNA evolution). The fourth stage consists of various methods of tree building, including distance-based and character-based methods. The normalized Hamming distance and the Jukes-Cantor correction formulas provide the degree of divergence and the probability that a nucleotide changes to another, respectively. Common tree-building methods include unweighted pair group method using arithmetic mean (UPGMA) and Neighbor joining, which are distance-based methods, Maximum parsimony, which is a character-based method, and Maximum likelihood estimation and Bayesian inference, which are character-based/model-based methods. UPGMA is a simple method; however, it is less accurate than the neighbor-joining approach. Finally, the last step comprises evaluating the trees. This assessment of accuracy is composed of consistency, efficiency, and robustness.

Five Stages of Molecular Phylogenetic Analysis

MEGA (molecular evolutionary genetics analysis) is an analysis software that is user-friendly and free to download and use. This software is capable of analyzing both distance-based and character-based tree methodologies. MEGA also contains several options one may choose to utilize, such as heuristic approaches and bootstrapping. Bootstrapping is an approach that is commonly used to measure the robustness of topology in a phylogenetic tree, which demonstrates the percentage each clade is supported after numerous replicates. In general, a value greater than 70% is considered significant. The flow chart displayed on the right visually demonstrates the order of the five stages of Pevsner's molecular phylogenetic analysis technique that have been described.

Limitations

Molecular systematics is an essentially cladistic approach: it assumes that classification must correspond to phylogenetic descent, and that all valid taxa must be monophyletic. This is a limitation when attempting to determine the optimal tree(s), which often involves bisecting and reconnecting portions of the phylogenetic tree(s).

The recent discovery of extensive horizontal gene transfer among organisms provides a significant complication to molecular systematics, indicating that different genes within the same organism can have different phylogenies. HGTs can be detected and excluded using a number of phylogenetic methods (see Inferring horizontal gene transfer § Explicit phylogenetic methods).

In addition, molecular phylogenies are sensitive to the assumptions and models that go into making them. Firstly, sequences must be aligned; then, issues such as long-branch attraction, saturation, and taxon sampling problems must be addressed. This means that strikingly different results can be obtained by applying different models to the same dataset. The tree-building method also brings with it specific assumptions about tree topology, evolution speeds, and sampling. The simplistic UPGMA assumes a rooted tree and a uniform molecular clock, both of which can be incorrect.

p53

From Wikipedia, the free encyclopedia
https://en.wikipedia.org/wiki/P53
TP53

p53, also known as Tumor protein P53, cellular tumor antigen p53 (UniProt name), or transformation-related protein 53 (TRP53) is a regulatory protein that is often mutated in human cancers. The p53 proteins (originally thought to be, and often spoken of as, a single protein) are crucial in vertebrates, where they prevent cancer formation. As such, p53 has been described as "the guardian of the genome" because of its role in conserving stability by preventing genome mutation. Hence TP53 is classified as a tumor suppressor gene.

The TP53 gene is the most frequently mutated gene (>50%) in human cancer, indicating that the TP53 gene plays a crucial role in preventing cancer formation. TP53 gene encodes proteins that bind to DNA and regulate gene expression to prevent mutations of the genome. In addition to the full-length protein, the human TP53 gene encodes at least 12 protein isoforms.

Gene

In humans, the TP53 gene is located on the short arm of chromosome 17 (17p13.1). The gene spans 20 kb, with a non-coding exon 1 and a very long first intron of 10 kb, overlapping the Hp53int1 gene. The coding sequence contains five regions showing a high degree of conservation in vertebrates, predominantly in exons 2, 5, 6, 7 and 8, but the sequences found in invertebrates show only distant resemblance to mammalian TP53. TP53 orthologs have been identified in most mammals for which complete genome data are available.

Human TP53 gene

In humans, a common polymorphism involves the substitution of an arginine for a proline at codon position 72 of exon 4. Many studies have investigated a genetic link between this variation and cancer susceptibility; however, the results have been controversial. For instance, a meta-analysis from 2009 failed to show a link for cervical cancer. A 2011 study found that the TP53 proline mutation did have a profound effect on pancreatic cancer risk among males. A study of Arab women found that proline homozygosity at TP53 codon 72 is associated with a decreased risk for breast cancer. One study suggested that TP53 codon 72 polymorphisms, MDM2 SNP309, and A2164G may collectively be associated with non-oropharyngeal cancer susceptibility and that MDM2 SNP309 in combination with TP53 codon 72 may accelerate the development of non-oropharyngeal cancer in women. A 2011 study found that TP53 codon 72 polymorphism was associated with an increased risk of lung cancer.

Meta-analyses from 2011 found no significant associations between TP53 codon 72 polymorphisms and both colorectal cancer risk and endometrial cancer risk. A 2011 study of a Brazilian birth cohort found an association between the non-mutant arginine TP53 and individuals without a family history of cancer. Another 2011 study found that the p53 homozygous (Pro/Pro) genotype was associated with a significantly increased risk for renal cell carcinoma.

Function

DNA damage and repair

p53 plays a role in regulation or progression through the cell cycle, apoptosis, and genomic stability by means of several mechanisms:

  • It can activate DNA repair proteins when DNA has sustained damage. Thus, it may be an important factor in aging.
  • It can arrest growth by holding the cell cycle at the G1/S regulation point on DNA damage recognition—if it holds the cell here for long enough, the DNA repair proteins will have time to fix the damage and the cell will be allowed to continue the cell cycle.
  • It can initiate apoptosis (i.e., programmed cell death) if DNA damage proves to be irreparable.
  • It is essential for the senescence response to short telomeres.
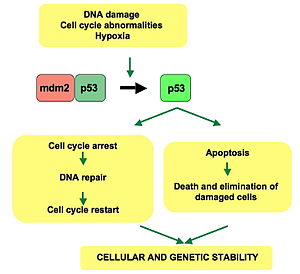
p53 pathway: In a normal cell, p53 is inactivated by its negative regulator, mdm2. Upon DNA damage or other stresses, various pathways will lead to the dissociation of the p53 and mdm2 complex. Once activated, p53 will induce a cell cycle arrest to allow either repair and survival of the cell or apoptosis to discard the damaged cell. How p53 makes this choice is currently unknown.

WAF1/CIP1 encodes for p21 and hundreds of other down-stream genes. p21 (WAF1) binds to the G1-S/CDK (CDK4/CDK6, CDK2, and CDK1) complexes (molecules important for the G1/S transition in the cell cycle) inhibiting their activity.

When p21(WAF1) is complexed with CDK2, the cell cannot continue to the next stage of cell division. A mutant p53 will no longer bind DNA in an effective way, and, as a consequence, the p21 protein will not be available to act as the "stop signal" for cell division. Studies of human embryonic stem cells (hESCs) commonly describe the nonfunctional p53-p21 axis of the G1/S checkpoint pathway with subsequent relevance for cell cycle regulation and the DNA damage response (DDR). Importantly, p21 mRNA is clearly present and upregulated after the DDR in hESCs, but p21 protein is not detectable. In this cell type, p53 activates numerous microRNAs (like miR-302a, miR-302b, miR-302c, and miR-302d) that directly inhibit the p21 expression in hESCs.

The p21 protein binds directly to cyclin-CDK complexes that drive forward the cell cycle and inhibits their kinase activity, thereby causing cell cycle arrest to allow repair to take place. p21 can also mediate growth arrest associated with differentiation and a more permanent growth arrest associated with cellular senescence. The p21 gene contains several p53 response elements that mediate direct binding of the p53 protein, resulting in transcriptional activation of the gene encoding the p21 protein.

The p53 and RB1 pathways are linked via p14ARF, raising the possibility that the pathways may regulate each other.

p53 expression can be stimulated by UV light, which also causes DNA damage. In this case, p53 can initiate events leading to tanning.

Stem cells

Levels of p53 play an important role in the maintenance of stem cells throughout development and the rest of human life.

In human embryonic stem cells (hESCs)s, p53 is maintained at low inactive levels. This is because activation of p53 leads to rapid differentiation of hESCs. Studies have shown that knocking out p53 delays differentiation and that adding p53 causes spontaneous differentiation, showing how p53 promotes differentiation of hESCs and plays a key role in cell cycle as a differentiation regulator. When p53 becomes stabilized and activated in hESCs, it increases p21 to establish a longer G1. This typically leads to abolition of S-phase entry, which stops the cell cycle in G1, leading to differentiation. Work in mouse embryonic stem cells has recently shown however that the expression of P53 does not necessarily lead to differentiation. p53 also activates miR-34a and miR-145, which then repress the hESCs pluripotency factors, further instigating differentiation.

In adult stem cells, p53 regulation is important for maintenance of stemness in adult stem cell niches. Mechanical signals such as hypoxia affect levels of p53 in these niche cells through the hypoxia inducible factors, HIF-1α and HIF-2α. While HIF-1α stabilizes p53, HIF-2α suppresses it. Suppression of p53 plays important roles in cancer stem cell phenotype, induced pluripotent stem cells and other stem cell roles and behaviors, such as blastema formation. Cells with decreased levels of p53 have been shown to reprogram into stem cells with a much greater efficiency than normal cells. Papers suggest that the lack of cell cycle arrest and apoptosis gives more cells the chance to be reprogrammed. Decreased levels of p53 were also shown to be a crucial aspect of blastema formation in the legs of salamanders. p53 regulation is very important in acting as a barrier between stem cells and a differentiated stem cell state, as well as a barrier between stem cells being functional and being cancerous.

Other

An overview of the molecular mechanism of action of p53 on the angiogenesis

Apart from the cellular and molecular effects above, p53 has a tissue-level anticancer effect that works by inhibiting angiogenesis. As tumors grow they need to recruit new blood vessels to supply them, and p53 inhibits that by (i) interfering with regulators of tumor hypoxia that also affect angiogenesis, such as HIF1 and HIF2, (ii) inhibiting the production of angiogenic promoting factors, and (iii) directly increasing the production of angiogenesis inhibitors, such as arresten.

p53 by regulating Leukemia Inhibitory Factor has been shown to facilitate implantation in the mouse and possibly human reproduction.

The immune response to infection also involves p53 and NF-κB. Checkpoint control of the cell cycle and of apoptosis by p53 is inhibited by some infections such as Mycoplasma bacteria, raising the specter of oncogenic infection.

Regulation

p53 acts as a cellular stress sensor. It is normally kept at low levels by being constantly marked for degradation by the E3 ubiquitin ligase protein MDM2. p53 is activated in response to myriad stressors – including DNA damage (induced by either UV, IR, or chemical agents such as hydrogen peroxide), oxidative stress, osmotic shock, ribonucleotide depletion, viral lung infections and deregulated oncogene expression. This activation is marked by two major events. First, the half-life of the p53 protein is increased drastically, leading to a quick accumulation of p53 in stressed cells. Second, a conformational change forces p53 to be activated as a transcription regulator in these cells. The critical event leading to the activation of p53 is the phosphorylation of its N-terminal domain. The N-terminal transcriptional activation domain contains a large number of phosphorylation sites and can be considered as the primary target for protein kinases transducing stress signals.

The protein kinases that are known to target this transcriptional activation domain of p53 can be roughly divided into two groups. A first group of protein kinases belongs to the MAPK family (JNK1-3, ERK1-2, p38 MAPK), which is known to respond to several types of stress, such as membrane damage, oxidative stress, osmotic shock, heat shock, etc. A second group of protein kinases (ATR, ATM, CHK1 and CHK2, DNA-PK, CAK, TP53RK) is implicated in the genome integrity checkpoint, a molecular cascade that detects and responds to several forms of DNA damage caused by genotoxic stress. Oncogenes also stimulate p53 activation, mediated by the protein p14ARF.

In unstressed cells, p53 levels are kept low through a continuous degradation of p53. A protein called Mdm2 (also called HDM2 in humans), binds to p53, preventing its action and transports it from the nucleus to the cytosol. Mdm2 also acts as an ubiquitin ligase and covalently attaches ubiquitin to p53 and thus marks p53 for degradation by the proteasome. However, ubiquitylation of p53 is reversible. On activation of p53, Mdm2 is also activated, setting up a feedback loop. p53 levels can show oscillations (or repeated pulses) in response to certain stresses, and these pulses can be important in determining whether the cells survive the stress, or die.

MI-63 binds to MDM2, reactivating p53 in situations where p53's function has become inhibited.

A ubiquitin specific protease, USP7 (or HAUSP), can cleave ubiquitin off p53, thereby protecting it from proteasome-dependent degradation via the ubiquitin ligase pathway. This is one means by which p53 is stabilized in response to oncogenic insults. USP42 has also been shown to deubiquitinate p53 and may be required for the ability of p53 to respond to stress.

Recent research has shown that HAUSP is mainly localized in the nucleus, though a fraction of it can be found in the cytoplasm and mitochondria. Overexpression of HAUSP results in p53 stabilization. However, depletion of HAUSP does not result in a decrease in p53 levels but rather increases p53 levels due to the fact that HAUSP binds and deubiquitinates Mdm2. It has been shown that HAUSP is a better binding partner to Mdm2 than p53 in unstressed cells.

USP10, however, has been shown to be located in the cytoplasm in unstressed cells and deubiquitinates cytoplasmic p53, reversing Mdm2 ubiquitination. Following DNA damage, USP10 translocates to the nucleus and contributes to p53 stability. Also USP10 does not interact with Mdm2.

Phosphorylation of the N-terminal end of p53 by the above-mentioned protein kinases disrupts Mdm2-binding. Other proteins, such as Pin1, are then recruited to p53 and induce a conformational change in p53, which prevents Mdm2-binding even more. Phosphorylation also allows for binding of transcriptional coactivators, like p300 and PCAF, which then acetylate the C-terminal end of p53, exposing the DNA binding domain of p53, allowing it to activate or repress specific genes. Deacetylase enzymes, such as Sirt1 and Sirt7, can deacetylate p53, leading to an inhibition of apoptosis. Some oncogenes can also stimulate the transcription of proteins that bind to MDM2 and inhibit its activity.

Epigenetic marks like histone methylation can also regulate p53, for example, p53 interacts directly with a repressive Trim24 cofactor that binds histones in regions of the genome that are epigenetically repressed. Trim24 prevents p53 from activating its targets, but only in these regions, effectively giving p53 the ability to 'read out' the histone profile at key target genes and act in a gene-specific manner.

Role in disease

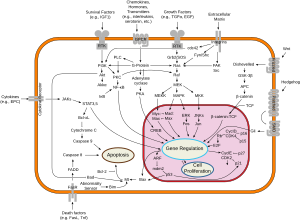
Overview of signal transduction pathways involved in apoptosis
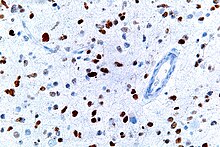
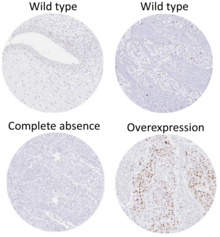
A micrograph showing cells with abnormal p53 expression (brown) in a brain tumor. p53 immunostain.

If the TP53 gene is damaged, tumor suppression is severely compromised. People who inherit only one functional copy of the TP53 gene will most likely develop tumors in early adulthood, a disorder known as Li–Fraumeni syndrome.

The TP53 gene can also be modified by mutagens (chemicals, radiation, or viruses), increasing the likelihood for uncontrolled cell division. More than 50 percent of human tumors contain a mutation or deletion of the TP53 gene. Loss of p53 creates genomic instability that most often results in an aneuploidy phenotype.

Increasing the amount of p53 may seem a solution for treatment of tumors or prevention of their spreading. This, however, is not a usable method of treatment, since it can cause premature aging. Restoring endogenous normal p53 function holds some promise. Research has shown that this restoration can lead to regression of certain cancer cells without damaging other cells in the process. The ways by which tumor regression occurs depends mainly on the tumor type. For example, restoration of endogenous p53 function in lymphomas may induce apoptosis, while cell growth may be reduced to normal levels. Thus, pharmacological reactivation of p53 presents itself as a viable cancer treatment option. The first commercial gene therapy, Gendicine, was approved in China in 2003 for the treatment of head and neck squamous cell carcinoma. It delivers a functional copy of the p53 gene using an engineered adenovirus.

Certain pathogens can also affect the p53 protein that the TP53 gene expresses. One such example, human papillomavirus (HPV), encodes a protein, E6, which binds to the p53 protein and inactivates it. This mechanism, in synergy with the inactivation of the cell cycle regulator pRb by the HPV protein E7, allows for repeated cell division manifested clinically as warts. Certain HPV types, in particular types 16 and 18, can also lead to progression from a benign wart to low or high-grade cervical dysplasia, which are reversible forms of precancerous lesions. Persistent infection of the cervix over the years can cause irreversible changes leading to carcinoma in situ and eventually invasive cervical cancer. This results from the effects of HPV genes, particularly those encoding E6 and E7, which are the two viral oncoproteins that are preferentially retained and expressed in cervical cancers by integration of the viral DNA into the host genome.

The p53 protein is continually produced and degraded in cells of healthy people, resulting in damped oscillation. The degradation of the p53 protein is associated with binding of MDM2. In a negative feedback loop, MDM2 itself is induced by the p53 protein. Mutant p53 proteins often fail to induce MDM2, causing p53 to accumulate at very high levels. Moreover, the mutant p53 protein itself can inhibit normal p53 protein levels. In some cases, single missense mutations in p53 have been shown to disrupt p53 stability and function.

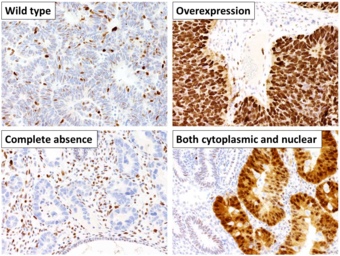
This image shows different patterns of p53 expression in endometrial cancers on chromogenic immunohistochemistry, whereof all except wild-type are variably termed abnormal/aberrant/mutation-type and are strongly predictive of an underlying TP53 mutation:

  • Wild-type, upper left: Endometrial endometrioid carcinoma showing normal wild-type pattern of p53 expression with variable proportion of tumor cell nuclei staining with variable intensity. Note, this wild-type pattern should not be reported as "positive," because this is ambiguous reporting language.
  • Overexpression, upper right: Endometrial endometrioid carcinoma, grade 3, with overexpression, showing strong staining in virtually all tumor cell nuclei, much stronger compared with the internal control of fibroblasts in the center. Note, there is some cytoplasmic background indicating that this staining is quite strong but this should not be interpreted as abnormal cytoplasmic pattern.
  • Complete absence, lower left: Endometrial serous carcinoma showing complete absence of p53 expression with internal control showing moderate to strong but variable staining. Note, wild-type pattern in normal atrophic glands at 12 and 6 o'clock.
  • Both cytoplasmic and nuclear, lower right: Endometrial endometrioid carcinoma showing cytoplasmic p53 expression with internal control (stroma and normal endometrial glands) showing nuclear wild-type pattern. The cytoplasmic pattern is accompanied by nuclear staining of similar intensity.
Immunohistochemistry for p53 can help distinguish a papillary urothelial neoplasm of low malignant potential (PUNLMP) from a low grade urothelial carcinoma. Overexpression is seen in 75% of low-grade urothelial carcinomas and only 10% of PUNLMP.

Suppression of p53 in human breast cancer cells is shown to lead to increased CXCR5 chemokine receptor gene expression and activated cell migration in response to chemokine CXCL13.

One study found that p53 and Myc proteins were key to the survival of Chronic Myeloid Leukaemia (CML) cells. Targeting p53 and Myc proteins with drugs gave positive results on mice with CML.

Experimental analysis of p53 mutations

Most p53 mutations are detected by DNA sequencing. However, it is known that single missense mutations can have a large spectrum from rather mild to very severe functional effects.

The large spectrum of cancer phenotypes due to mutations in the TP53 gene is also supported by the fact that different isoforms of p53 proteins have different cellular mechanisms for prevention against cancer. Mutations in TP53 can give rise to different isoforms, preventing their overall functionality in different cellular mechanisms and thereby extending the cancer phenotype from mild to severe. Recent studies show that p53 isoforms are differentially expressed in different human tissues, and the loss-of-function or gain-of-function mutations within the isoforms can cause tissue-specific cancer or provide cancer stem cell potential in different tissues. TP53 mutation also hits energy metabolism and increases glycolysis in breast cancer cells.

The dynamics of p53 proteins, along with its antagonist Mdm2, indicate that the levels of p53, in units of concentration, oscillate as a function of time. This "damped" oscillation is both clinically documented  and mathematically modelled. Mathematical models also indicate that the p53 concentration oscillates much faster once teratogens, such as double-stranded breaks (DSB) or UV radiation, are introduced to the system. This supports and models the current understanding of p53 dynamics, where DNA damage induces p53 activation (see p53 regulation for more information). Current models can also be useful for modelling the mutations in p53 isoforms and their effects on p53 oscillation, thereby promoting de novo tissue-specific pharmacological drug discovery.

Discovery

p53 was identified in 1979 by Lionel Crawford, David P. Lane, Arnold Levine, and Lloyd Old, working at Imperial Cancer Research Fund (UK) Princeton University/UMDNJ (Cancer Institute of New Jersey), and Memorial Sloan Kettering Cancer Center, respectively. It had been hypothesized to exist before as the target of the SV40 virus, a strain that induced development of tumors. The name p53 was given in 1979 describing the apparent molecular mass.

The TP53 gene from the mouse was first cloned by Peter Chumakov of The Academy of Sciences of the USSR in 1982, and independently in 1983 by Moshe Oren in collaboration with David Givol (Weizmann Institute of Science). The human TP53 gene was cloned in 1984 and the full length clone in 1985.

It was initially presumed to be an oncogene due to the use of mutated cDNA following purification of tumor cell mRNA. Its role as a tumor suppressor gene was revealed in 1989 by Bert Vogelstein at the Johns Hopkins School of Medicine and Arnold Levine at Princeton University. p53 went on to be identified as a transcription factor by Guillermina Lozano working at MD Anderson Cancer Center.

Warren Maltzman, of the Waksman Institute of Rutgers University first demonstrated that TP53 was responsive to DNA damage in the form of ultraviolet radiation. In a series of publications in 1991–92, Michael Kastan of Johns Hopkins University, reported that TP53 was a critical part of a signal transduction pathway that helped cells respond to DNA damage.

In 1993, p53 was voted molecule of the year by Science magazine.

Structure

A schematic of the known protein domains in p53 (NLS = Nuclear Localization Signal)
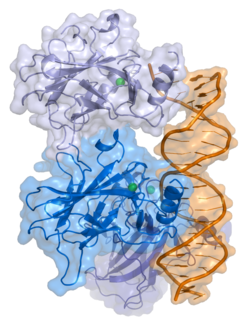
Crystal structure of four p53 DNA binding domains (as found in the bioactive homo-tetramer)

p53 has seven domains:

  1. an acidic N-terminus transcription-activation domain (TAD), also known as activation domain 1 (AD1), which activates transcription factors. The N-terminus contains two complementary transcriptional activation domains, with a major one at residues 1–42 and a minor one at residues 55–75, specifically involved in the regulation of several pro-apoptotic genes.
  2. activation domain 2 (AD2) important for apoptotic activity: residues 43–63.
  3. proline rich domain important for the apoptotic activity of p53 by nuclear exportation via MAPK: residues 64–92.
  4. central DNA-binding core domain (DBD). Contains one zinc atom and several arginine amino acids: residues 102–292. This region is responsible for binding the p53 co-repressor LMO3.
  5. Nuclear Localization Signaling (NLS) domain, residues 316–325.
  6. homo-oligomerisation domain (OD): residues 307–355. Tetramerization is essential for the activity of p53 in vivo.
  7. C-terminal involved in downregulation of DNA binding of the central domain: residues 356–393.

Mutations that deactivate p53 in cancer usually occur in the DBD. Most of these mutations destroy the ability of the protein to bind to its target DNA sequences, and thus prevents transcriptional activation of these genes. As such, mutations in the DBD are recessive loss-of-function mutations. Molecules of p53 with mutations in the OD dimerise with wild-type p53, and prevent them from activating transcription. Therefore, OD mutations have a dominant negative effect on the function of p53.

Wild-type p53 is a labile protein, comprising folded and unstructured regions that function in a synergistic manner.

SDS-PAGE analysis indicates that p53 is a 53-kilodalton (kDa) protein. However, the actual mass of the full-length p53 protein (p53α) based on the sum of masses of the amino acid residues is only 43.7 kDa. This difference is due to the high number of proline residues in the protein, which slow its migration on SDS-PAGE, thus making it appear heavier than it actually is.

Isoforms

As with 95% of human genes, TP53 encodes more than one protein. All these p53 proteins are called the p53 isoforms. These proteins range in size from 3.5 to 43.7 kDa. Several isoforms were discovered in 2005, and so far 12 human p53 isoforms have been identified (p53α, p53β, p53γ, ∆40p53α, ∆40p53β, ∆40p53γ, ∆133p53α, ∆133p53β, ∆133p53γ, ∆160p53α, ∆160p53β, ∆160p53γ). Furthermore, p53 isoforms are expressed in a tissue dependent manner and p53α is never expressed alone.

The full length p53 isoform proteins can be subdivided into different protein domains. Starting from the N-terminus, there are first the amino-terminal transcription-activation domains (TAD 1, TAD 2), which are needed to induce a subset of p53 target genes. This domain is followed by the proline rich domain (PXXP), whereby the motif PXXP is repeated (P is a proline and X can be any amino acid). It is required among others for p53 mediated apoptosis. Some isoforms lack the proline rich domain, such as Δ133p53β,γ and Δ160p53α,β,γ; hence some isoforms of p53 are not mediating apoptosis, emphasizing the diversifying roles of the TP53 gene. Afterwards there is the DNA binding domain (DBD), which enables the proteins to sequence specific binding. The C-terminus domain completes the protein. It includes the nuclear localization signal (NLS), the nuclear export signal (NES) and the oligomerisation domain (OD). The NLS and NES are responsible for the subcellular regulation of p53. Through the OD, p53 can form a tetramer and then bind to DNA. Among the isoforms, some domains can be missing, but all of them share most of the highly conserved DNA-binding domain.

The isoforms are formed by different mechanisms. The beta and the gamma isoforms are generated by multiple splicing of intron 9, which leads to a different C-terminus. Furthermore, the usage of an internal promoter in intron 4 causes the ∆133 and ∆160 isoforms, which lack the TAD domain and a part of the DBD. Moreover, alternative initiation of translation at codon 40 or 160 bear the ∆40p53 and ∆160p53 isoforms.

Due to the isoformic nature of p53 proteins, there have been several sources of evidence showing that mutations within the TP53 gene giving rise to mutated isoforms are causative agents of various cancer phenotypes, from mild to severe, due to single mutation in the TP53 gene (refer to section Experimental analysis of p53 mutations for more details).

Nuclear envelope

From Wikipedia, the free encyclopedia
Nuclear envelope
Human cell nucleus

The nuclear envelope, also known as the nuclear membrane, is made up of two lipid bilayer membranes that in eukaryotic cells surround the nucleus, which encloses the genetic material.

The nuclear envelope consists of two lipid bilayer membranes: an inner nuclear membrane and an outer nuclear membrane. The space between the membranes is called the perinuclear space. It is usually about 10–50 nm wide. The outer nuclear membrane is continuous with the endoplasmic reticulum membrane. The nuclear envelope has many nuclear pores that allow materials to move between the cytosol and the nucleus. Intermediate filament proteins called lamins form a structure called the nuclear lamina on the inner aspect of the inner nuclear membrane and give structural support to the nucleus.

Structure

The nuclear envelope is made up of two lipid bilayer membranes, an inner nuclear membrane and an outer nuclear membrane. These membranes are connected to each other by nuclear pores. Two sets of intermediate filaments provide support for the nuclear envelope. An internal network forms the nuclear lamina on the inner nuclear membrane. A looser network forms outside to give external support. The actual shape of the nuclear envelope is irregular. It has invaginations and protrusions and can be observed with an electron microscope.

A volumetric surface render (red) of the nuclear envelope of one HeLa cell. The cell was observed in 300 slices of electron microscopy, the nuclear envelope was automatically segmented and rendered. One vertical and one horizontal slice are added for reference.

Outer membrane

The outer nuclear membrane also shares a common border with the endoplasmic reticulum. While it is physically linked, the outer nuclear membrane contains proteins found in far higher concentrations than the endoplasmic reticulum. All four nesprin proteins (nuclear envelope spectrin repeat proteins) present in mammals are expressed in the outer nuclear membrane. Nesprin proteins connect cytoskeletal filaments to the nucleoskeleton. Nesprin-mediated connections to the cytoskeleton contribute to nuclear positioning and to the cell’s mechanosensory function. KASH domain proteins of Nesprin-1 and -2 are part of a LINC complex (linker of nucleoskeleton and cytoskeleton) and can bind directly to cystoskeletal components, such as actin filaments, or can bind to proteins in the perinuclear space. Nesprin-3 and -4 may play a role in unloading enormous cargo; Nesprin-3 proteins bind plectin and link the nuclear envelope to cytoplasmic intermediate filaments. Nesprin-4 proteins bind the plus end directed motor kinesin-1. The outer nuclear membrane is also involved in development, as it fuses with the inner nuclear membrane to form nuclear pores.

Inner membrane

The inner nuclear membrane encloses the nucleoplasm, and is covered by the nuclear lamina, a mesh of intermediate filaments which stabilizes the nuclear membrane as well as being involved in chromatin function. It is connected to the outer membrane by nuclear pores which penetrate the membranes. While the two membranes and the endoplasmic reticulum are linked, proteins embedded in the membranes tend to stay put rather than dispersing across the continuum. It is lined with a fiber network called the nuclear lamina which is 10-40 nm thick and provides strength.

Mutations in the genes that encode for the inner nuclear membrane proteins can cause several laminopathies.

Nuclear pores

Nuclear pores crossing the nuclear envelope

The nuclear envelope is punctured by around a thousand nuclear pore complexes, about 100 nm across, with an inner channel about 40 nm wide. The complexes contain a number of nucleoporins, proteins that link the inner and outer nuclear membranes.

Cell division

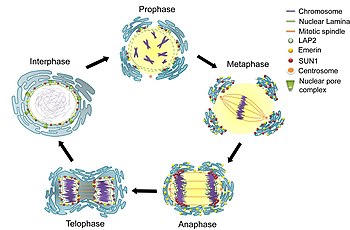
During the G2 phase of interphase, the nuclear membrane increases its surface area and doubles its number of nuclear pore complexes. In eukaryotes such as yeast which undergo closed mitosis, the nuclear membrane stays intact during cell division. The spindle fibers either form within the membrane, or penetrate it without tearing it apart. In other eukaryotes (animals as well as plants), the nuclear membrane must break down during the prometaphase stage of mitosis to allow the mitotic spindle fibers to access the chromosomes inside. The breakdown and reformation processes are not well understood.

Breakdown

Breakdown and reassembly in mitosis

In mammals, the nuclear membrane can break down within minutes, following a set of steps during the early stages of mitosis. First, M-Cdk's phosphorylate nucleoporin polypeptides and they are selectively removed from the nuclear pore complexes. After that, the rest of the nuclear pore complexes break apart simultaneously. Biochemical evidence suggests that the nuclear pore complexes disassemble into stable pieces rather than disintegrating into small polypeptide fragments. M-Cdk's also phosphorylate elements of the nuclear lamina (the framework that supports the envelope) leading to the disassembly of the lamina and hence the envelope membranes into small vesicles. Electron and fluorescence microscopy has given strong evidence that the nuclear membrane is absorbed by the endoplasmic reticulum—nuclear proteins not normally found in the endoplasmic reticulum show up during mitosis.

In addition to the breakdown of the nuclear membrane during the prometaphase stage of mitosis, the nuclear membrane also ruptures in migrating mammalian cells during the interphase stage of the cell cycle.[20] This transient rupture is likely caused by nuclear deformation. The rupture is rapidly repaired by a process dependent on "endosomal sorting complexes required for transport" (ESCRT) made up of cytosolic protein complexes.[20] During nuclear membrane rupture events, DNA double-strand breaks occur. Thus the survival of cells migrating through confined environments appears to depend on efficient nuclear envelope and DNA repair machineries.

Aberrant nuclear envelope breakdown has also been observed in laminopathies and in cancer cells leading to mislocalization of cellular proteins, the formation of micronuclei and genomic instability.

Reformation

Exactly how the nuclear membrane reforms during telophase of mitosis is debated. Two theories exist—

  • Vesicle fusion — where vesicles of nuclear membrane fuse together to rebuild the nuclear membrane
  • Re-shaping of the endoplasmic reticulum—where the parts of the endoplasmic reticulum containing the absorbed nuclear membrane envelop the nuclear space, reforming a closed membrane.

Origin of the nuclear membrane

A study of the comparative genomics, evolution and origins of the nuclear membrane led to the proposal that the nucleus emerged in the primitive eukaryotic ancestor (the “prekaryote”), and was triggered by the archaeo-bacterial symbiosis. Several ideas have been proposed for the evolutionary origin of the nuclear membrane. These ideas include the invagination of the plasma membrane in a prokaryote ancestor, or the formation of a genuine new membrane system following the establishment of proto-mitochondria in the archaeal host. The adaptive function of the nuclear membrane may have been to serve as a barrier to protect the genome from reactive oxygen species (ROS) produced by the cells' pre-mitochondria.

Historical materialism

From Wikipedia, the free encyclopedia https://en.wikipedia.org/wiki/Dialectic Historical materialism is Karl M...