Original link: https://judithcurry.com/2015/12/13/a-closer-look-at-scenario-rcp8-5/
The United Nations Climate Change Conference (COP21) in Paris climate was preceded by a surge of studies and articles warning of a dismal future if we do not take strong policy action. One scenario in the IPCC’s Fifth Assessment Report (AR5) provides the basis for these: RCP8.5. Even a casual examination of this shows it to be a useful worst-case scenario, but not “business as usual”.
(1) An introduction to scenarios about our future
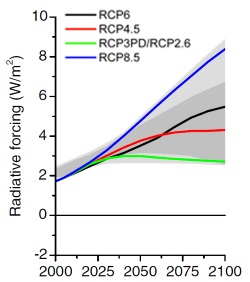
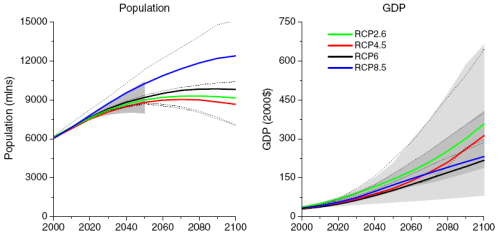
In AR5 four Representative Concentration Pathways (RCPs) describe scenarios for future emissions, concentrations, and land-use, ending with radiative forcing levels of 2.6, 4.5, 6.0, and 8.5 W/m2 by 2100. Strong mitigation policies result in a low forcing level (RCP2.6). Two medium stabilization scenarios lead to intermediate outcomes: (RCP4.5, RCP6.0).RCP8.5 gets the most attention. It assumes the fastest population growth (a doubling of Earth’s population to 12 billion), the lowest rate of technology development, slow GDP growth, a massive increase in world poverty, plus high energy use and emissions. For more about the RCPs see “The representative concentration pathways: an overview” by Detlef P. van Vuuren et al, Climatic Change, Nov 2011.
RCP8.5 assumes a nightmarish world even before climate impacts, resulting from substantial changes to long-standing trends. It provides AR5 with an essential worst case scenario necessary for conservative planning.
Unfortunately scientists often inaccurately describe RCP8.5 as the baseline scenario — a future without policy action: “a relatively conservative business as usual case with low income, high population and high energy demand due to only modest improvements in energy intensity” from “RCP 8.5: A scenario of comparatively high greenhouse gas emissions” by Keywan Riahi et al in Climate Change, November 2011, This is a material misrepresentation of RCP8.5. Scientists then use RCP8.5 to construct horrific visions of the future. They seldom mention its unlikely assumptions.
(2) About RCP8.5, the stuff nightmares are made from
(a) Rapid population growth
RP8.5 assumes population growth at the high end of the current UN forecasts: 80% odds of between 9.6 and 12.3 billion people by 2100 (Gerland, P. et al, Science 10 Oct 2014). Most of this growth occurs in Africa, assuming that the collapse in fertility seem in the rest of the world will not occur there (Iran’s fertility was 6.0% in 1980, it is ~1.6 now, below the replacement rate of 2.1).Gerland makes a purely probabilistic forecast, without considering if Africa can support the same population density as China does today. Their high end forecast, used in RCP8.5, is that Nigeria’s population will grow from 175 million today to 1.5 billion in 2100. See this for more information about the Gerland 2014 forecast.
(b) Technological stagnation: back to the 19th Century’s coal-driven world
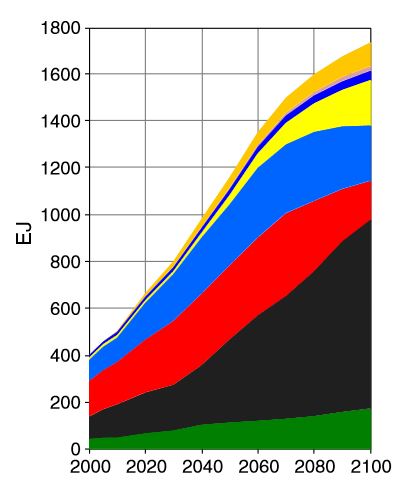
RCP8.5’s assumes that the centuries long progress of technology will slow. Most importantly, it assumes that three centuries of evolution to ever more efficient energy sources reverses and we burn off almost all of Earth’s fossil fuel reserves.
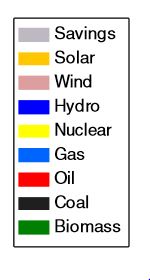
RCP8.5 describes a hot dirty future for the world, in which coal use
increases to become the major source of power for the world.
There is an analytical basis for these forecasts. For example, see “Drivers for the renaissance of coal” by Jan Christoph Steckel et al in PNAS, 2015. The authors predict that coal use will increase not just in China and India, but also in fast-growing poor countries. There are a lot of poor nations in RCP8.5.
But this assumes that the long shift away from coal continues. Data from the Energy Information Agency shows that world coal consumption fell by 98 million short tons (1.2%) in 2012 (most recent data) following peaking in many nations, both poor and rich nations. North American use peaked in 2005; 2012 was down an astonishing 21% since then (USA use in Q1 2015 was down 24% from Q1 2005). Europe peaked in 2007, after 6 of its 9 largest coal-consuming nations peaked: UK and Poland in 2006; Czech, Germany, and Greece in 2007; and Turkey in 2011. Africa peaked in 2008 and Asia in 2011.
History shows that as poor nations grow into the middle income brackets, people become willing to pay for a cleaner environment. That often drives regulations on the mining and burning of coal, which raises its cost (in the US perhaps going to uneconomic levels). We see the first signs of that now in India and China. A March report by the Sierra Club describes the situation:
“From 2005 to 2012, worldwide coal-fired generating capacity boomed, growing at three times the previous pace. The increase in the global coal fleet was twice the size of the entire existing U.S. coal fleet. That boom is now busting. In India, projects shelved or cancelled since 2012 outnumber project completions by six to one, and new construction initiations are at a near-standstill. In both Europe and the U.S., the coal fleet is shrinking, with retirements outnumbering new plants. China faces a looming glut in coal-fired generating capacity, with plant utilization rates at a 35-year low.”China has been the largest driver of global commodity consumption, including coal. Excluding China, world coal use is flat for 5 years, up only 13% for 10 years, and up only 7% in the previous 25 years (there is no Energy Information Agency data after 2012).
China has shown little concern about climate change, but air pollution from coal is a major public policy problem. “The cost of China’s reliance on coal: 670,000 smog-related deaths a year“. “Beijing to Shut All Major Coal Power Plants to Cut Pollution“. There are headlines like this almost monthly as public pressure grows for drastic action (see this Pew Research poll).
The Sierra Club report describes this and other drivers of China’s shift away from coal…
“Within China, the following policy trends are playing a significant role in determining future coal capacity: (1) Small Plant Replacement Policy, (2) air pollution mitigation, (3) economic restructuring, (4) expanding renewable, gas, nuclear, and hydro power sources, (5) climate policies, (6) energy efficiency initiatives, and (7) shifts in the regional distribution of generating capacity.”Perhaps these trends will reverse, but that cannot logically be considered the “business as usual” scenario.
(c) Technological stagnation: energy efficiency
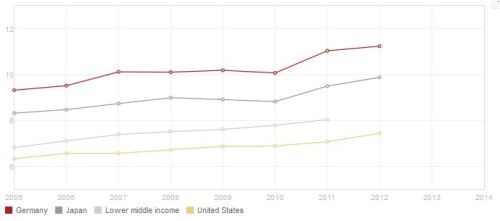
RCP8.5 assumes no decarbonization of world power sources from new technology (e.g., solar, wind, fission, fusion) or regulations to reduce not just climate change but also air pollution and toxic waste. Although possible, how likely is this? For example, use of solar and wind is skyrocketing as these technologies improve.RCP8.5 also assumes a slowing of technological innovation, most clearly seen in energy use. By 2100 energy efficiency has improved only slightly, so that despite GDP being one-third lower than under RCP2.6, energy consumption is over twice as large. That breaks the decades long trend, as partially shown in this graph of energy efficiency from the World Bank. There is not reason to assume this progress will halt.
GDP per kilogram of oil equivalent of energy use
(d) A more realistic view of our energy future
More speculatively, new technology to produce energy might lie in our future. There are dozens of advanced nuclear and fusion projects under development. A new report by Third Way describes that some have matured to the stage attracting private capital:The American energy sector has experienced enormous technological innovation over the past decade in everything from renewables (solar and wind power), to extraction (hydraulic fracturing), to storage (advanced batteries), to consumer efficiency (advanced thermostats). What has gone largely unnoticed is that nuclear power is poised to join the innovation list.
A new generation of engineers, entrepreneurs and investors are working to commercialize innovative and advanced nuclear reactors. … Third Way has found that there are nearly 50 companies, backed by more than $1.3 billion in private capital, developing plans for new nuclear plants in the U.S. and Canada. The mix includes startups and big-name investors like Bill Gates, all placing bets on a nuclear comeback, hoping to get the technology in position to win in an increasingly carbon-constrained world.
(3) Conclusions
The designers of the RCP’s made a methodological choice that was logical, but was either not understood or ignored by the IPCC’s authors. They started with targets for forcings and created scenarios that would produce them.The RCP8.5 scenario assumes ominous breaks in several important and long-standing trends. As such it provides a valuable warning against complacency and a reminder to prepare for extreme outcomes. But that meant that there was no business as usual scenario, a critical component for forecasting. None of the RCPs is even remotely close to fulfilling this role.
Worse was the labeling — with no supporting analysis — of RCP8.5 as the business as usual scenario (see the history here). Doing so preceded AR5, as in “Compared to the scenario literature RCP8.5 depicts thus a relatively conservative business as usual case with low income, high population and high energy demand due to only modest improvements in energy intensity” from “RCP 8.5: A scenario of comparatively high greenhouse gas emissions” by Keywan Riahi et al in Climate Change, November 2011.
I have written a description of the year 2100 assuming continuation of existing trends — including substantial advances in fusion. It’s a non-analytical discussion piece, showing that there is a more plausible alternative to RCP8.5’s nightmarish world of 2100. It shows that we need another RCP, one describing a base case showing reasonable projection of current trends.
Preparing that requires extrapolating trends for GDP, population, energy intensity, sources of energy, etc — assuming no breakthroughs in technology (e.g., fusion, a male contraceptive pill) — then calculating the resulting forcing. This should be done by a multidisciplinary team (imo tapping too-narrow a disciplinary base is one of the most serious weakness in climate science today). The cost would be trivial compared to its benefits.
As COP21 has shown, the public policy debate about climate change is gridlocked. Repeating what we have already done, with higher volume, seems unlikely to break it. Let’s draw outside the box and try different tactics.
