Search This Blog

Friday, November 11, 2022

Population density

From Wikipedia, the free encyclopedia
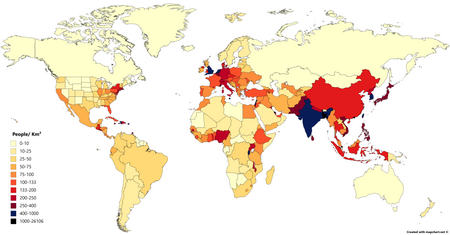
Population density (people per km2) by country or U.S. state in 2019
 
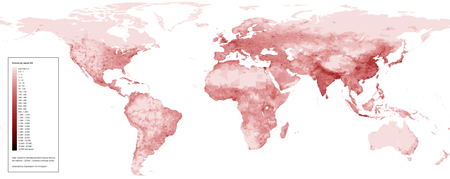
Population density (people per km2) map of the world in 1994. In relation to the equator it is seen that the vast majority of human population lives in the Northern Hemisphere, as 67% of Earth's land area is there.

Population density (in agriculture: standing stock or plant density) is a measurement of population per unit land area. It is mostly applied to humans, but sometimes to other living organisms. It is a key geographical term. In simple terms, population density refers to the number of people living in an area per square kilometre, or other unit of land area.

Biological population densities

Population density is population divided by total land area, sometimes including seas and oceans, as appropriate.

Low densities may cause an extinction vortex and further reduce fertility. This is called the Allee effect after the scientist who identified it. Examples of the causes of reduced fertility in low population densities are 

  • Increased problems with locating sexual mates
  • Increased inbreeding

Human densities

Population density (people per km2) by country, 2006
 
Population density (people per km2) map of the world in 2005
 

Population density is the number of people per unit of area, usually transcribed as "per square kilometer" or square mile, and which may include or exclude, for example, areas of water or glaciers. Commonly this is calculated for a county, city, country, another territory or the entire world.

The world's population is around 7,800,000,000 and Earth's total area (including land and water) is 510,000,000 km2 (197,000,000 sq. mi.). Therefore, from this very crude type of calculation, the worldwide human population density is approximately 7,800,000,000 ÷ 510,000,000 = 15.3/km2 (40 per sq. mi.). However, if only the Earth's land area of 150,000,000 km2 (58,000,000 sq. mi.) is taken into account, then human population density is 50/km2 (129 per sq. mi.). This includes all continental and island land area, including Antarctica. But if Antarctica is excluded, then population density rises to over 55 persons/km2 (over 142 per sq. mi.).

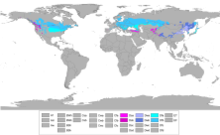
World environments map provided for comparison with maps above

Several of the most densely populated territories in the world are city-states, microstates and urban dependencies. In fact, 95% of the world's population is concentrated on just 10% of the world's land. These territories have a relatively small area and a high urbanization level, with an economically specialized city population drawing also on rural resources outside the area, illustrating the difference between high population density and overpopulation.

Deserts have very limited potential for growing crops as there is not enough rain to support them. Thus, their population density is generally low. However, some cities in the Middle East, such as Dubai, have been increasing in population and infrastructure growth at a fast pace.

Mongolian Steppes. Mongolia is the least densely populated country in the world due to its harsh climate as a result of its geography.

Cities with high population densities are, by some, considered to be overpopulated, though this will depend on factors like quality of housing and infrastructure and access to resources. Very densely populated cities are mostly in Asia (particularly Southeast Asia); Africa's Lagos, Kinshasa, and Cairo; South America's Bogotá, Lima, and São Paulo; and Mexico City and Saint Petersburg also fall into this category.

Monaco is currently the most densely populated nation in Europe.

City population and especially area are, however, heavily dependent on the definition of "urban area" used: densities are almost invariably higher for the center only than when suburban settlements and intervening rural areas are included, as in the agglomeration or metropolitan area (the latter sometimes including neighboring cities).

In comparison, based on a world population of 7.8 billion, the world's inhabitants, if conceptualized as a loose crowd occupying just under 1 m2 (10 sq. ft) per person (cf. Jacobs Method), would occupy a space a little larger than Delaware's land area.

Countries and dependent territories

Population under 10,000,000
Rank Country or
dependent territory
Area Population Density
km2 sq. mi. per km2 per sq.
mi.
1  Macau (China) 30.5 12 650,834 21,339 55,268
2  Monaco 2.02 0.78 37,550 18,589 48,145
3  Singapore 719.9 278 5,612,300 7,796 20,192
4  Hong Kong (China) 1,106.3 427 7,409,800 6,698 17,348
5  Gibraltar (UK)[12] 6.8 2.6 33,140 4,874 12,624
6  Bahrain 757 292 1,451,200 1,917 4,965
7   Vatican City 0.44 0.17 800 1,818 4,709
8  Malta 315 122 475,701 1,510 3,911
9  Maldives 298 115 378,114 1,269 3,287
10  Bermuda (UK) 52 20 63,779 1,227 3,178
 
Population above 10,000,000
Rank

Country Area Population Density
km2 sq. mi. per km2 per sq.
mi.
6  Bangladesh 143,998 55,598 170,329,768 1,183 3,064
10  Taiwan 36,193 13,974 23,539,588 650 1,683
13  South Korea 100,210 38,691 51,824,142 517 1,339
14  Rwanda 26,338 10,169 12,955,768 492 1,274
16  Burundi 27,816 10,740 12,574,571 452 1,171
17  Haiti 27,065 10,450 11,743,017 434 1,124
18  Netherlands 41,526 16,033 17,572,831 423 1,096
19  India 3,287,240 1,269,210 1,374,547,140 418 1,083
22  Belgium 30,528 11,787 11,554,449 378 979
23  Philippines 300,000 115,831 109,961,895 367 951

Other methods of measurement

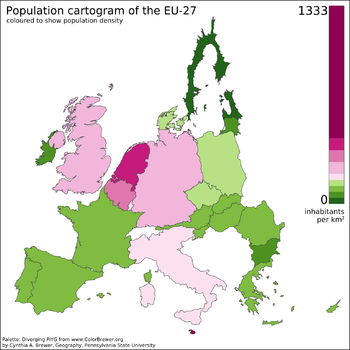
This population cartogram of the European Union (2007–2012) uses areas and colors to represent population.
 
Living population density by country

Although the arithmetic density is the most common way of measuring population density, several other methods have been developed to provide alternative measures of population density over a specific area.

  • Arithmetic density: The total number of people / area of land
  • Physiological density: The total population / area of arable land
  • Agricultural density: The total rural population / area of arable land
  • Residential density: The number of people living in an urban area / area of residential land
  • Urban density: The number of people inhabiting an urban area / total area of urban land
  • Ecological optimum: The density of population that can be supported by the natural resources
  • Living density: Population density at which the average person lives

Human–lion conflict

From Wikipedia, the free encyclopedia
 
Signage in Addo Elephant National Park reminding people of the possible threat lions pose.

Human–lion conflict refers to the pattern of problematic interactions between native people and lions. Conflict with humans is a major contributor of the decline in lion populations in Africa. Habitat loss and fragmentation due to conversion of land for agriculture has forced lions to live in closer proximity to human settlements. As a result, conflict is often characterized by lions preying upon livestock, known as livestock depredation. When depredation events take place, farmers suffer financial losses and lions face threats of retaliatory killing.

Causes of conflict

The main cause of conflict is habitat loss. 83% of the African lion's range has been reduced and what remains is increasingly fragmented. Lions, as large carnivores, rely on large connected expanses of land. The conversion of their habitat into agricultural land prevents them from dispersing and can limit the availability of natural prey. Lions are therefore roaming closer to farms than before and are at a higher risk of preying on livestock.

Ecological variables

There are many ecological variables that can affect likelihood of depredation. Factors such as farms' distance from water sources, protected areas, elevation and surrounding vegetative cover may all play a role. Some research has shown that depredation decreases with distance from protected areas. This could be because access to nearby conservation areas provides lions with a refuge when coming into contact with humans. Farms that are located close to water sources and at a low elevation may be especially vulnerable to conflict. The effect of vegetative cover remains unclear. Dense vegetative cover has been associated with a higher rate of depredation yet has also been shown to reduce depredation as it allows predators to hide from humans. Farm and livestock management can also affect chances of depredation. Corralling livestock at night as well as providing guards to monitor lion movements to prevent and deter predation can limit losses.

Financial losses

Depredation events lead to financial losses to farmers who rely on livestock as a source of income. In the North West province of South Africa, around $375, 797USD were lost as a result of game and livestock losses caused by depredation. Lions are not the only predators involved, with hyenas, leopards, and wild dogs responsible for depredation events as well. However, lions typically attack cattle which incur higher financial losses than sheep and goats (hunted by hyenas and leopards).

Compensation

In order to lessen these financial losses, some regions offer financial compensation to affected farmers. However, these programs are not always effective. Major criticisms revolve around the response times of programs, arguing that they take too long or do not happen at all. Additionally, farmers do not always receive sufficient financial restitution. For example, as of 2009, Botswana's state-funded compensation program only compensated farmers for 80% of the value they lost. It is common for farmers to not even report livestock losses due in part to dissatisfaction with response time and amount. However, the Predator Compensation Fund (PCF) in Massailand, Kenya has reduced retaliatory killings following depredation events by 73%, illustrating that when done correctly, compensation programs can be effective. Farmers who have received compensation have also reported a lower likelihood of killing a suspected lion than those who have not received any. Regardless of their efficacy, compensation programs are reactionary and not preventative, only seeking to mitigate farmers' losses after the event and do not address underlying causes of conflict.

Retaliatory killing

Retaliatory killing is the hunting of a suspected predator after a depredation event. While a threat for all predators, lions are killed disproportionately to the number of losses they are responsible for as opposed to hyenas and leopards. One reason lions are killed in retaliation more than other carnivores is because of their propensity to kill cattle more than sheep and goats. Because cattle are of more financial value to farmers than sheep and goats, the desire to retaliate can be greater. Lions also will hunt during the night when most attacks take place, are easier to track, and are more likely to defend a carcass which make them more vulnerable to being killed by humans.

Likelihood of retaliation

Social and economic differences also impact motivation to hunt lions in reaction to livestock losses. People who have lost a higher proportion of their livestock to depredation (often those with smaller farms to begin with) as well as those owning livestock for the purpose of sale as opposed to traditional or subsistence reasons have been found to report a higher willingness to retaliate. Both higher proportional losses and keeping livestock for sale increase the value of cattle and therefore increase the financial incentive to kill suspected predators. Likelihood to retaliate has also been shown to be influenced by social factors such as religion and culture

Reducing conflict

Due to the complex social, economic, and ecological aspects of human-lion conflict, it is recommended that mitigation strategies be adaptable and situation-specific. Specific actions such as providing guards to monitor predators and protect cattle, corralling livestock at night, providing compensation and restoring natural prey densities may reduce conflict in some areas. Focusing on unique conservation programs that take into account factors such as culture and religion, type of livestock owned, and reason for owning livestock may also be helpful.

Human–wildlife conflict

From Wikipedia, the free encyclopedia
 
Grand Canyon National Park hosts millions of visitors every year and is home to a population of Rocky Mountain elk. Interactions between humans and the elk sometimes result in injuries.

Human–wildlife conflict (HWC) refers to the negative interactions between human and wild animals, with undesirable consequences both for people and their resources, on the one hand, and wildlife and their habitats on the other (IUCN 2020). HWC, caused by competition for natural resources between human and wildlife, influences human food security and the well-being of both humans and animals. In many regions, the number of these conflicts has increased in recent decades as a result of human population growth and the transformation of land use.

HWC is a serious global threat to sustainable development, food security and conservation in urban and rural landscapes alike. In general, the consequences of HWC include: crop destruction, reduced agricultural productivity, competition for grazing lands and water supply, livestock predation, injury and death to human, damage to infrastructure, and increased risk of disease transmission among wildlife and livestock.

With specific reference to forests, a high density of large ungulates such as deer, can cause severe damage to the vegetation and can threaten regeneration by trampling or browsing small trees, rubbing themselves on trees or stripping tree bark. This behavior can have important economic implications and can lead to polarization between forest and wildlife managers (CPW, 2016).

Previously, conflict mitigation strategies utilized lethal control, translocation, population size regulation and endangered species preservation. Recent management now uses an interdisciplinary set of approaches to solving conflicts. These include applying scientific research, sociological studies and the arts to reducing conflicts. As human-wildlife conflict inflicts direct and indirect consequences on people and animals, its mitigation is an important priority for the management of biodiversity and protected areas. Resolving human-wildlife conflicts and fostering coexistence requires well-informed, holistic and collaborative processes that take into account underlying social, cultural and economic contexts.

Many countries are starting to explicitly include human-wildlife conflict in national policies and strategies for wildlife management, development and poverty alleviation. At the national level, cross-sectoral collaboration between forestry, wildlife, agriculture, livestock and other relevant sectors is key.

Meaning

Human–wildlife conflict is defined by the World Wide Fund for Nature (WWF) as "any interaction between humans and wildlife that results in negative impacts of human social, economic or cultural life, on the conservation of wildlife populations, or on the environment. The Creating Co-existence workshop at the 5th Annual World Parks Congress (8–17 September 2003, Montreal) defined human-wildlife conflict in the context of human goals and animal needs as follows: “Human-wildlife conflict occurs when the needs and behavior of wildlife impact negatively on the goals of humans or when the goals of humans negatively impact the needs of wildlife."

A 2007 review by the United States Geological Survey defines human-wildlife conflict in two contexts; firstly, actions by wildlife conflict with human goals i.e. life, livelihood and life-style, and secondly, human activities that threaten the safety and survival of wildlife. However, in both cases outcomes are decided by human responses to the interactions.

The Government of Yukon defines human-wildlife conflict simply, but through the lens of damage to property, i.e. "any interaction between wildlife and humans which causes harm, whether it’s to the human, the wild animal, or property." Here, property includes buildings, equipment and camps, livestock and pets, but does not include crops, fields or fences.

The IUCN SSC Human-Wildlife Conflict Task Force describes human-wildlife conflict as "struggles that emerge when the presence or behaviour of wildlife poses actual or perceived, direct and recurring threat to human interests or needs, leading to disagreements between groups of people and negative impacts on people and/or wildlife".

History

Human-wildlife interactions have occurred throughout man's prehistory and recorded history. Among the early forms of human-wildlife conflict is the depredation of the ancestors of prehistoric man by a number of predators of the Miocene such as saber-toothed cats, leopards, and spotted hyenas.

Fossil remains of early hominids show evidence of depredation; the Taung Child, the fossilized skull of a young Australopithecus africanus, is thought to have been killed by an eagle from the distinct marks on its skull and the fossil having been found among egg shells and remains of small animals.

A Plio-Pleistocene horned crocodile, Crocodylus anthropophagus, whose fossil remains have been recorded from Olduvai Gorge, was the largest predator encountered by prehistoric man, as indicated by hominid specimens preserving crocodile bite marks from these sites.

Examples

Simultaneous use of water resources by humans and crocodiles sets up occasions for human-wildlife conflict
 
Asian elephant damage to houses

Africa

As a tropical continent with substantial anthropogenic development, Africa is a hotspot for biodiversity and therefore, for human-wildlife conflict. Two of the primary examples of conflict in Africa are human-predator (lions, leopards, cheetahs, etc.) and human-elephant conflict. Depredation of livestock by African predators is well documented in Kenya, Namibia, Botswana, and more. African elephants frequently clash with humans, as their long-distance migrations often intersect with farms. The resulting damage to crops, infrastructure, and at times, people, can lead to the retaliatory killing of elephants by locals.

In 2017, more than 8 000 human-wildlife conflict incidents were reported in Namibia alone (World Bank, 2019). Hyenas killed more than 600 cattle in the Zambezi Region of Namibia between 2011 and 2016 and there were more than 4 000 incidents of crop damage, mostly caused by elephants moving through the region (NACSO, 2017a).

Asia

With a rapidly increasing human population and high biodiversity, interactions between people and wild animals are becoming more and more prevalent. Like human-predator in Africa, encounters between tigers, people, and their livestock is a prominent issue on the Asian continent. Attacks on humans and livestock have exacerbated major threats to tiger conservation such as mortality, removal of individuals from the wild, and negative perceptions of the animals from locals. Even non-predator conflicts are common, with crop-raiding by elephants and macaques persisting in both rural and urban environments, respectively. Poor disposal of hotel waste in tourism-dominated towns have altered behaviours of carnivores such as sloth bears that usually avoid human habitation and human-generated garbage.

In Sri Lanka, for example, each year as many as 80 people are killed by elephants and more than 230 elephants are killed by farmers. The Sri Lankan elephant is listed as endangered, and only 2 500–4 000 individuals remain in the wild (IIED, 2019).

In India the conflict is exceedingly acute because of the country's Wildlife Protection Act.

Antarctica

The first instance of death due to human-wildlife conflict in Antarctica occurred in 2003 when a leopard seal dragged a snorkelling British marine biologist underwater where she drowned.

Europe

Human–wildlife conflict in Europe includes interactions between people and both carnivores and herbivores. A variety of non-predators such as deer, wild boar, rodents, and starlings have been shown to damage crops and forests. Carnivores like raptors and bears create conflict with humans by eating both farmed and wild fish, while others like lynxes and wolves prey upon livestock. Even less apparent cases of human-wildlife conflict can cause substantial losses; 500,000 deer-vehicle collisions in Europe (and 1-1.5 million in North America) led to 30,000 injuries and 200 deaths.

North America

Instances of human-wildlife conflict are widespread in North America. In Wisconsin, United States wolf depredation of livestock is a prominent issue that resulted in the injury or death of 377 domestic animals over a 24-year span. Similar incidents were reported in the Greater Yellowstone ecosystem, with reports of wolves killing pets and livestock. Expanding urban centers have created increasing human-wildlife conflicts, with interactions between human and coyotes and mountain lions documented in cities in Colorado and California, respectively, among others. Big cats are a similar source of conflict in Central Mexico, where reports of livestock depredation are widespread, while interactions between humans and coyotes were observed in Canadian cities as well.

Diagram of Human Wildlife Conflict in Expanding American Cities

Oceania

On K'gari-Fraser Island in Australia, attacks by wild dingoes on humans (including the well-publicized death of a child) created a human-wildlife crisis that required scientific intervention to manage. In New Zealand, distrust and dislike of introducing predatory birds (such as the New Zealand falcon) to vineyard landscapes led to tensions between people and the surrounding wildlife. In extreme cases large birds have been reported to attack people who approach their nests, with human-magpie conflict in Australia a well-known example. Even conflict in urban environments has been documented, with development increasing the frequency of human-possum interactions in Sydney.

The Emu War is another example of oceanic human-wildlife conflict where the Australian government famously sent two soldier into south Australia to hunt and kill Emu's.

South America

As with most continents, the depredation of livestock by wild animals is a primary source of human-wildlife conflict in South America. The killings of guanacos by predators in Patagonia, Chile – which possess both economic and cultural value in the region – have created tensions between ranchers and wildlife. South America's only species of bear, the Andean Bear, faces population declines due to similar conflict with livestock owners in countries like Ecuador.

Marine ecosystems

Human–wildlife conflict is not limited to terrestrial ecosystems, but is prevalent in the world's oceans as well. As with terrestrial conflict, human-wildlife conflict in aquatic environments is incredibly diverse and extends across the globe. In Hawaii, for example, an increase in monk seals around the islands has created a conflict between locals who believe that seals “belong” and those who do not. Marine predators such as killer whales and fur seals compete with fisheries for food and resources, while others like great white sharks have a history of injuring humans. While many of the causes of human-wildlife conflict are the same between terrestrial and marine ecosystems (depredation, competition, human injury, etc.), ocean environments are less studied and management approaches often differ.  

Mitigation strategies

A traditional livestock corral surrounded by a predator-proof corral in South Gobi desert, Mongolia, to protect livestock from predators like snow leopard and wolf.

Mitigation strategies for managing human-wildlife conflict vary significantly depending on location and type of conflict. The preference is always for passive, non-intrusive prevention measures but often active intervention is required to be carried out in conjunction. Regardless of approach, the most successful solutions are those that include local communities in the planning, implementation, and maintenance. Resolving conflicts, therefore, often requires a regional plan of attack with a response tailored to the specific crisis. Still, there are a variety of management techniques that are frequently employed to mitigate conflicts. Examples include:

  • Translocation of problematic animals: Relocating so-called "problem" animals from a site of conflict to a new place is a mitigation technique used in the past, although recent research has shown that this approach can have detrimental impacts on species and is largely ineffective. Translocation can decrease survival rates and lead to extreme dispersal movements for a species, and often "problem" animals will resume conflict behaviors in their new location.
  • Erection of fences or other barriers: Building barriers around cattle bomas, creating distinct wildlife corridors, and erecting beehive fences around farms to deter elephants have all demonstrated the ability to be successful and cost-effective strategies for mitigating human-wildlife conflict.
  • Improving community education and perception of animals: Various cultures have myriad views and values associated with the natural world, and how wildlife is perceived can play a role in exacerbating or alleviating human-wildlife conflict. In one Masaai community where young men once obtained status by killing lions, conservationists worked with community leaders to shift perceptions and allow those young men to achieve the same social status by protecting lions instead.
  • Effective land use planning: altering land use practices can help mitigate conflict between humans and crop-raiding animals. For example, in Mozambique, communities started to grow more chili pepper plants after making the discovery that elephants dislike and avoid plants containing capsaicin. This creative and effective method discourages elephants from trampling community farmers' fields as well as protects the species.
  • Compensation: in some cases, governmental systems have been established to offer monetary compensation for losses sustained due to human-wildlife conflict. These systems hope to deter the need for retaliatory killings of animals, and to financially incentivize the co-existing of humans and wildlife. Compensation strategies have been employed in India, Italy, and South Africa, to name a few. The success of compensation in managing human-wildlife conflict has varied greatly due to under-compensation, a lack of local participation, or a failure by the government to provide timely payments.
  • Spatial analyses and mapping conflict hotspots: mapping interactions and creating spatial models has been successful in mitigating human-carnivore conflict and human-elephant conflict, among others. In Kenya, for example, using grid-based geographical information systems in collaboration with simple statistical analyses allowed conservationists to establish an effective predictor for human-elephant conflict.
  • Predator-deterring guard dogs: The use of guard dogs to protect livestock from depredation has been effective in mitigating human-carnivore conflict around the globe. A recent review found that 15.4% of study cases researching human-carnivore conflict used livestock-guarding dogs as a management technique, with animal losses on average 60 times lower than the norm.
  • Managing garbage and artificial feeding to prevent attraction of wildlife: Many wildlife species are attracted to garbage, especially including food wastes, leading to negative interactions with people. Poor disposal of garbage such as hotel waste is rapidly emerging as an important aspect that heightens human-carnivore conflicts in countries such as India. Urgent research to increase knowledge of the impact of easily available garbage is needed, and improving management of garbage in areas where carnivores reside is essential. Managing garbage disposal and artificial feeding of primates can also reduce conflicts and opportunities for disease transmission. One study found that prohibiting tourists from feeding Japanese macaques reduced aggressive interactions between macaques and people.
  • Use of technology: Rapid technology development (especially Information Technology) can play a vital role in the prevention of Human–wildlife conflict. Drones and mobile applications can be used to detect the movements of animals and warn highways and railways authorities to prevent collisions of animals with vehicles and trains. SMS or WhatsApp messaging systems have also been used to alert people about the presence of animals in nearby areas. Early warning wireless systems have been successfully used in undulating and flat terrain to mitigate human-elephant conflict in Tamil Nadu, India.
Livestock guardian dogs can be an effective and popular way of deterring predators and reducing human-carnivore conflicts.

Hidden dimensions of the conflict

Human wildlife conflict also has a range of hidden dimensions that are not typically considered when the focus is on visible consequences. These can include health impacts, opportunity costs, and transaction costs. Case studies include work on elephants in northeast India, where human-elephant interactions are correlated with increased imbibing of alcohol by crop guardians with resultant enhanced mortality in interactions, and issues related to gender in northern India. In addition, research has shown that the fear caused by the presence of predators can aggravate human-wildlife conflict more than the actual damage produced by encounters.
Wildland–urban interface

From Wikipedia, the free encyclopedia

The wildland–urban interface (WUI) is a zone of transition between wilderness (unoccupied land) and land developed by human activity – an area where a built environment meets or intermingles with a natural environment. Human settlements in the WUI are at a greater risk of catastrophic wildfire.

Definitions

Map of the wildland-urban interface in Catalonia featuring intermix and interface zones.

In the United States of America, the wildland-urban interface (WUI) has two definitions. The US Forest Service defines the wildland-urban interface qualitatively as a place where "humans and their development meet or intermix with wildland fuel." Communities that are within 0.5 miles (0.80 km) of the zone are included. A quantitative definition is provided by the Federal Register, which defines WUI areas as those containing at least one housing unit per 40 acres (16 ha).

The Federal Register definition splits the WUI into two categories based on vegetation density:

  • Intermix WUI, or lands that contain at least one housing unit per 40 acres (16 ha) in which vegetation occupies more than 50% of terrestrial area; a heavily vegetated intermix WUI is as an area in which vegetation occupies over 75% of terrestrial area (at least 5 km2).
  • Interface WUI, or lands that contain at least one housing unit per 40 acres (16 ha) in which vegetation occupies less than 50% of terrestrial area (at least 2.4 km2).

Growth of the WUI

Human development has increasingly encroached into the wildland-urban interface.

Malibu, California aerial view in July 2021 showing residential development deep in the mountains. Note previously burned area (darker areas) on mountains

Population shifts

The WUI was the fastest-growing land use type in the United States between 1990 and 2010. Factors include geographic population shifts, expansion of cities and suburbs into wildlands, and vegetative growth into formerly unvegetated land. The primary cause has been migration. Of new WUI areas, 97% were the result of new housing. In the United States there are population shifts towards the WUIs in the West and South; increasing nationally by 18 percent per decade, covering 6 million additional homes between 1990 and 2000 which in 2013 was 32 percent of habitable structures. Globally, WUI growth includes regions such as Argentina, France, South Africa, Australia, and regions around the Mediterranean sea. Going forward it is expected the WUI will continue to expand; an anticipated amenity-seeking migration of retiring baby-boomers to smaller communities with lower costs of living close to scenic and recreational natural resources will contribute to WUI growth. Climate change is also driving population shifts into the WUI as well as changes in wildlife composition.

Ecological effects

Housing growth in WUI regions can displace and fragment native vegetation. The introduction of non-native species by humans through landscaping can change the wildlife composition of interface regions. Pets can kill large quantities of wildlife.

Forest fragmentation is another impact of WUI growth, which can lead to unintended ecological consequences. For instance, increased forest fragmentation can lead to an increase in the prevalence of Lyme disease. White-footed mice, a primary host of the Lyme tick, thrive in fragmented habitats.

Additionally, disease vectors in isolated patches can undergo genetic differentiation, increasing their survivability as a whole.

Increases in wildfire risk pose a threat to conservation in WUI growth regions.

Ecological change driven by human influence and climate change has often resulted in more arid and fire-prone WUI. Factors include climate change driven vegetation growth and introduction of non-native plants, insects, and plant diseases.

In North America, Chile, and Australia, unnaturally high fire frequencies due to exotic annual grasses have led to the loss of native shrublands.

Fire and the WUI

Human development has increasingly encroached into the wildland-urban interface. Coupled with a recent increase in large wildland fires, this has led to an increase in fire protection costs. Between 1985-94 and 2005–14, the area burned by wildfires in the United States nearly doubled from 18,000 to 33,000 square kilometers. Wildfires in the United States exceeding 50,000 acres (20,000 ha) have steadily increased since 1983; the bulk in modern history occurred after 2003. In the United States, from 1985 to 2016, federal wildfire suppression expenditures tripled from $0.4 billion per year to $1.4 billion per year.

Wildfire risk assessment

Calculating the risk posed to a structure located within a WUI is through predictive factors and simulations. Identifying risk factors and simulation with those factors help to understand and then manage the wildfire threat.

For example, a proximity factor measures the risk of fire from wind carried embers which can ignite new spot fires over a mile ahead of a flame front. A vegetation factor measures the risk those wind carried embers have of starting a fire; lower vegetation has a lower risk.

A quantitative risk assessment simulation combines wildfire threat categories. Areas at the highest risk are those where a moderate population overlaps or is adjacent to a wildland that can support a large and intense wildfire and is vulnerable with limited evacuation routes.

Risk factors

The Calkin framework predicts a catastrophic wildfire in the Wildland-urban Interface (WUI), with three categories of factors. These factors allow for an assessment of a degree of wildfire threat. These are ecological factors that define force, human factors that define ignition, and vulnerability factors that define damage. These factors are typically viewed in a geospatial relationship.

The ecological factor category includes climate, seasonal weather patterns, geographical distributions of vegetation, historical spatial wildfire data, and geographic features. The ecological determines wildfire size and intensity.

The human factor category includes arrangement and density of housing. Density correlates with wildfire risk for two reasons. First, people cause fires; from 2001 to 2011, people caused 85% of wildfires recorded by the National Interagency Fire Center (NIFC). Second, housing intensifies wildfires because they contain flammable material and produce mobile embers, such as wood shakes. The relationship between population density and wildfire risk is non-linear. At low population densities, human ignitions are low. Ignitions increase with population density. However, there is a threshold of population density at which fire occurrence decreases. This is true for a range of environments in North America, the Mediterranean Basin, Chile, and South Africa. Possible reasons for a decrease include decreases in open space for ember transmission, fuel fragmentation due to urban development, and higher availability of fire-suppression resources. Areas with moderate population densities tend to exhibit higher wildfire risk than areas with low or high population densities.

The vulnerability factor category is measured with evacuation time through a proximity of habitable structures to roads, matching of administrators to responsibilities, land use, building standards, and landscaping types.

Risk simulations

Wildfire spread is commonly simulated with a Minimum Travel Time (MTT) algorithm.

Prior to MTT algorithms, fire boundaries were modeled through an application of Huygens' principle; boundaries are treated as wave fronts on a two-dimensional surface.

Minimum Travel Time (MTT) methods build on Huygens' principle to find a minimum time for fire to travel between two points. MTT assumes nearly-constant factors such as environmental factors for wind direction and fuel moisture. The MTT is advantageous over Huygens in scalability and algorithm speed. However, factors are dynamic and a constant representation comes at a cost of a limited window and thus MTT is only applicable to short-timescale simulations.

Risk management

Structure and vegetation flammability is reduced through community-focused risk management through reduction of community vulnerabilities. The degree of control of vulnerability to wildfires is measured with metrics for responsibilities and zones of defenses.

Reducing risk through responsibility distribution

By distributing wildfire management responsibilities, communities can mitigate risks.

The probability of catastrophic WUI wildfire is controlled by assignment of responsibility for three actionable WUI objectives: controlling potential wildfire intensity, reducing ignition sources, and reducing vulnerability. When these objectives are met, then a community is a fire-adapted community. The U.S. Forest Service defines fire-adapted communities as "a knowledgeable and engaged community in which the awareness and actions of residents regarding infrastructure, buildings, landscaping, and the surrounding ecosystem lessens the need for extensive protection actions and enables the community to safely accept fire as a part of the surrounding landscape."

Three groups are responsible for achieving the three WUI objectives, these are land management agencies, local governments, and individuals.

  • Land management agencies eliminate ignition sources by hardening infrastructure, reduce wildfire size and intensity through fuel and vegetation management, reduce vulnerability through community education on individual preparedness, and respond to wildfires with suppression.
  • Local governments control human factors through avoiding moderate density development zoning.
  • Individuals reduce vulnerability through preparedness in increasing home resistance to ignition, reducing flammability of structures, and eliminating ember generating materials.

Fire-adapted communities have been successful in interacting with wildfires.

The key benefit of fire-adapted communities is that a reliance on individuals as a core block in the responsibility framework reduces WUI expenditures by local, regional, and national governments.

Reducing risk through zone defenses

The risk of a structure to ignite in a wildfire is calculated by a Home Ignition Zone (HIZ) metric. The HIZ includes at a minimum the space within a 200 foot (61 m) radius around a structure. The HIZ is a guideline for whoever is responsible for structure wildfire protection; landlords and tenants (homeowner if they are the same) are responsible for physically constructing and maintaining defense zones while local government defines land use boundaries in a way that defense zones are effective (note: fire-resistant is arbitrary and is not defined in hours of resistance for a given degree of heat; these guidelines are relaxed for non-evergreen trees which are less flammable; this guide is not intended to prevent combustion of individual structures in a wildfire—it is intended to prevent catastrophic wildfire in the WUI):

  • Guidelines for structures:
    • Roof materials are fire-resistant and do not produce embers.
    • Exterior wall materials are fire-resistant.
    • Vents for eaves, attics, foundations, and roof are covered with wire mesh fine enough to catch embers
    • Deck and porch materials are fire-resistant.
  • Guidelines for landscaping:
    • Keep vegetation from around windows (heat will break glass).
    • Keep plants farther than 5 feet (1.5 m) from walls; this is a bare dirt no-grow zone, optional to use mowed green lawn grass and non-combustible mulch with sparse deciduous plants.
    • Keep trees from growing within 30 feet (9.1 m) of the structure.
    • Keep vegetation thinned within 100 feet (30 m) of the structure.
  • Guidelines for outdoor maintenance:
    • Prune tree limbs back 10 feet (3.0 m) from roofs.
    • Separate tree branches from power lines.
    • Clear fallen debris from roof, gutters, window wells, and under decks.
    • Prune tree branches 6 feet (1.8 m) up from the ground.
    • Burn ground of leaf litter and needles.
    • Remove and dispose of dead trees and shrubs.
  • Guidelines for flammables:
    • Keep clear of flammables 30 feet (9.1 m) around primary and auxiliary structures including firewood piles.
    • Keep clear 10 feet (3.0 m) around propane tanks or fuel oil tanks.

Challenges to risk management

There are three challenges.

  • Wildfires are an ecological process that naturally contribute to the development of ecosystems and many wildlands are historically predisposed to periodic fire; eradication of fires in WUI regions is not feasible.
  • Coordination of wildfire management efforts is difficult since wildfires are capable of spreading far distances; communities vary in wildfire risk and preparedness.
  • Actual wildfire risk and sociopolitical expectations of wildland fire management services are mismatched; real dangers are hidden by overconfidence.

An example of the Fire-adapted Communities performance was demonstrated in November 2018 when the Camp Fire passed through the community of Concow in Butte County, CA. The Concow community was a Fire-adapted community. This late season fire provided a stress test of the Fire-adapted Communities theory. The Concow community was destroyed. The wildfire continued through the community without demonstrating the expected slowing of the flame front. If there was a slowing it was less than anticipated though any slowing contributed to allowing residents to evacuate ahead of the flame front. The wildfire continued through wildlands between the community of Concow and the town of Paradise, CA. The wildfire then destroyed the town of Paradise which was in the process of developing into a fire-adapted community. The wildfire ignition is suspected to have originated with unhardened electrical transmission line infrastructure which had recently been redesigned though had not been reconstructed and the new design did not include hardening against ignition where it passed through the WUI. The Camp Fire demonstrated limitations of the fire-adapted community theory in late season wildfires driven by Katabatic winds, and in the land management agencies' responsibility in controlling infrastructure ignition sources.

Thursday, November 10, 2022

Climate classification

From Wikipedia, the free encyclopedia
https://en.wikipedia.org/wiki/Climate_classification

Map of world dividing climate zones, largely influenced by latitude. The zones, going from the equator upward (and downward) are Tropical, Dry, Moderate, Continental and Polar. There are subzones within these zones.

Climate classifications are systems that categorize the world's climates. A climate classification may correlate closely with a biome classification, as climate is a major influence on life in a region. One of the most used is the Köppen climate classification scheme first developed in 1899.

There are several ways to classify climates into similar regimes. Originally, climes were defined in Ancient Greece to describe the weather depending upon a location's latitude. Modern climate classification methods can be broadly divided into genetic methods, which focus on the causes of climate, and empiric methods, which focus on the effects of climate. Examples of genetic classification include methods based on the relative frequency of different air mass types or locations within synoptic weather disturbances. Examples of empiric classifications include climate zones defined by plant hardiness, evapotranspiration, or more generally the Köppen climate classification which was originally designed to identify the climates associated with certain biomes. A common shortcoming of these classification schemes is that they produce distinct boundaries between the zones they define, rather than the gradual transition of climate properties more common in nature.

Types of climate

Systems

Leslie Holdridge's Life Zone Classification system is essentially a climate classification scheme.

Climate classification systems include:

Bergeron and Spatial Synoptic

The simplest classification is that involving air masses. The Bergeron classification is the most widely accepted form of air mass classification. Air mass classification involves three letters. The first letter describes its moisture properties, with c used for continental air masses (dry) and m for maritime air masses (moist). The second letter describes the thermal characteristic of its source region: T for tropical, P for polar, A for Arctic or Antarctic, M for monsoon, E for equatorial, and S for superior air (dry air formed by significant downward motion in the atmosphere). The third letter is used to designate the stability of the atmosphere. If the air mass is colder than the ground below it, it is labeled k. If the air mass is warmer than the ground below it, it is labeled w. While air mass identification was originally used in weather forecasting during the 1950s, climatologists began to establish synoptic climatologies based on this idea in 1973.

Based upon the Bergeron classification scheme is the Spatial Synoptic Classification system (SSC). There are six categories within the SSC scheme: Dry Polar (similar to continental polar), Dry Moderate (similar to maritime superior), Dry Tropical (similar to continental tropical), Moist Polar (similar to maritime polar), Moist Moderate (a hybrid between maritime polar and maritime tropical), and Moist Tropical (similar to maritime tropical, maritime monsoon, or maritime equatorial).

Köppen

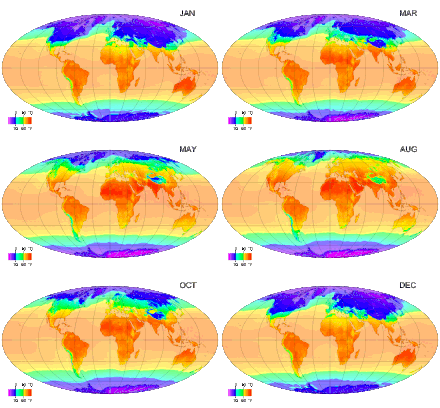
Monthly average surface temperatures from 1961 to 1990. This is an example of how climate varies with location and season
 
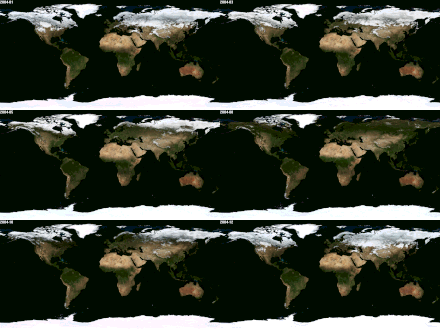
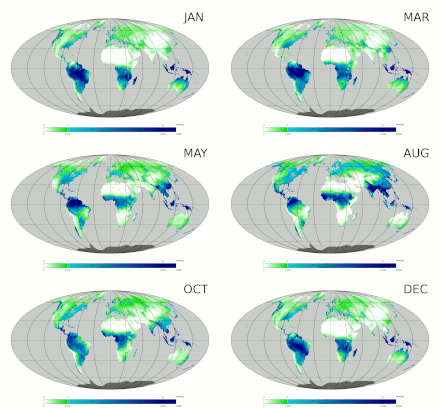
Monthly global images from NASA Earth Observatory (interactive SVG)
 

The Köppen classification depends on average monthly values of temperature and precipitation. The most commonly used form of the Köppen classification has five primary types labeled A through E. These primary types are A) tropical, B) dry, C) mild mid-latitude, D) cold mid-latitude, and E) polar.

Tropical climates are defined as locations where the coolest monthly mean temperature is above 18 C (64.4 F). This tropical zone is further broken down into rainforest, monsoon, and savanna based on seasonal rainfall. These climates are most often located between the Equator and 25 north and south latitude.

A monsoon is a seasonal prevailing wind which lasts for several months, ushering in a region's rainy season. Regions within North America, South America, Sub-Saharan Africa, Australia and East Asia are monsoon regimes.

The world's cloudy and sunny spots. NASA Earth Observatory map using data collected between July 2002 and April 2015.

A tropical savanna is a grassland biome located in semi-arid to semi-humid climate regions of subtropical and tropical latitudes, with average temperatures remaining at or above 18 °C (64 °F) all year round, and rainfall between 750 millimetres (30 in) and 1,270 millimetres (50 in) a year. They are widespread on Africa, and are found in India, the northern parts of South America, Malaysia, and Australia.

Cloud cover by month for 2014. NASA Earth Observatory

The humid subtropical climate zone where winter rainfall (and sometimes light snowfall) is associated with storms that the westerlies steer from west to east at the time of low sun (winter). In summer, high pressure dominates as the westerlies move north. Most summer rainfall occurs during thunderstorms and from occasional tropical cyclones. Humid subtropical climates lie on the east side of continents, roughly between latitudes 20° and 40° degrees away from the equator.

A humid continental climate is marked by variable weather patterns and a large seasonal temperature variance, cold and often very snowy winters, and warm summers. Places with more than three months of average daily temperatures above 10 °C (50 °F) and a coldest month temperature below −3 °C (27 °F) and which do not meet the criteria for an arid or semi-arid climate, are classified as continental. Most climates in this zone are found from 35 latitude to 55 latitude, mostly in the northern hemisphere.

An oceanic climate is typically found along west coasts in higher middle latitudes of all the world's continents, and in southeastern Australia, and is accompanied by plentiful precipitation year-round, cool summers, and small annual ranges of temperatures. Most climates of this type are found from 45 latitude to 55 latitude.

The Mediterranean climate regime resembles the climate of the lands in the Mediterranean Basin, parts of western North America, parts of Western and South Australia, in southwestern South Africa and in parts of central Chile. The climate is characterized by hot, dry summers and cool, wet winters.

A steppe is a dry grassland with an annual temperature range in the summer of up to 40 °C (104 °F) and during the winter down to −40 °C (−40 °F).

A subarctic climate has little precipitation, and monthly temperatures which are above 10 °C (50 °F) for one to three months of the year, with permafrost in large parts of the area due to the cold winters. Winters within subarctic climates usually include up to six months of temperatures averaging below 0 °C (32 °F).

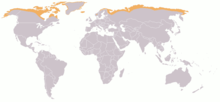
Map of arctic tundra

Tundra occurs in the far Northern Hemisphere, north of the taiga belt, including vast areas of northern Russia and Canada.

A polar ice cap, or polar ice sheet, is a high-latitude region of a planet or moon that is covered in ice. Ice caps form because high-latitude regions receive less energy as solar radiation from the sun than equatorial regions, resulting in lower surface temperatures.

A desert is a landscape form or region that receives very little precipitation. Deserts usually have a large diurnal and seasonal temperature range, with high or low, depending on location daytime temperatures (in summer up to 45 °C or 113 °F), and low nighttime temperatures (in winter down to 0 °C or 32 °F) due to extremely low humidity. Many deserts are formed by rain shadows, as mountains block the path of moisture and precipitation to the desert.

Trewartha

The Trewartha climate classification (TCC) or the Köppen–Trewartha climate classification (KTC) is a climate classification system first published by American geographer Glenn Thomas Trewartha in 1966. It is a modified version of the Köppen–Geiger system, created to answer some of its deficiencies. The Trewartha system attempts to redefine the middle latitudes to be closer to vegetation zoning and genetic climate systems. It was considered a more true or "real world" reflection of the global climate.

The Trewartha climate classification changes were seen as most effective on the large landmasses in Asia and North America, where many areas fall into a single group (C) in the Köppen–Geiger system. For example, under the standard Köppen system, Washington and Oregon are classed into the same climate zone (Csb) as parts of Southern California, even though the two regions have strikingly different weather and vegetation. Another example was classifying cities like London or Chicago in the same climate group (C) as Brisbane or New Orleans, despite great differences in seasonal temperatures and native plant life.

Scheme

Trewartha's modifications to the 1899 Köppen climate system sought to reclass the middle latitudes into three groups: C (subtropical)—8 or more months have a mean temperature of 10 °C (50 °F) or higher; D temperate—4 to 7 months have a mean temperature of 10 °C or higher; and E boreal climate—1 to 3 months have a mean temperature of 10 °C or higher. Otherwise, the tropical climates and polar climates remained the same as the original Köppen climate classification.

Thornthwaite

Precipitation by month

Devised by the American climatologist and geographer C. W. Thornthwaite, this climate classification method monitors the soil water budget using evapotranspiration. It monitors the portion of total precipitation used to nourish vegetation over a certain area. It uses indices such as a humidity index and an aridity index to determine an area's moisture regime based upon its average temperature, average rainfall, and average vegetation type. The lower the value of the index in any given area, the drier the area is.

The moisture classification includes climatic classes with descriptors such as hyperhumid, humid, subhumid, subarid, semi-arid (values of −20 to −40), and arid (values below −40). Humid regions experience more precipitation than evaporation each year, while arid regions experience greater evaporation than precipitation on an annual basis. A total of 33 percent of the Earth's landmass is considered either arid or semi-arid, including southwest North America, southwest South America, most of northern and a small part of southern Africa, southwest and portions of eastern Asia, as well as much of Australia. Studies suggest that precipitation effectiveness (PE) within the Thornthwaite moisture index is overestimated in the summer and underestimated in the winter. This index can be effectively used to determine the number of herbivore and mammal species numbers within a given area. The index is also used in studies of climate change.

Thermal classifications within the Thornthwaite scheme include microthermal, mesothermal, and megathermal regimes. A microthermal climate is one of low annual mean temperatures, generally between 0 °C (32 °F) and 14 °C (57 °F) which experiences short summers and has a potential evaporation between 14 centimetres (5.5 in) and 43 centimetres (17 in). A mesothermal climate lacks persistent heat or persistent cold, with potential evaporation between 57 centimetres (22 in) and 114 centimetres (45 in). A megathermal climate is one with persistent high temperatures and abundant rainfall, with potential annual evaporation in excess of 114 centimetres (45 in).

Year On

From Wikipedia, the free encyclopedia https://en.wikipedia.org/wiki/Year_On T...