Search This Blog

Tuesday, October 3, 2023

Geology of North America

From Wikipedia, the free encyclopedia
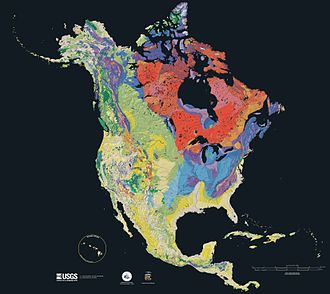
USGS Geologic Map of North America
Relief map showing the varying age of bedrock underlying North America.
This is the legend for the North American geological map above.
Geologic map of North America

The geology of North America is a subject of regional geology and covers the North American continent, the third-largest in the world. Geologic units and processes are investigated on a large scale to reach a synthesized picture of the geological development of the continent.

The divisions of regional geology are drawn in different ways, but are usually outlined by a common geologic history, geographic vicinity or political boundaries. The regional geology of North America usually encompasses the geographic regions of Alaska, Canada, Greenland, the continental United States, Mexico, Central America, and the Caribbean. The parts of the North American Plate that are not occupied by North American countries are usually not discussed as part of the regional geology. The regions that are not geographically North American but reside on the North American Plate include parts of Siberia (see the Geology of Russia), and Iceland, and Bermuda. A discussion of North American geology can also include other continental plates including the Cocos and Juan de Fuca plates being subducted beneath western North America. A portion of the Pacific Plate underlies Baja California and part of California west of the San Andreas Fault.

North American Craton

The stable core of the continent is the North American Craton. Much of it was also the core of an earlier supercontinent, Laurentia. The part of the craton where the basement rock is exposed is called the Canadian Shield. Surrounding this is a stable platform where the basement is covered by sediment; and surrounding that are a series of orogenic zones.

Canadian Shield

On a map showing only metamorphic rocks, the Canadian Shield forms a circular pattern north of the Great Lakes around Hudson Bay.

The Canadian Shield is a large area of Archean through Proterozoic igneous and metamorphic rocks in eastern Canada and north central and northeastern United States.

The earliest part of the shield is metamorphosed Archean rocks, originally volcanic in origin. Numerous terranes were accreted onto this Archean core during the Proterozoic to form the Canadian Shield. The southern Archean province is the Superior Craton, it is formed by the combination of a greenstone-granite and a gneiss terrane. The margins of the Canadian Shield have been covered by sedimentary rocks, such as in Michigan where a series of sediments has filled in the Michigan Basin. The exposed sections are often where glaciers have removed this overlying regolith to reveal the underlying glacially scarred crystalline rock.

Stable platform

The North American craton

The stable platform is an area in which the North American Craton forms a basement and is covered by sediment. This area now forms much of the Interior Plains and the slope of the Appalachians below the mountains proper. This area has been covered by a shallow inland sea, which became the site of deposition for most of the overlying sedimentary rock. The sea receded as the continent rose becoming covered by stream, lake, and wind deposits. Orogenies in the surrounding provinces have had little effect on the craton, making it an epeirogenic region, and, as such, the stable platform is mostly a crystalline basement, covered by sedimentary rocks, interrupted only by occasional domes, such as the Cincinnati Arch, Wisconsin Dome, and Ozark Dome.

Midcontinent rift system

One billion years ago, the Midcontinent Rift System began to extend along a 2,000 kilometres (1,200 mi) path, across both the Canadian Shield and the Stable Platform. The rift failed, then crustal movement reversed. A range formed then eroded, forming basins on either side of a horst. These rocks have been buried beneath sediment in many areas, but are exposed in some areas, especially around Lake Superior.

Grenville Orogen

The Grenville Orogen developed during the Proterozoic along eastern and southern margin of the North American Craton. The largest outcrop of Grenville age rocks is an approximately 400 kilometres (250 mi) wide band southeast of the Grenville Front which stretches from the central Labrador coast southwest across southern Quebec and southeastern Ontario to Georgian Bay on Lake Huron. The southeastern boundary of this area is approximately the St. Lawrence River. Rocks of the Grenville outcrop in the Adirondack Mountains of northern New York and throughout the Appalachians. The Llano Uplift of central Texas and the Franklin and Hueco Mountains of west Texas have been correlated with the Grenville as have occurrences in Mexico.

Appalachian Orogen

Map of Appalachian geological provinces

The fold and thrust belt of the Appalachians is continuously exposed for 2,000 kilometres (1,200 mi) from Pennsylvania to Alabama. In the south, it extends under the coastal plain, but is covered by Mesozoic sediments. North of this fold and thrust belt, the Acadian Orogen of the middle Devonian is an area where deformation has exposed granite plutons. The center of the range is a pair of provinces running north and south parallel to each other, the eastern Blue Ridge Province and the western Valley and Ridge provinces. These are surrounded by the Appalachian Plateau on the west, and the Piedmont Province to the east. Faulting extends throughout the region and is caused by numerous spatially and temporally varied sources.

Inliers of Late Mesoproterozoic age are present on the west of the core of the Appalachians, and these inliers are associated with the Grenville orogeny. During the Proterozoic terranes were accreted onto the province. During the Taconic orogeny 445 to 435 million years ago, accretion continued, an island arc collided with the North American continent, and mountains were raised. These mountains slowly eroded and deposited sediment into the Catskill delta, stretching from New York to Pennsylvania.

Piedmont

The eastern portion of the orogen is made up of the Piedmont plateau, a 150 to 300 metres (490 to 980 ft) elevation area composed of Paleozoic marine and volcanic sediments deformed into crystalline metamorphic rocks and intruded by granite domes.

During the Proterozoic a series of terranes were accreted onto the North American craton, forming the Piedmont of the central Appalachians. Following the Grenville orogeny, mountains eroded, and the sediments from this erosion were deposited below the mountains. The bedrock of the plateau formed about 470 million years ago during the Taconic orogeny, when a volcanic island arc collided with the ancestral North American Continent.

Passive Margin

As the Atlantic Ocean opened the Atlantic Coast turned from an active margin into a passive one. Terranes were no longer accreted onto the margin; instead, sediment eroded off the Appalachians began to be deposited on the coast, forming a coastal plain and continental shelf. During the Jurassic and Triassic, marine and other sediment was deposited to form the Atlantic coastline. The sediment has formed a clastic wedge making up most of the coastal plain and continental shelf.

The passive margin of the Gulf of Mexico is a series of sedimentary deposits from upland areas surrounding the margin. The environment of deposition for these sediments has changed, varying spatially and temporally. When the ocean level was high shallow marine deposits occurred; when they were low fluvial and deltaic deposits form the majority of mass. From the Triassic until the early Jurassic, faulting localized as extension faulting and wrench faulting. As the basement subsided, sediment accumulated, during the Mesozoic and Cenozoic, forming the modern wedge, containing salt basins.

The passive margin in eastern Mexico is made up of a series of basins. These basins are mostly igneous or metamorphic rocks covered by sediments, except in the Burgos Basin, where Cenozoic volcanism has occurred. Much of the sediment is from erosion of the thrust belts west of the margin.

The Yucatan Platform is a Cretaceous to Oligocene carbonate platform. Uplift started in the Oligocene and lasted till the Pleistocene. Today the platform is exposed and under the influence of karstification.

North American Cordillera
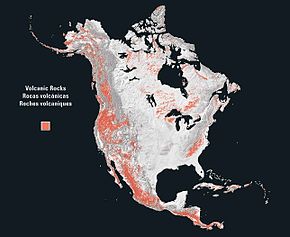
On a map showing only volcanic rocks, the west coast of North America shows a striking continuous north–south structure, the American Cordillera.

The North American Cordillera extends up and down the coast of North America and roughly from the Great Plains westward to the Pacific Ocean, narrowing somewhat from north to south. It includes the Cascades, Sierra Nevada, and Basin and Range province; the Rocky Mountains are sometimes excluded from the cordillera proper, in spite of their tectonic history. The geology of Alaska is typical of that of the cordillera.

A rupture in Rodinia 750 million years ago formed a passive margin in the eastern Pacific Northwest. The breakup of Pangea 200 million years ago began the westward movement of the North American plate, creating an active margin on the western continent. As the continent drifted West, accretion of various terranes onto the west coast occurred. As these accretions occurred, crustal shortening accompanied them during the Sevier orogeny and during the Mesozoic into the early Cenozoic, and was accompanied by faulting. During the Cenozoic, crustal extension began accompanied by magmatism that came to characterize much of the area.

Rocky Mountains

The Rocky Mountains were formed by a series of events, the last of which is the Laramide Orogeny. One of the outstanding features of the Rocky Mountains is the distance of the range from a subducting plate; this has led to the theory that the Laramide Orogeny took place when the Farallon plate subducted at a low angle, causing uplift far from the margin under which the plate subducted.

The lithology of the Rocky Mountains in western Canada includes a thin-skinned fold and thrust belt involving Neoproterozoic through Mississippian series of carbonates, shales, argillites and sandstones.

The Colorado Plateau is a stable region dating back at least 600 million years. As a relative lowland, it had been a site of deposition for sediments eroded from surrounding mountain regions. Then, during the Laramide Orogeny, the entire plateau was uplifted until about six million years ago. Erosion during and following the uplift removed sediment from the plateau. This load removal resulted in isostatic uplift and a second passive rise for the plateau.

Intermontane Province

Cedar Breaks National Monument, Utah.

Between the Rocky Mountains and the coast ranges is an area dominated by extensional forces. The extension of this region has occurred both regionally and locally in events beginning in the Jurassic; however, most extension was localized until the mid Miocene. These local events occurred in the Jurassic, late Cretaceous, and one spanning from the Eocene until the Oligocene. Regional extension occurred during the middle of the Miocene from around 20 million years ago until 10 million years ago.

The Basin and Range Province is a series of linear block fault mountains with adjacent sediment-filled downfaulted valleys, having been caused by crustal extension around 17 million years ago. The valley floors are made up of thick sediment deposits which have eroded off the mountains and filled the valleys, so that the region is a regular series of ridges spaced out by flat sediment valleys.

Coast

On the West coast of North America, the coast ranges and the coastal plain form the margin, which is partially bounded by the San Andreas Fault, a transform boundary of the Pacific Plate. Most of the land is made of terranes that have been accreted onto the margin. In the north, the insular belt is an accreted terrane, forming the margin. This belt extends from the Wrangellia Terrane in Alaska to the Chilliwack group of Canada.

The timing of the accretion of the insular belt is uncertain, although the closure did not occur until at least 115 million years ago. Other Mesozoic terranes that accreted onto the continent include the Klamath Mountains, the Sierra Nevada, and the Guerrero super-terrane of western Mexico. 80 to 90 million years ago the subducting Farallon plate split and formed the Kula Plate to the North. Many of the major batholiths date from the late Cretaceous. As the Laramide Orogeny ended around 48 million years ago, the accretion of the Siletzia terrane began in the Pacific Northwest. This began the volcanic activity in the Cascadia subduction zone, forming the modern Cascade Range, and lasted into the Miocene. As extension in the Basin and Range Province slowed by a change in North American Plate movement circa 7 to 8 Million years ago, rifting began on the Gulf of California.

Southern Cordillera

The Sierra Madre mountain ranges of Mexico are separated by the Mexican Plateau, and transected by the Trans-Mexican Volcanic Belt. The Southern extent of the American Cordillera makes up Western Mexico and northern Central America. This includes the Sierra Madre Occidental, the Sierra Madre del Sur, and the Trans-Mexican Volcanic Belt.

The Cordillera ends in the south in a belt of miogeoclines, including the Sierra Madre Oriental fold and thrust belt, the Mesa Central, and parts of the Sierra Madre del Sur. This belt also extends into Guatemala and Honduras in Central America.

1999 Oklahoma tornado outbreak

From Wikipedia, the free encyclopedia
 
1999 Oklahoma tornado outbreak
A tornado near Anadarko, Oklahoma, on May 3, 1999


DurationMay 2–8, 1999


Highest winds


Tornadoes
confirmed
152
Max. rating1F5 tornado
Duration of
tornado outbreak2
6 days, 1 hour and 35 minutes


Largest hail4.5 in (11 cm) in diameter (multiple locations on May 3)


Fatalities50 fatalities (+7 non-tornadic), 895 injuries
Damage$1.5 billion
Areas affectedCentral and Eastern United States

The 1999 Oklahoma tornado outbreak was a significant tornado outbreak that affected much of the Central and parts of the Eastern United States, with the highest record-breaking wind speeds of 301 ± 20 mph (484 ± 32 km/h). During this week-long event, 154 tornadoes touched down (including one in Canada). More than half of them were on May 3 and 4 when activity reached its peak over Oklahoma, Kansas, Nebraska, Texas, and Arkansas.

The most significant tornado first touched down southwest of Chickasha, Oklahoma, and became an F5 before dissipating near Midwest City. The tornado tore through southern and eastern parts of Oklahoma City and its suburbs of Bridge Creek, Moore, Del City, Tinker Air Force Base and Midwest City, directly killed 40 people and 45 people total, destroyed more than 8,000 homes, and caused $1 billion in damage. With a total of 72 tornadoes, it was the most prolific tornado outbreak in Oklahoma history, although not the deadliest.

Meteorological synopsis

A map of the meteorological setup of the 1999 Oklahoma tornado outbreak. The map displays surface and upper level atmospheric features associated with the outbreak.

The outbreak was caused by a vigorous upper-level trough that moved into the Central and Southern Plains states on the morning of May 3. That morning, low stratus clouds overspread much of Oklahoma, with clear skies along and west of a dry line located from Gage to Childress, Texas. Air temperatures at 7:00 a.m. Central Daylight Time ranged in the mid to upper 60s °F (upper 10s to near 20 °C) across the region, while dew point values ranged in the low to mid 60s °F (mid to upper 10s °C). The Storm Prediction Center (SPC) in Norman, Oklahoma, a division of the National Weather Service, initially issued a slight risk of severe thunderstorms early that morning stretching from the Kansas-Nebraska border to parts of southern Texas, with an intended threat of large hail, damaging winds and tornadoes.

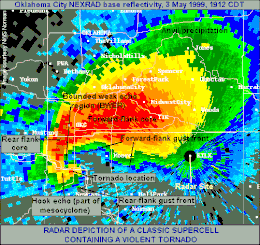
Depicts radar imagery (reflectivity) taken by the National Weather Service NEXRAD radar, KTLX, in Central Oklahoma during the May 1999 tornado outbreak. This imagery is from May 3.

By late morning, the low cloud cover began to dissipate in advance of the dry line, but during the afternoon hours high cirrus clouds overspread the region, resulting in filtered sunshine in some areas that caused atmospheric destabilization. The sunshine and heating, combined with abundant low-level moisture, combined to produce a very unstable air mass. Upper air balloon soundings observed strong directional wind shear, cooling temperatures at high atmospheric levels, and the increased potential of CAPE values potentially exceeding 4000 J/kg, levels that are considered favorable for supercells and tornadoes.

As observations and forecasts began to indicate an increasing likelihood of widespread severe weather conditions even more favorable for strong tornadoes, the SPC issued a moderate risk of severe weather at 11:15 a.m. CDT for portions of Kansas, Oklahoma and Texas along and near the Interstate 40 corridor. By 3:00 p.m. CDT, it had become evident that a widespread severe weather event was imminent; the Storm Prediction Center upgraded locations within the moderate risk area to a high risk of severe weather around 4:00 p.m. CDT as wind shear profiles, combined with volatile atmospheric conditions, had made conditions highly conducive for a significant tornadic event across most of Oklahoma, southern Kansas and north Texas, including the likelihood of violent, damaging tornadoes. The SPC issued a tornado watch by mid-afternoon as conditions gathered together for what would be a historic tornado outbreak. By the time thunderstorms began developing in the late-afternoon hours, CAPE values over the region had reached to near 6,000 J/kg. Large supercell thunderstorms developed, and in the late afternoon through the mid-evening hours of that Monday, tornadoes began to break out across the state.

Confirmed tornadoes

Confirmed tornadoes by Fujita rating
FU F0 F1 F2 F3 F4 F5 Total
0 73 44 20 10 4 1 152
  • Note: The above amount refers to the rest of the outbreak, not just the ones confirmed in Oklahoma.

Bridge Creek–Moore, Oklahoma

Bridge Creek-Moore, Oklahoma
F5 tornado
Oklahoma City NEXRAD image at 7:12 pm. The radar shows a classic hook echo at the location of the Bridge Creek/Moore tornado.


Highest winds
  • 301 ± 20 mph (484 ± 32 km/h)


Max. rating1F5 tornado


Fatalities36 fatalities (+5 indirect), 583 injuries
Damage$1 billion (1999 USD)
1Most severe tornado damage; see Fujita scale

At approximately 3:30 p.m. CDT, a severe thunderstorm began forming in Tillman County in southwestern Oklahoma; a severe thunderstorm warning was issued for this storm by the National Weather Service Weather Forecast Office in Norman at 4:15 p.m. CDT. The storm quickly developed supercell characteristics and began exhibiting potentially tornadic rotation, resulting in the National Weather Service issuing the first tornado warning of the event for Comanche, Caddo and Grady counties approximately 35 minutes later at 4:50 p.m. CDT.

The first tornado from this supercell touched down 7 miles (11 km) east-northeast of Medicine Park at 4:51 p.m. CDT; it produced four additional tornadoes as it tracked northeast into Caddo County, the strongest of which (rated as an F3) touched down 2 miles (3.2 km) west-southwest of Laverty and dissipated 2.5 miles (4.0 km) west-northwest of downtown Chickasha. This large tornado had exhibited a companion satellite tornado for a few minutes.

The storm produced the most significant tornado of the outbreak, which touched down just southwest of the Grady County community of Amber at 6:23 p.m. CDT and headed northeast, parallel to Interstate 44, just after another tornado had passed over the airport in Chickasha. The storm continued moving northeast, destroying the community of Bridge Creek and crossing I-44 just north of Newcastle. The tornado then crossed the Canadian River, passing into far southern Oklahoma City. As it passed over Bridge Creek, around 6:54 p.m., a Doppler On Wheels mobile Doppler weather radar detected wind speeds of 302 ± 22 mph (486 ± 35 km/h) inside the tornado at an elevation of 105 ft (32 m). These winds, however, occurred above the ground, and winds at the surface may not have been quite this intense. The tornado continued on into Moore, then passed over the intersection of Shields Boulevard and Interstate 35 and back into Oklahoma City, crossing Interstate 240 near Bryant Avenue. The storm then turned more northerly, striking parts of Del City and Tinker Air Force Base near Sooner Road as an F4. The storm damaged and/or destroyed several businesses, homes and churches in Midwest City. Some damage in this area was rated as high-end F4, although F5 was considered. The tornado diminished over Midwest City and finally lifted near the intersection of Reno Avenue and Woodcrest Drive.

Thirty-six people died in this tornado, and over 8,000 homes were badly damaged or destroyed. The tornado caused $1 billion in damage, making it the second-costliest tornado in U.S. history, and the most costly in history from 1999 to 2011, at which point it was surpassed by the 2011 Tuscaloosa–Birmingham tornado and again by the 2011 Joplin tornado. It was also the deadliest tornado to hit the U.S. since the April 10, 1979 F4 tornado that hit Wichita Falls, Texas, which killed 42 people.

Cimarron City–Mulhall–Perry, Oklahoma

Cimarron City–Mulhall–Perry, Oklahoma
F4 tornado


Highest winds
  • 257 mph (414 km/h)


Max. ratingF4 tornado


Fatalities2 fatalities, 26 injuries
Damage>$100,000,000

Late in the evening on May 3 at 9:25 p.m. CDT, a destructive tornado touched down 3 miles (4.8 km) southwest of Cimarron City in Logan County, Oklahoma, eventually hitting the town of Mulhall, located north of Guthrie. This wedge tornado, which tracked a 35-mile (56 km) path, was very wide and at times exceeded one mile (1.6 km) in width. According to storm chasing meteorologist Roger Edwards, it may have been as violent or more than the F5 Bridge Creek–Moore tornado (however, it was officially rated as an F4).

A Doppler On Wheels (DOW) mobile radar observed this tornado as it crossed Mulhall. The DOW documented the largest-ever-observed core flow circulation with a distance of 1,600 m (5,200 ft) between peak velocities on either side of the tornado, and a roughly 7 km (4.3 mi) width of peak wind gusts exceeding 43 m/s (96 mph), making the Mulhall tornado the largest tornado ever measured quantitatively. The DOW measured a complex multi-vortex structure, with several vortices containing winds of up to 115 m/s (260 mph) rotating around the tornado. The 3D structure of the tornado has been analyzed in a 2005 article in the Journal of the Atmospheric Sciences by Wen-Chau Lee and Joshua Wurman. The tornado severely damaged or destroyed approximately 60–70% of the 130 homes in Mulhall, destroying the Mulhall/Orlando Elementary School and toppling the city's water tower.

After the tornado dissipated at approximately 10:45 p.m. CDT in southeastern Noble County, 3 miles (4.8 km) northeast of Perry, many of the same areas of Logan County struck by the Mulhall tornado were hit again by an F3 tornado produced by a separate supercell that touched down 2.5 miles (4.0 km) south of Crescent at 10:56 p.m. CDT. Damage caused by this tornado was indistinguishable from damage caused by the earlier F4 tornado. 25 homes were destroyed and 30 others were damaged near Crescent, with much of the damage believed to have been caused by both tornadoes.

Stroud, Oklahoma

Stroud, Oklahoma
F3 tornado


Max. ratingF3 tornado


Fatalities7 injuries

At 10:10 p.m. CDT, a damaging tornado touched down 3 miles (4.8 km) north-northeast of Sparks in Lincoln County, Oklahoma, with only sporadic tree damage occurring as it tracked north-northeast toward Davenport. Scattered damage of high-end F0 to low-end F1 intensity occurred to some homes and businesses on the southeast side of Davenport, though a house located just south of town lost more than half of its roof. As the tornado continued to track northeast, parallel with Interstate 44 and State Highway 66, Stroud took a direct hit as the storm intensified to F2 strength; the trucking terminal of the Sygma food distribution warehouse on the west side of town was destroyed with some girders and siding from the warehouse thrown northwest across State Highway 66, and the Stroud Municipal Hospital suffered significant roof damage, which resulted in significant water damage within the building. The most severe damage, consistent with an F3 tornado, occurred at the Tanger Outlet Mall at 10:39 p.m. CDT with almost all of the stores suffering roof damage at minimum, though sections of seven storefronts were destroyed and the exterior walls of the Levi's store were collapsed inward. The mall was evacuated in advance of the tornado, resulting in no injuries or loss of life in the building. The tornado finally dissipated 1 mile (1.6 km) south of Stroud Lake at 10:50 p.m. CDT.

While there were no fatalities overall in Stroud, the economic impact of the tornado has been compared to the loss of Tinker Air Force Base, General Motors, and a major regional hospital for the Stroud region as compared to Oklahoma City at that time. Approximately 800 jobs were lost in a community of approximately 3,400 people due to the damage of the Sygma distribution warehouse and Tanger Outlet Mall, neither of which were rebuilt. Stroud's recovery was later complicated by the September 11, 2001, terrorist attacks, although the town has since recovered as a result of higher oil and gas prices. Local leading industries include Service King, an oilfield manufacturing facility, and Mint Turbines, a helicopter engine reconditioning facility. Stroud is also now a downloading facility location for oil produced in the northern United States into the Cushing pipeline network.

Other tornadoes

The May 3 tornado event was part of a three-day event that included tornadoes in the states of Kansas, Texas and Tennessee. A deadly F4 tornado that tracked 24 miles (39 km) across south-central Kansas killed six people in Haysville and Wichita during the late evening of May 3. Other fatalities during the event included one person killed in Texas on May 4 by an F3 tornado that tracked 71.5 miles (115.1 km) from near Winfield, Texas, to southwest of Mineral Springs, Arkansas, and three people killed in Tennessee on May 5 and 6 by an F4 tornado that struck the town of Linden.

Non-tornadic events

Flash flooding killed one person in Camden County, Missouri, on May 4. On May 6, lightning struck and killed a man in Cobbtown, Georgia.

Aftermath

Disaster assistance

Structural damage in Oklahoma

Oklahoma and
Cleveland counties
Other
counties
Homes destroyed 1,780 534
Homes damaged 6,550 878
Businesses destroyed 85 79
Businesses damaged 42 54
Public buildings destroyed 4 7
Apartments destroyed 473 568

On May 3–4, the day after the initial outbreak event, President Bill Clinton signed a federal disaster declaration for eleven Oklahoma counties. In a press statement by the Federal Emergency Management Agency (FEMA), then-director James Lee Witt stated that "The President is deeply concerned about the tragic loss of life and destruction caused by these devastating storms." The American Red Cross opened ten shelters overnight, housing 1,600 people immediately following the disaster, decreasing to 500 people by May 5. On May 5, several emergency response and damage assessment teams from FEMA were deployed to the region. The United States Department of Defense deployed the 249th Engineering Battalion and placed the U.S. Army Corps of Engineers on standby for assistance. Medical and mortuary teams were also sent by the U.S. Department of Health and Human Services. By May 6, donation centers and phone banks were being established to create funds for victims of the tornadoes. Within the first few days of the disaster declaration, relief funds were sent to families requesting aid. Roughly $180,000 had been approved by FEMA for disaster housing assistance by May 9.

Debris removal began on May 12 as seven cleanup teams were sent to the region with more teams expected to join over the following days. That day, FEMA also granted seven Oklahoma counties (Canadian, Craig, Grady, Lincoln, Logan, Noble and Oklahoma) eligibility for federal financial assistance. Roughly $1.6 million in disaster funds had been approved for housing and businesses loans by May 13, increasing to more than $5.9 million over the following five days. Applications for federal aid continued through June, with state aid approvals reaching $54 million on June 3. According to FEMA, more than 9,500 Oklahoma residents applied for federal aid during the allocated period in the wake of the tornadoes, including 3,800 in Oklahoma County and 3,757 in Cleveland County. Disaster recovery aid for the tornadoes totaled to roughly $67.8 million by July 2.

Concerns with using overpasses as storm shelters

Outbreak death toll
State Fatalities County County total
Kansas 6 Sedgwick 6
Oklahoma 40 Cleveland 11
Grady 12
Kingfisher 1
Logan 1
McClain 1
Payne 1
Pottawatomie 1
Oklahoma 12
Tennessee 3 Perry 3
Texas 1 Titus 1
Total 50
All deaths were tornado-related

From a meteorological and safety standpoint, the tornado called into question the use of highway overpasses as shelters from tornadoes. Prior to the events on May 3, 1999, videos of people taking shelter in overpasses during tornadoes in the past (such as an infamous video from the April 26, 1991 tornado outbreak taken by a news crew from Wichita NBC affiliate KSNW) created public misunderstanding and complacency that overpasses provided adequate shelter from tornadoes. Although meteorologists had questioned the safety of these structures for nearly 20 years, there had been no evidence supporting incidents involving loss of life. Three overpasses were directly struck by tornadoes during the May 3 outbreak, resulting in fatalities at each location. Two occurred as a result of the Bridge Creek–Moore F5, while the third occurred in rural Payne County, which was struck by an F2 tornado. According to a study by the National Oceanic and Atmospheric Administration, seeking shelter in an overpass "is to become a stationary target for flying debris"; the wind channeling effect that occurs within these structures along with an increase in wind speeds above ground level, changing of wind direction when the tornado vortex passes, and the fact most overpasses do not have girders for people to take shelter between also provide little to no protection.

Monday, October 2, 2023

Seawater

From Wikipedia, the free encyclopedia
Seawater off San Andrés
 
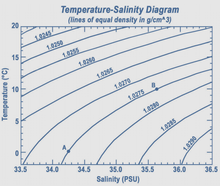
Temperature-salinity diagram of changes in density of water
 
Ocean salinity at different latitudes in the Atlantic and Pacific

Seawater, or sea water, is water from a sea or ocean. On average, seawater in the world's oceans has a salinity of about 3.5% (35 g/L, 35 ppt, 600 mM). This means that every kilogram (roughly one liter by volume) of seawater has approximately 35 grams (1.2 oz) of dissolved salts (predominantly sodium (Na+
) and chloride (Cl
) ions). The average density at the surface is 1.025 kg/L. Seawater is denser than both fresh water and pure water (density 1.0 kg/L at 4 °C (39 °F)) because the dissolved salts increase the mass by a larger proportion than the volume. The freezing point of seawater decreases as salt concentration increases. At typical salinity, it freezes at about −2 °C (28 °F). The coldest seawater still in the liquid state ever recorded was found in 2010, in a stream under an Antarctic glacier: the measured temperature was −2.6 °C (27.3 °F).

Seawater pH is typically limited to a range between 7.5 and 8.4. However, there is no universally accepted reference pH-scale for seawater and the difference between measurements based on different reference scales may be up to 0.14 units.

Properties

Salinity

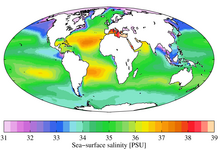
Annual mean sea surface salinity expressed in the Practical Salinity Scale for the World Ocean. Data from the World Ocean Atlas

Although the vast majority of seawater has a salinity of between 31 and 38 g/kg, that is 3.1–3.8%, seawater is not uniformly saline throughout the world. Where mixing occurs with freshwater runoff from river mouths, near melting glaciers or vast amounts of precipitation (e.g. monsoon), seawater can be substantially less saline. The most saline open sea is the Red Sea, where high rates of evaporation, low precipitation and low river run-off, and confined circulation result in unusually salty water. The salinity in isolated bodies of water can be considerably greater still – about ten times higher in the case of the Dead Sea. Historically, several salinity scales were used to approximate the absolute salinity of seawater. A popular scale was the "Practical Salinity Scale" where salinity was measured in "practical salinity units (PSU)". The current standard for salinity is the "Reference Salinity" scale with the salinity expressed in units of "g/kg".

Density

The density of surface seawater ranges from about 1020 to 1029 kg/m3, depending on the temperature and salinity. At a temperature of 25 °C, the salinity of 35 g/kg and 1 atm pressure, the density of seawater is 1023.6 kg/m3. Deep in the ocean, under high pressure, seawater can reach a density of 1050 kg/m3 or higher. The density of seawater also changes with salinity. Brines generated by seawater desalination plants can have salinities up to 120 g/kg. The density of typical seawater brine of 120 g/kg salinity at 25 °C and atmospheric pressure is 1088 kg/m3.

pH value

The pH value at the surface of oceans in pre-industrial time (before 1850) was around 8.2. Since then, it has been decreasing due to a human-caused process called ocean acidification that is related to carbon dioxide emissions: Between 1950 and 2020, the average pH of the ocean surface fell from approximately 8.15 to 8.05.

The pH value of seawater is naturally as low as 7.8 in deep ocean waters as a result of degradation of organic matter in these waters. It can be as high as 8.4 in surface waters in areas of high biological productivity.

Measurement of pH is complicated by the chemical properties of seawater, and several distinct pH scales exist in chemical oceanography. There is no universally accepted reference pH-scale for seawater and the difference between measurements based on different reference scales may be up to 0.14 units.

Chemical composition

Seawater contains more dissolved ions than all types of freshwater. However, the ratios of solutes differ dramatically. For instance, although seawater contains about 2.8 times more bicarbonate than river water, the percentage of bicarbonate in seawater as a ratio of all dissolved ions is far lower than in river water. Bicarbonate ions constitute 48% of river water solutes but only 0.14% for seawater. Differences like these are due to the varying residence times of seawater solutes; sodium and chloride have very long residence times, while calcium (vital for carbonate formation) tends to precipitate much more quickly. The most abundant dissolved ions in seawater are sodium, chloride, magnesium, sulfate and calcium. Its osmolarity is about 1000 mOsm/L.

Small amounts of other substances are found, including amino acids at concentrations of up to 2 micrograms of nitrogen atoms per liter, which are thought to have played a key role in the origin of life.

Diagram showing concentrations of various salt ions in seawater. The composition of the total salt component is: Cl
55%, Na+
30.6%, SO2−
4
7.7%, Mg2+
3.7%, Ca2+
1.2%, K+
1.1%, Other 0.7%. Note that the diagram is only correct when in units of wt/wt, not wt/vol or vol/vol.
Seawater elemental composition
(salinity = 3.5%)
Element Percent by mass
Oxygen 85.84
Hydrogen 10.82
Chlorine 1.94
Sodium 1.08
Magnesium 0.1292
Sulfur 0.091
Calcium 0.04
Potassium 0.04
Bromine 0.0067
Carbon 0.0028
Total molar composition of seawater (salinity = 35)
Component Concentration (mol/kg)
H
2
O
53.6
Cl
0.546
Na+
0.469
Mg2+
0.0528
SO2−
4
0.0282
Ca2+
0.0103
K+
0.0102
CT 0.00206
Br
0.000844
BT 0.000416
Sr2+
0.000091
F
0.000068

Microbial components

Research in 1957 by the Scripps Institution of Oceanography sampled water in both pelagic and neritic locations in the Pacific Ocean. Direct microscopic counts and cultures were used, the direct counts in some cases showing up to 10 000 times that obtained from cultures. These differences were attributed to the occurrence of bacteria in aggregates, selective effects of the culture media, and the presence of inactive cells. A marked reduction in bacterial culture numbers was noted below the thermocline, but not by direct microscopic observation. Large numbers of spirilli-like forms were seen by microscope but not under cultivation. The disparity in numbers obtained by the two methods is well known in this and other fields. In the 1990s, improved techniques of detection and identification of microbes by probing just small snippets of DNA, enabled researchers taking part in the Census of Marine Life to identify thousands of previously unknown microbes usually present only in small numbers. This revealed a far greater diversity than previously suspected, so that a litre of seawater may hold more than 20,000 species. Mitchell Sogin from the Marine Biological Laboratory feels that "the number of different kinds of bacteria in the oceans could eclipse five to 10 million."

Bacteria are found at all depths in the water column, as well as in the sediments, some being aerobic, others anaerobic. Most are free-swimming, but some exist as symbionts within other organisms – examples of these being bioluminescent bacteria. Cyanobacteria played an important role in the evolution of ocean processes, enabling the development of stromatolites and oxygen in the atmosphere.

Some bacteria interact with diatoms, and form a critical link in the cycling of silicon in the ocean. One anaerobic species, Thiomargarita namibiensis, plays an important part in the breakdown of hydrogen sulfide eruptions from diatomaceous sediments off the Namibian coast, and generated by high rates of phytoplankton growth in the Benguela Current upwelling zone, eventually falling to the seafloor.

Bacteria-like Archaea surprised marine microbiologists by their survival and thriving in extreme environments, such as the hydrothermal vents on the ocean floor. Alkalotolerant marine bacteria such as Pseudomonas and Vibrio spp. survive in a pH range of 7.3 to 10.6, while some species will grow only at pH 10 to 10.6. Archaea also exist in pelagic waters and may constitute as much as half the ocean's biomass, clearly playing an important part in oceanic processes. In 2000 sediments from the ocean floor revealed a species of Archaea that breaks down methane, an important greenhouse gas and a major contributor to atmospheric warming. Some bacteria break down the rocks of the sea floor, influencing seawater chemistry. Oil spills, and runoff containing human sewage and chemical pollutants have a marked effect on microbial life in the vicinity, as well as harbouring pathogens and toxins affecting all forms of marine life. The protist dinoflagellates may at certain times undergo population explosions called blooms or red tides, often after human-caused pollution. The process may produce metabolites known as biotoxins, which move along the ocean food chain, tainting higher-order animal consumers.

Pandoravirus salinus, a species of very large virus, with a genome much larger than that of any other virus species, was discovered in 2013. Like the other very large viruses Mimivirus and Megavirus, Pandoravirus infects amoebas, but its genome, containing 1.9 to 2.5 megabases of DNA, is twice as large as that of Megavirus, and it differs greatly from the other large viruses in appearance and in genome structure.

In 2013 researchers from Aberdeen University announced that they were starting a hunt for undiscovered chemicals in organisms that have evolved in deep sea trenches, hoping to find "the next generation" of antibiotics, anticipating an "antibiotic apocalypse" with a dearth of new infection-fighting drugs. The EU-funded research will start in the Atacama Trench and then move on to search trenches off New Zealand and Antarctica.

The ocean has a long history of human waste disposal on the assumption that its vast size makes it capable of absorbing and diluting all noxious material. While this may be true on a small scale, the large amounts of sewage routinely dumped has damaged many coastal ecosystems, and rendered them life-threatening. Pathogenic viruses and bacteria occur in such waters, such as Escherichia coli, Vibrio cholerae the cause of cholera, hepatitis A, hepatitis E and polio, along with protozoans causing giardiasis and cryptosporidiosis. These pathogens are routinely present in the ballast water of large vessels, and are widely spread when the ballast is discharged.

Other parameters

The speed of sound in seawater is about 1,500 m/s (whereas the speed of sound is usually around 330 m/s in air at roughly 101.3 kPa pressure, 1 atmosphere), and varies with water temperature, salinity, and pressure. The thermal conductivity of seawater is 0.6 W/mK at 25 °C and a salinity of 35 g/kg. The thermal conductivity decreases with increasing salinity and increases with increasing temperature.

Origin and history

The water in the sea was thought to come from the Earth's volcanoes, starting 4 billion years ago, released by degassing from molten rock. More recent work suggests much of the Earth's water may come from comets.

Scientific theories behind the origins of sea salt started with Sir Edmond Halley in 1715, who proposed that salt and other minerals were carried into the sea by rivers after rainfall washed it out of the ground. Upon reaching the ocean, these salts concentrated as more salt arrived over time (see Hydrologic cycle). Halley noted that most lakes that don't have ocean outlets (such as the Dead Sea and the Caspian Sea, see endorheic basin), have high salt content. Halley termed this process "continental weathering".

Halley's theory was partly correct. In addition, sodium leached out of the ocean floor when the ocean formed. The presence of salt's other dominant ion, chloride, results from outgassing of chloride (as hydrochloric acid) with other gases from Earth's interior via volcanos and hydrothermal vents. The sodium and chloride ions subsequently became the most abundant constituents of sea salt.

Ocean salinity has been stable for billions of years, most likely as a consequence of a chemical/tectonic system which removes as much salt as is deposited; for instance, sodium and chloride sinks include evaporite deposits, pore-water burial, and reactions with seafloor basalts.

Human impacts

Climate change, rising levels of carbon dioxide in Earth's atmosphere, excess nutrients, and pollution in many forms are altering global oceanic geochemistry. Rates of change for some aspects greatly exceed those in the historical and recent geological record. Major trends include an increasing acidity, reduced subsurface oxygen in both near-shore and pelagic waters, rising coastal nitrogen levels, and widespread increases in mercury and persistent organic pollutants. Most of these perturbations are tied either directly or indirectly to human fossil fuel combustion, fertilizer, and industrial activity. Concentrations are projected to grow in coming decades, with negative impacts on ocean biota and other marine resources.

One of the most striking features of this is ocean acidification, resulting from increased CO2 uptake of the oceans related to higher atmospheric concentration of CO2 and higher temperatures, because it severely affects coral reefs, mollusks, echinoderms and crustaceans (see coral bleaching).

Human consumption

Accidentally consuming small quantities of clean seawater is not harmful, especially if the seawater is taken along with a larger quantity of fresh water. However, drinking seawater to maintain hydration is counterproductive; more water must be excreted to eliminate the salt (via urine) than the amount of water obtained from the seawater itself. In normal circumstances, it would be considered ill-advised to consume large amounts of unfiltered seawater.

The renal system actively regulates the levels of sodium and chloride in the blood within a very narrow range around 9 g/L (0.9% by mass).

In most open waters concentrations vary somewhat around typical values of about 3.5%, far higher than the body can tolerate and most beyond what the kidney can process. A point frequently overlooked in claims that the kidney can excrete NaCl in Baltic concentrations of 2% (in arguments to the contrary) is that the gut cannot absorb water at such concentrations, so that there is no benefit in drinking such water. The salinity of Baltic surface water, however, is never 2%. It is 0.9% or less, and thus never higher than that of bodily fluids. Drinking seawater temporarily increases blood's NaCl concentration. This signals the kidney to excrete sodium, but seawater's sodium concentration is above the kidney's maximum concentrating ability. Eventually the blood's sodium concentration rises to toxic levels, removing water from cells and interfering with nerve conduction, ultimately producing fatal seizure and cardiac arrhythmia.

Survival manuals consistently advise against drinking seawater. A summary of 163 life raft voyages estimated the risk of death at 39% for those who drank seawater, compared to 3% for those who did not. The effect of seawater intake on rats confirmed the negative effects of drinking seawater when dehydrated.

The temptation to drink seawater was greatest for sailors who had expended their supply of fresh water and were unable to capture enough rainwater for drinking. This frustration was described famously by a line from Samuel Taylor Coleridge's The Rime of the Ancient Mariner:

Water, water, everywhere,
And all the boards did shrink;
Water, water, everywhere,
Nor any drop to drink.

Although humans cannot survive on seawater, some people claim that up to two cups a day, mixed with fresh water in a 2:3 ratio, produces no ill effect. The French physician Alain Bombard survived an ocean crossing in a small Zodiak rubber boat using mainly raw fish meat, which contains about 40% water (like most living tissues), as well as small amounts of seawater and other provisions harvested from the ocean. His findings were challenged, but an alternative explanation was not given. In his 1948 book The Kon-Tiki Expedition, Thor Heyerdahl reported drinking seawater mixed with fresh in a 2:3 ratio during the 1947 expedition. A few years later, another adventurer, William Willis, claimed to have drunk two cups of seawater and one cup of fresh per day for 70 days without ill effect when he lost part of his water supply.

During the 18th century, Richard Russell advocated the medical use of this practice in the UK, and René Quinton expanded the advocation of this practice to other countries, notably France, in the 20th century. Currently, it is widely practiced in Nicaragua and other countries, supposedly taking advantage of the latest medical discoveries.

Most oceangoing vessels desalinate potable water from seawater using processes such as vacuum distillation or multi-stage flash distillation in an evaporator, or, more recently, reverse osmosis. These energy-intensive processes were not usually available during the Age of Sail. Larger sailing warships with large crews, such as Nelson's HMS Victory, were fitted with distilling apparatus in their galleys. Animals such as fish, whales, sea turtles, and seabirds, such as penguins and albatrosses, have adapted to living in a high-saline habitat. For example, sea turtles and saltwater crocodiles remove excess salt from their bodies through their tear ducts.

Mineral extraction

Minerals have been extracted from seawater since ancient times. Currently the four most concentrated metals – Na, Mg, Ca and K – are commercially extracted from seawater. During 2015 in the US 63% of magnesium production came from seawater and brines. Bromine is also produced from seawater in China and Japan. Lithium extraction from seawater was tried in the 1970s, but the tests were soon abandoned. The idea of extracting uranium from seawater has been considered at least from the 1960s, but only a few grams of uranium were extracted in Japan in the late 1990s. The main issue is not one of technological feasibility but that current prices on the uranium market for uranium from other sources are about three to five times lower than the lowest price achieved by seawater extraction. Similar issues hamper the use of reprocessed uranium and are often brought forth against nuclear reprocessing and the manufacturing of MOX fuel as economically unviable.

Standard

ASTM International has an international standard for artificial seawater: ASTM D1141-98 (Original Standard ASTM D1141-52). It is used in many research testing labs as a reproducible solution for seawater such as tests on corrosion, oil contamination, and detergency evaluation.

Equality (mathematics)

From Wikipedia, the free encyclopedia https://en.wikipedia.org/wiki/Equality_...