Search This Blog

Tuesday, December 26, 2023

United States rainfall climatology

Average precipitation

The characteristics of United States rainfall climatology differ significantly across the United States and those under United States sovereignty. Summer and early fall bring brief, but frequent thundershowers and tropical cyclones which create a wet summer and drier winter in the eastern Gulf and lower East Coast. During the winter, and spring, Pacific storm systems bring Hawaii and the western United States most of their precipitation. Low pressure systems moving up the East Coast and through the Great Lakes, bring cold season precipitation to from the Midwest to New England, as well as Great Salt Lake. The snow to liquid ratio across the contiguous United States averages 13:1, meaning 13 inches (330 mm) of snow melts down to 1 inch (25 mm) of water.

During the summer, the North American monsoon combined with Gulf of California and Gulf of Mexico moisture moving around the subtropical ridge in the Atlantic Ocean bring the promise of afternoon and evening air-mass thunderstorms to the southern tier of the country as well as the Great Plains. Equatorward of the subtropical ridge, tropical cyclones enhance precipitation across southern and eastern sections of the country, as well as Puerto Rico, the United States Virgin Islands, the Northern Mariana Islands, Guam, and American Samoa. Over the top of the ridge, the jet stream brings a summer precipitation maximum to the Great Plains and western Great Lakes. Large thunderstorm areas known as mesoscale convective complexes move through the Plains, Midwest, and Great Lakes during the warm season, contributing up to 10% of the annual precipitation to the region.

The El Niño–Southern Oscillation affects the precipitation distribution, by altering rainfall patterns across the West, Midwest, the Southeast, and throughout the tropics. There is also evidence that global warming is leading to increased precipitation to the eastern portions of North America, while droughts are becoming more frequent in the western portions. Furthermore, global La Niña meteorological events are generally associated with drier and hotter conditions and further exacerbation of droughts in California and the Southwestern and to some extent the Southeastern United States. Meteorological scientists have observed that La Niñas have become more frequent over time.

General
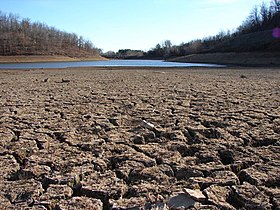
A typical dry lakebed is seen in California, which is experiencing its worst megadrought in 1,200 years, precipitated by climate change, and is therefore water rationing.

The eastern part of the contiguous United States east of the 98th meridian, the mountains of the Pacific Northwest, the Willamette Valley, and the Sierra Nevada range are the wetter portions of the nation, with average rainfall exceeding 30 inches (760 mm) per year. The drier areas are the Desert Southwest, Great Basin, valleys of northeast Arizona, eastern Utah, and central Wyoming. Increased warming within urban heat islands leads to an increase in rainfall downwind of cities.

Alaska

Juneau averages over 50 inches (1,270 mm) of precipitation a year, while other areas in southeast Alaska receive over 275 inches (6,980 mm). South central Alaska does not get nearly as much rain as the southeast of Alaska, though it does get more snow. On average, Anchorage receives 16 inches (406 mm) of precipitation a year, with around 75 inches (1,905 mm) of snow. The northern coast of the Gulf of Alaska receives up to 150 inches (3,800 mm) of precipitation annually. Across western sections of the state, the northern side of the Seward Peninsula is a desert with less than 10 inches (250 mm) of precipitation annually, while some locations between Dillingham and Bethel average around 100 inches (2,540 mm) of precipitation. Inland, often less than 10 inches (250 mm) falls a year, but what precipitation falls during the winter tends to stay throughout the season. La Niña events lead to drier than normal conditions, while El Niño events do not have a correlation towards dry or wet conditions. Precipitation increases by 10 to 40 percent when the Pacific decadal oscillation is positive.

West

Impact of El Niño and La Niña on North America

From September through May, extratropical cyclones from the Pacific Ocean move inland into the region due to a southward migration of the jet stream during the cold season. This shift in the jet stream brings much of the annual precipitation to the region, and also brings the potential for heavy rain events. The West Coast occasionally experiences ocean-effect showers, usually in the form of rain at lower elevations south of the mouth of the Columbia River. These occur whenever an Arctic air mass from western Canada is drawn westward out over the Pacific Ocean, typically by way of the Fraser Valley, returning shoreward around a center of low pressure. Strong onshore flow is brought into the mountain ranges of the west, focusing significant precipitation into the Rocky Mountains, with rain shadows occurring in the Harney Basin, Great Basin, the central valley of California, and the lower Colorado River valley. In general, rainfall amounts are lower on the southern portions of the West coast. The biggest recipients of the precipitation are the coastal ranges such as the Olympic Mountains, the Cascades, and the Sierra Nevada range. Lesser amounts fall upon the Continental Divide. Cold-season precipitation into this region is the main supply of water to area rivers, such as the Colorado River and Rio Grande, and also acts as the main source of water to people living in this portion of the United States. During El Niño events, increased precipitation is expected in California due to a more southerly, zonal, storm track. California also enters a wet pattern when thunderstorm activity within the tropics associated with the Madden–Julian oscillation nears 150E longitude. During La Niña, increased precipitation is diverted into the Pacific Northwest due to a more northerly storm track.

Lake-effect snow off Great Salt Lake

The southern and southeastern sides of the Great Salt Lake receive significant lake-effect snow. Since the Great Salt Lake never freezes, the lake-effect can affect the weather along the Wasatch Front year round. The lake-effect largely contributes to the 55 inches (140 cm) to 80 inches (200 cm) annual snowfall amounts recorded south and east of the lake, with average snowfall amounts exceeding 600 inches (1,500 cm) in the Wasatch Mountains. The snow, which is often very light and dry due to the desert climate, is referred to as "The Greatest Snow on Earth" in the mountains. Lake-effect snow contributes to approximately 6-8 snowfalls per year in Salt Lake City, with approximately 10% of the city's precipitation being contributed by the phenomenon.

North American Monsoon
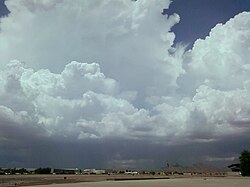
Arizona monsoon season clouds

The North American Monsoon (NAM) occurs from late June or early July into September, originating over Mexico and spreading into the southwest United States by mid-July. This allows the wet season to start in the Southwest during the summer rather than early fall as seen across the remainder of the West. Within the United States, it affects Arizona, New Mexico, Nevada, Utah, Colorado, West Texas, and California. The North American monsoon is known to many as the Summer, Southwest, Mexican or Arizona monsoon. It is also sometimes called the Desert Monsoon as a large part of the affected area is desert.

When precipitable water values near 1.32 inches (34 mm), brief but often torrential thunderstorms and the hurricane force winds and hail can occur, especially over mountainous terrain. This activity is occasionally enhanced by the passage of retrograding (westward-moving) upper cyclones moving under the subtropical ridge and the entrainment of the remnants of tropical storms. Tropical cyclones from the eastern Pacific contribute to the moisture within the monsoon system, and bring up to 20 percent of the average annual rainfall to southern California. Flash flooding is a serious danger during the monsoon season. Dry washes can become raging rivers in an instant, even when no storms are visible as a storm can cause a flash flood tens of miles away. Lightning strikes are also a significant danger. Because it is dangerous to be caught in the open when these storms suddenly appear, many golf courses in Arizona have thunderstorm warning systems.

As much as 45% of the annual rainfall across New Mexico occurs during the summer monsoon. Many desert plants are adapted to take advantage of this brief wet season. Because of the monsoons, the Sonoran and Mojave are considered relatively "wet" when ranked among other deserts such as the Sahara. Monsoons play a vital role in managing wildfire threat by providing moisture at higher elevations and feeding desert streams. Heavy monsoon rain can lead to excess winter plant growth, in turn a summer wildfire risk. A lack of monsoon rain can hamper summer seeding, reducing excess winter plant growth but worsening drought.

Thunderstorms during the North American Monsoon as seen from El Cajon, California. The thunderstorms rarely push beyond the Peninsular Ranges to the clear skies of the coastal strip.

Great Plains

Downslope winds off the Rocky Mountains can aid in forming the dry line. Major drought episodes in the midwestern United States are associated with an amplification of the upper tropospheric subtropical (or monsoon) ridge across the West and Plains, along with a weakening of the western edge of the "Bermuda high". During the summer, a southerly low-level jet draws moisture from the Gulf of Mexico. Additional moisture comes from more local sources, especially transpiring vegetation. Maximum precipitation generally occurs in late spring and early summer, with minimum precipitation in winter. During La Niña events, the storm track shifts far enough northward to bring wetter than normal conditions (in the form of increased snowfall) to the Midwestern states, as well as hot and dry summers.

The convective season for the Plains ranges between May and September. Organized systems of thunderstorms known as mesoscale convective systems develop over the region during this period, with a bulk of the activity occurring between midnight and 6 a.m. local time. The time of maximum precipitation during the day gradually varies from late afternoon near the slopes of the Rockies to early morning near the Ohio River valley, in part reflecting the west-to-east propagation of mesoscale convective systems. Mesoscale convective systems bring 30 to 70 percent of the annual warm season rainfall to the Plains. An especially long-lived and well-organized type of mesoscale convective system called a mesoscale convective complex produces on average 8% to 18% of the annual warm season rainfall across the Plains and Midwest. Squall lines account for 30% of the large thunderstorm complexes which move through the region.

Gulf Coast and lower Atlantic Coast south of New England

In general, northern and western portions of this region have a winter/spring maximum in precipitation with late summer/early fall being drier, while southern and eastern portions have a summer maximum and winter/early spring minimum in precipitation.

Most locations on the East Coast from Boston northward show a slight winter maximum as winter storms drop heavy precipitation. South of Boston, convective storms are common in the hot summer months and seasonal rainfall shows a slight summer maximum (though not at all stations). As one moves from Virginia Beach southward, summer becomes the wettest season, as convective thunderstorms created in the hot and moist tropical air mass drop brief but intense precipitation. In winter these areas still sees precipitation as low pressure systems moving across the southern United States often tap moisture from the Gulf of Mexico and drop cold season precipitation from eastern Texas to the New York area.

On the Florida peninsula, a strong monsoon becomes dominant, with dry winters and heavy summer rainfall. In winter the strong subtropical ridge creates the stable air over Florida with little convection and few fronts. Along the Gulf Coast, and the south Atlantic states, decaying tropical systems added to summers peak rainfall.

Cold season

The subtropical jet stream brings in upper level moisture from the Pacific Ocean during the cold season. Ahead of storm systems, significant moisture becomes drawn in from the Gulf of Mexico, which increases moisture within the atmospheric column and leads to precipitation ahead of extratropical cyclones. During the El Niño portion of ENSO, increased precipitation falls along the Gulf coast and Southeast due to a stronger than normal, and more southerly, polar jet stream. In the area around Memphis, Tennessee and across the state of Mississippi, there are two rainfall maxima in the winter and spring. Across Georgia and South Carolina, the first of the annual precipitation maxima occurs in late winter, during February or March. Alabama has an annual rainfall maximum in winter or spring and a dry summer.

Warm season

U.S. tropical cyclone rainfall maxima per state

During the summer, the subtropical ridge in the Atlantic Ocean strengthens, bringing in increasingly humid air from the warm Atlantic, Caribbean, and Gulf of Mexico. Once precipitable water values exceed 1.25 inches (32 mm), afternoon and evening thunderstorms break out at the western periphery of the subtropical ridge across the Southeast on a daily basis. Summer is the time of the second rainfall maximum during the year across Georgia, and the time of the main rainfall maximum in Florida. During the late summer and fall, tropical cyclones move into the region from the Atlantic and Gulf of Mexico, supplying portions of the area with one-quarter of their annual rainfall, on average. Fall is the time of the rainfall minimum across Louisiana. Sometimes, Gulf moisture sneaks up the Front Range of Rockies as far north as the northern High Plains, bringing higher dewpoint air into states such as Wyoming and Montana.

Great Lakes

Overall, late spring and early summer is the wettest time of year for the western portion of the region, with a winter minimum in precipitation. This is due to warm, moist, and unstable air moving along the jet stream where it is centralized. Which brings precipitation along the westerlies. In contrast, eastern portions of the regions have two precipitation maximums, one during spring, and again in November. While July and August are the driest months in the region. The reason being that this region is further away from the unstable air of the central U.S and has more moderators to the climate. Due to the fact that storms and winds generally move west to east, the winds that blow from the Great Lakes during the summer keep the area more stable. With thunderstorms generally being less common.

Cold season

A linear single band lake effect snowsquall

Extratropical cyclones can bring moderate to heavy snowfall during the cold season. On the backside of these systems, particularly those moving through the eastern United States, lake effect snowfall is possible. Low level cold in the winter sweeping in from Canada combine with relatively warmer, unfrozen lakes to produce dramatic lake-effect snow on the eastern and southern shores of the Great Lakes. Lake-effect precipitation produces a significant difference between the snowfall around the Great Lakes, sometimes within small distances. Lake effect snowfall accounts for 30 to 60 percent of the annual snowfall near the coasts of the Great Lakes. Lake Erie has the distinction of being the only great lake capable of completely freezing over during the winter due to its relative shallowness. Once frozen, the resulting ice cover alleviates lake-effect snow downwind of the lake. The influence of the Great Lakes allows the region to lie within a Humid Continental Climate regime. Although certain scientists have argued that the eastern third resemble more of an oceanic climate

Warm season
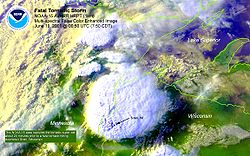
Satellite view of a supercell near the Great Lakes

Weather systems in the westerlies that cause precipitation move along jet stream, which migrates north into the region by summer. This also increases the likelihood for severe weather to develop due to stronger upper-level divergence in its vicinity. Mesoscale convective complexes move into the region from the Plains from late April through mid-July, with June the peak month for the western portions of the Great Lakes. These systems contribute about 2% of the annual precipitation for the region. Also, remnants of tropical cyclones occasionally move northward into the region, though their overall contribution to precipitation across the region is minimal. From the spring through the summer, areas near the shores of the relatively cooler Great Lakes develop sea breezes, which lowers rainfall amounts and increases sunshine near the immediate coastline. The eastern Great Lakes are significantly drier during the summer.

Northeast

Satellite image of the intense nor'easter responsible for the North American blizzard of 2006.

Average precipitation across the region show maxima along the coastal plain and along the mountains of the Appalachians. Between 28 inches (710 mm) and 62 inches (1,600 mm) of precipitation falls annually across the area. Seasonally, there are slight changes to precipitation distribution through the year. For example, Burlington, Vermont has a summer maximum and a winter minimum. In contrast, Portland, Maine has a fall and winter maximum, with a summer minimum in precipitation. Temporally, a maximum in precipitation is seen around three peak times: 3 a.m., 10 a.m., and 6 p.m. During the summer, the 6 p.m. peak is most pronounced.

Cold season

Coastal extratropical cyclones, known as nor'easters, bring a bulk of the wintry precipitation to the region during the cold season as they track parallel to the coastline, forming along the natural temperature gradient of the Gulf stream before moving up the coastline. The Appalachian Mountains largely shield New York City and Philadelphia from picking up any lake-effect snow, though ocean-effect snows are possible near Cape Cod. The Finger Lakes of New York are long enough for lake-effect precipitation. Lake-effect snow from the Finger Lakes occurs in upstate New York until those lakes freeze over. Bay-effect snows fall downwind of Delaware Bay, Chesapeake Bay, and Massachusetts Bay when the basic criteria are met. Ocean effect snows are possible downwind of the Gulf Stream across the Southeast.

Warm season

During the summer and early fall, mesoscale convective systems can move into the area from Canada and the Great Lakes. Tropical cyclones and their remains occasionally move into the region from the south and southwest. Recently, the region has experienced a couple heavy rainfall events that exceeded the 50-year return period, during October 1996 and October 1998, which suggest an increase in heavy rainfall along the coast.

Pacific islands

Hawaii

Systems such as this Kona low from November 4, 1995 bring Hawaii much of their annual rainfall

Snow, although not usually associated with tropics, falls at higher elevations on the Big Island, on Mauna Loa as well as Mauna Kea, which reaches an altitude of 13,796 feet (4,205 m), in some winter months. Snow only rarely falls on Maui's Haleakala. Mount Waiʻaleʻale (Waiʻaleʻale), on the island of Kauai, is notable for its extreme rainfall, as it has the second highest average annual rainfall on Earth, with 460 inches (12,000 mm). Storm systems affect the state with heavy rains between October and March. Showers are common across the island chain, but thunderstorms are relatively rare. Local climates vary considerably on each island due to their topography, divisible into windward (Koʻolau) and leeward (Kona) regions based upon location relative to the higher mountains. The Kona coast is the only area in Hawaii with a summer precipitation maximum. Windward sides face the east to northeast trade winds and receive much more rainfall; leeward sides are drier and sunnier, with less rain and less cloud cover. In the late winter and spring during El Niño events, drier than average conditions can be expected in Hawaii.

Northern Marianas

The islands have a tropical marine climate moderated by seasonal northeast trade winds. There is a dry season which stretches from December to June, and a rainy season from July to November. Saipan's average annual precipitation is 82.36 inches (2,092 mm), with 67 percent falling during the rainy season. Typhoons frequent the island chain, which can lead to excessive rainfall.

Guam

Typhoons, such as Pongsona (2002), can bring excessive rainfall to Guam

Guam's climate is moderated by east to northeast trade winds through the year. The average annual rainfall for the island is 86 inches (2,200 mm). There is a distinct dry season from January to June, and a rainy season from July to December. Typhoons frequent the island, which can lead to excessive rainfall. During El Niño years, dry season precipitation averages below normal. However, the threat of a tropical cyclone is over triple what is normal during El Niño years, so extreme shorter duration rainfall events are possible.

American Samoa

American Samoa's climate regime is dominated by southeast trade winds. The island dependency is wet, with annual rainfall averaging near 120 inches (3,000 mm) at the airport, with amounts closer to 200 inches (5,100 mm) in other areas. There is a distinct rainy season when tropical cyclones occasionally visit between November and April. The dry season lasts from May to October. During El Niño events, precipitation averages about 10 percent above normal, while La Niña events lead to precipitation amounts which average close to 10 percent below normal.

Pago Pago harbor in American Samoa has the highest annual rainfall of any harbor in the world. This is due to the nearby Rainmaker Mountain.

Atlantic islands

Puerto Rico

There is a pronounced rainy season from April to November across the commonwealth, encompassing the annual hurricane season. Due to the Commonwealth's topography, rainfall varies greatly across the archipelago. Pico del Este averages 171.09 inches (4,346 mm) of rainfall yearly while Magueyes Island averages only 29.32 inches (745 mm) a year. Despite known changes in tropical cyclone activity due to changes in the El Niño/Southern Oscillation (ENSO), there is no known relationship between rainfall in Puerto Rico and the ENSO cycle. However, when values of the North Atlantic oscillation are high during the winter, precipitation is lower than average for Puerto Rico. There have not been any documented cases of snow falling within Puerto Rico, though occasionally it is brought in from elsewhere as a publicity stunt.

United States Virgin Islands

The climate of the United States Virgin Islands has sustained easterly trade winds through the year. There is a rainy season which lasts from September to November, when hurricanes are more prone to visit the island chain. The average rainfall through the island chain ranges from 51.55 inches (1,309 mm) at Annually to 37.79 inches (960 mm) at East Hill.

Changes due to global warming
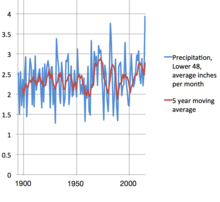
US precipitation trends (lower 48), 1895–2014. Raw data:

Increasing temperatures tend to increase evaporation which leads to more precipitation. As average global temperatures have risen, average global precipitation has also increased. Precipitation has generally increased over land north of 30°N from 1900 to 2005, but declined over the tropics since the 1970s. Eastern portions of North America have become wetter. There has been an increase in the number of heavy precipitation events over many areas during the past century, as well as an increase since the 1970s in the prevalence of droughts—especially in the tropics and subtropics. Over the contiguous United States, total annual precipitation increased at an average rate of 6.1 percent per century since 1900, with the greatest increases within the East North Central climate region (11.6 percent per century) and the South (11.1 percent). Hawaii was the only region to show a decrease (−9.25 percent). From this excess precipitation, crop losses are expected to increase by US$3 billion (2002 dollars) annually over the next 30 years.

Monday, December 25, 2023

El Niño–Southern Oscillation

Southern Oscillation Index timeseries from 1876 to 2023. The Southern Oscillation is the atmospheric component of El Niño. This component is an oscillation in surface air pressure between the tropical eastern and the western Pacific Ocean waters.

El Niño–Southern Oscillation (ENSO) is an irregular periodic variation in winds and sea surface temperatures over the tropical eastern Pacific Ocean, affecting the climate of much of the tropics and subtropics. The warming phase of the sea temperature is known as El Niño and the cooling phase as La Niña. The Southern Oscillation is the accompanying atmospheric component, coupled with the sea temperature change: El Niño is accompanied by high air surface pressure in the tropical western Pacific and La Niña with low air surface pressure there. The two periods last several months each and typically occur every few years with varying intensity per period.

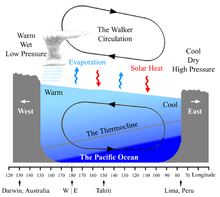
The two phases relate to the Walker circulation, which was discovered by Gilbert Walker during the early twentieth century. The Walker circulation is caused by the pressure gradient force that results from a high-pressure area over the eastern Pacific Ocean, and a low-pressure system over Indonesia. Weakening or reversal of the Walker circulation (which includes the trade winds) decreases or eliminates the upwelling of cold deep sea water, thus creating El Niño by causing the ocean surface to reach above average temperatures. An especially strong Walker circulation causes La Niña, resulting in cooler ocean temperatures due to increased upwelling.

Mechanisms that cause the oscillation remain under study. The extremes of this climate pattern's oscillations cause extreme weather (such as floods and droughts) in many regions of the world. Developing countries dependent upon agriculture and fishing, particularly those bordering the Pacific Ocean, are the most affected.

In climate change science, ENSO is known as one of the internal climate variability phenomena. The other two main ones are Pacific Decadal Variability (or oscillation) and Atlantic Multi-decadal Variability (or oscillation).

Terminology

An early recorded mention of the term "El Niño" ("The Boy" in Spanish) to refer to climate occurred in 1892, when Captain Camilo Carrillo told the geographical society congress in Lima that Peruvian sailors named the warm south-flowing current "El Niño" because it was most noticeable around Christmas. Although pre-Columbian societies were certainly aware of the phenomenon, the indigenous names for it have been lost to history.

Originally, the term El Niño applied to an annual weak warm ocean current that ran southwards along the coast of Peru and Ecuador at about Christmas time. However, over time the term has evolved and now refers to the warm and negative phase of the El Niño–Southern Oscillation (ENSO). La Niña ("The Girl" in Spanish) is the colder counterpart of El Niño, as part of the broader El Niño–Southern Oscillation (ENSO) climate pattern.

Outline

The El Niño–Southern Oscillation is a single climate phenomenon that periodically fluctuates between three phases: Neutral, La Niña or El Niño. La Niña and El Niño are opposite phases which require certain changes to take place in both the ocean and the atmosphere before an event is declared.

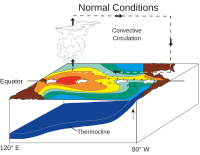
Normally the northward flowing Humboldt Current brings relatively cold water from the Southern Ocean northwards along South America's west coast to the tropics, where it is enhanced by up-welling taking place along the coast of Peru. Along the equator, trade winds cause the ocean currents in the eastern Pacific to draw water from the deeper ocean to the surface, thus cooling the ocean surface. Under the influence of the equatorial trade winds, this cold water flows westwards along the equator where it is slowly heated by the sun. As a direct result sea surface temperatures in the western Pacific are generally warmer, by about 8–10 °C (14–18 °F) than those in the Eastern Pacific. This warmer area of ocean is a source for convection and is associated with cloudiness and rainfall. During El Niño years the cold water weakens or disappears completely as the water in the Central and Eastern Pacific becomes as warm as the Western Pacific.

Walker circulation

Diagram of the quasi-equilibrium and La Niña phase of the Southern Oscillation. The Walker circulation is seen at the surface as easterly trade winds which move water and air warmed by the sun towards the west. The western side of the equatorial Pacific is characterized by warm, wet low pressure weather as the collected moisture is dumped in the form of typhoons and thunderstorms. The ocean is some 60 centimetres (24 in) higher in the western Pacific as the result of this motion. The water and air are returned to the east. Both are now much cooler, and the air is much drier. An El Niño episode is characterised by a breakdown of this water and air cycle, resulting in relatively warm water and moist air in the eastern Pacific.

The Walker circulation is caused by the pressure gradient force that results from a high pressure system over the eastern Pacific Ocean, and a low pressure system over Indonesia. The Walker circulations of the tropical Indian, Pacific, and Atlantic basins result in westerly surface winds in northern summer in the first basin and easterly winds in the second and third basins. As a result, the temperature structure of the three oceans display dramatic asymmetries. The equatorial Pacific and Atlantic both have cool surface temperatures in northern summer in the east, while cooler surface temperatures prevail only in the western Indian Ocean. These changes in surface temperature reflect changes in the depth of the thermocline.

Changes in the Walker circulation with time occur in conjunction with changes in surface temperature. Some of these changes are forced externally, such as the seasonal shift of the sun into the Northern Hemisphere in summer. Other changes appear to be the result of coupled ocean-atmosphere feedback in which, for example, easterly winds cause the sea surface temperature to fall in the east, enhancing the zonal heat contrast and hence intensifying easterly winds across the basin. These anomalous easterlies induce more equatorial upwelling and raise the thermocline in the east, amplifying the initial cooling by the southerlies. This coupled ocean-atmosphere feedback was originally proposed by Bjerknes. From an oceanographic point of view, the equatorial cold tongue is caused by easterly winds. Were the Earth climate symmetric about the equator, cross-equatorial wind would vanish, and the cold tongue would be much weaker and have a very different zonal structure than is observed today.

During non-El Niño conditions, the Walker circulation is seen at the surface as easterly trade winds that move water and air warmed by the sun toward the west. This also creates ocean upwelling off the coasts of Peru and Ecuador and brings nutrient-rich cold water to the surface, increasing fishing stocks. The western side of the equatorial Pacific is characterized by warm, wet, low-pressure weather as the collected moisture is dumped in the form of typhoons and thunderstorms. The ocean is some 60 cm (24 in) higher in the western Pacific as the result of this motion.

Sea surface temperature oscillation

The various "Niño regions" where sea surface temperatures are monitored to determine the current ENSO phase (warm or cold)

Within the National Oceanic and Atmospheric Administration in the United States, sea surface temperatures in the Niño 3.4 region, which stretches from the 120th to 170th meridians west longitude astride the equator five degrees of latitude on either side, are monitored. This region is approximately 3,000 kilometres (1,900 mi) to the southeast of Hawaii. The most recent three-month average for the area is computed, and if the region is more than 0.5 °C (0.9 °F) above (or below) normal for that period, then an El Niño (or La Niña) is considered in progress. The United Kingdom's Met Office also uses a several month period to determine ENSO state. When this warming or cooling occurs for only seven to nine months, it is classified as El Niño/La Niña "conditions"; when it occurs for more than that period, it is classified as El Niño/La Niña "episodes".

Normal Pacific pattern: Equatorial winds gather warm water pool toward the west. Cold water upwells along South American coast. (NOAA / PMEL / TAO)
 
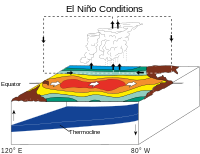
El Niño conditions: Warm water pool approaches the South American coast. The absence of cold upwelling increases warming.
 
La Niña conditions: Warm water is farther west than usual.

Neutral phase

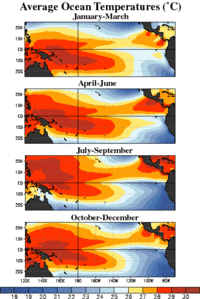
Average equatorial Pacific temperatures

If the temperature variation from climatology is within 0.5 °C (0.9 °F), ENSO conditions are described as neutral. Neutral conditions are the transition between warm and cold phases of ENSO. Ocean temperatures (by definition), tropical precipitation, and wind patterns are near average conditions during this phase. Close to half of all years are within neutral periods. During the neutral ENSO phase, other climate anomalies/patterns such as the sign of the North Atlantic Oscillation or the Pacific–North American teleconnection pattern exert more influence.

The 1997 El Niño observed by TOPEX/Poseidon

Warm phase

When the Walker circulation weakens or reverses and the Hadley circulation strengthens an El Niño results, causing the ocean surface to be warmer than average, as upwelling of cold water occurs less or not at all offshore northwestern South America. El Niño (/ɛlˈnnj/, /-ˈnɪn-/, Spanish pronunciation: [el ˈniɲo]) is associated with a band of warmer than average ocean water temperatures that periodically develops off the Pacific coast of South America. El niño is Spanish for "the child boy", and the capitalized term El Niño refers to the Christ child, Jesus, because periodic warming in the Pacific near South America is usually noticed around Christmas. El Niño accompanies high air surface pressure in the western Pacific. Mechanisms that cause the oscillation remain under study.

Cold phase

An especially strong Walker circulation causes La Niña, resulting in cooler ocean temperatures in the central and eastern tropical Pacific Ocean due to increased upwelling. La Niña (/lɑːˈnnjə/, Spanish pronunciation: [la ˈniɲa]) is a coupled ocean-atmosphere phenomenon that is the counterpart of El Niño as part of the broader El Niño Southern Oscillation climate pattern. The name La Niña originates from Spanish, meaning "the child girl", analogous to El Niño meaning "the child boy". During a period of La Niña the sea surface temperature across the equatorial eastern central Pacific will be lower than normal by 3–5 °C. In the United States, an appearance of La Niña happens for at least five months of La Niña conditions. However, each country and island nation has a different threshold for what constitutes a La Niña event, which is tailored to their specific interests. The Japan Meteorological Agency for example, declares that a La Niña event has started when the average five month sea surface temperature deviation for the NINO.3 region, is over 0.5 °C (0.90 °F) cooler for 6 consecutive months or longer.

Transitional phases

Transitional phases at the onset or departure of El Niño or La Niña can also be important factors on global weather by affecting teleconnections. Significant episodes, known as Trans-Niño, are measured by the Trans-Niño index (TNI). Examples of affected short-time climate in North America include precipitation in the Northwest US and intense tornado activity in the contiguous US.

Southern Oscillation

The regions where the air pressure are measured and compared to generate the Southern Oscillation Index
Southern Oscillation Index correlated with mean sea level pressure.

The Southern Oscillation is the atmospheric component of El Niño. This component is an oscillation in surface air pressure between the tropical eastern and the western Pacific Ocean waters. The strength of the Southern Oscillation is measured by the Southern Oscillation Index (SOI). The SOI is computed from fluctuations in the surface air pressure difference between Tahiti (in the Pacific) and Darwin, Australia (on the Indian Ocean).

  • El Niño episodes have negative SOI, meaning there is lower pressure over Tahiti and higher pressure in Darwin.
  • La Niña episodes have positive SOI, meaning there is higher pressure in Tahiti and lower in Darwin.

Low atmospheric pressure tends to occur over warm water and high pressure occurs over cold water, in part because of deep convection over the warm water. El Niño episodes are defined as sustained warming of the central and eastern tropical Pacific Ocean, thus resulting in a decrease in the strength of the Pacific trade winds, and a reduction in rainfall over eastern and northern Australia. La Niña episodes are defined as sustained cooling of the central and eastern tropical Pacific Ocean, thus resulting in an increase in the strength of the Pacific trade winds, and the opposite effects in Australia when compared to El Niño.

Although the Southern Oscillation Index has a long station record going back to the 1800s, its reliability is limited due to the presence of both Darwin and Tahiti well south of the Equator, resulting in the surface air pressure at both locations being less directly related to ENSO. To overcome this question, a new index was created, being named the Equatorial Southern Oscillation Index (EQSOI). To generate this index data, two new regions, centered on the Equator, were delimited to create a new index: The western one is located over Indonesia and the eastern one is located over equatorial Pacific, close to the South American coast. However, data on EQSOI goes back only to 1949.

Related patterns

Madden–Julian oscillation

A Hovmöller diagram of the 5-day running mean of outgoing longwave radiation showing the MJO. Time increases from top to bottom in the figure, so contours that are oriented from upper-left to lower-right represent movement from west to east.
The Madden–Julian oscillation (MJO) is the largest element of the intraseasonal (30- to 90-day) variability in the tropical atmosphere. It was discovered in 1971 by Roland Madden and Paul Julian of the American National Center for Atmospheric Research (NCAR). It is a large-scale coupling between atmospheric circulation and tropical deep atmospheric convection. Unlike a standing pattern like the El Niño–Southern Oscillation (ENSO), the Madden–Julian oscillation is a traveling pattern that propagates eastward, at approximately 4 to 8 m/s (14 to 29 km/h; 9 to 18 mph), through the atmosphere above the warm parts of the Indian and Pacific oceans. This overall circulation pattern manifests itself most clearly as anomalous rainfall.

Interactions with global warming

Colored bars show how El Niño years (red, regional warming) and La Niña years (blue, regional cooling) relate to overall global warming. The El Niño–Southern Oscillation has been linked to variability in longer-term global average temperature increase.

In climate change science, ENSO is known as one of the internal climate variability phenomena. The other two main ones are Pacific Decadal Variability (or oscillation) and Atlantic Multi-decadal Variability (or oscillation).

El Niño events cause short-term (approximately 1 year in length) spikes in global average surface temperature while La Niña events cause short term cooling. Therefore, the relative frequency of El Niño compared to La Niña events can affect global temperature trends on decadal timescales. Over the last several decades, the number of El Niño events increased, and the number of La Niña events decreased, although observation of ENSO for much longer is needed to detect robust changes.

The studies of historical data show the recent El Niño variation is most likely linked to global warming. For example, one of the most recent results, even after subtracting the positive influence of decadal variation, is shown to be possibly present in the ENSO trend, the amplitude of the ENSO variability in the observed data still increases, by as much as 60% in the last 50 years. A study published in 2023 by CSIRO researchers found that climate change may have increased by two times the likelihood of strong El Niño events and nine times the likelihood of strong La Niña events. The study claims it found a consensus between different models and experiments.

Future trends in ENSO are uncertain as different models make different predictions. It may be that the observed phenomenon of more frequent and stronger El Niño events occurs only in the initial phase of the global warming, and then (e.g., after the lower layers of the ocean get warmer, as well), El Niño will become weaker. It may also be that the stabilizing and destabilizing forces influencing the phenomenon will eventually compensate for each other. More research is needed to provide a better answer to that question. The ENSO is considered to be a potential tipping element in Earth's climate and, under the global warming, can enhance or alternate regional climate extreme events through a strengthened teleconnection. For example, an increase in the frequency and magnitude of El Niño events have triggered warmer than usual temperatures over the Indian Ocean, by modulating the Walker circulation. This has resulted in a rapid warming of the Indian Ocean, and consequently a weakening of the Asian Monsoon.

The IPCC Sixth Assessment Report summarized the state of the art of research in 2021 into the future of ENSO as follows:

  • "In the long term, it is very likely that the precipitation variance related to El Niño–Southern Oscillation will increase" and
  • "It is very likely that rainfall variability related to changes in the strength and spatial extent of ENSO teleconnections will lead to significant changes at regional scale". and
  • "There is medium confidence that both ENSO amplitude and the frequency of high-magnitude events since 1950 are higher than over the period from 1850 and possibly as far back as 1400".

Impacts

On precipitation

Regional impacts of El Niño
 
Regional impacts of La Niña.

Developing countries dependent upon agriculture and fishing, particularly those bordering the Pacific Ocean, are the most affected by ENSO. The effects of El Niño in South America are direct and strong. An El Niño is associated with warm and very wet weather months in April–October along the coasts of northern Peru and Ecuador, causing major flooding whenever the event is strong or extreme. La Niña causes a drop in sea surface temperatures over Southeast Asia and heavy rains over Malaysia, the Philippines, and Indonesia.

To the north across Alaska, La Niña events lead to drier than normal conditions, while El Niño events do not have a correlation towards dry or wet conditions. During El Niño events, increased precipitation is expected in California due to a more southerly, zonal, storm track. During La Niña, increased precipitation is diverted into the Pacific Northwest due to a more northerly storm track. During La Niña events, the storm track shifts far enough northward to bring wetter than normal winter conditions (in the form of increased snowfall) to the Midwestern states, as well as hot and dry summers. During the El Niño portion of ENSO, increased precipitation falls along the Gulf coast and Southeast due to a stronger than normal, and more southerly, polar jet stream.

In the late winter and spring during El Niño events, drier than average conditions can be expected in Hawaii. On Guam during El Niño years, dry season precipitation averages below normal. However, the threat of a tropical cyclone is over triple what is normal during El Niño years, so extreme shorter duration rainfall events are possible. On American Samoa during El Niño events, precipitation averages about 10 percent above normal, while La Niña events lead to precipitation amounts which average close to 10 percent below normal. ENSO is linked to rainfall over Puerto Rico. During an El Niño, snowfall is greater than average across the southern Rockies and Sierra Nevada mountain range, and is well-below normal across the Upper Midwest and Great Lakes states. During a La Niña, snowfall is above normal across the Pacific Northwest and western Great Lakes. In Western Asia, during the region's November–April rainy season, it was discovered that in the El Niño phase there was increased precipitation, and in the La Niña phase there was a reduced amount of precipitation on average.

Although ENSO can dramatically affect precipitation, even severe droughts and rainstorms in ENSO areas are not always deadly. Scholar Mike Davis cites ENSO as responsible for droughts in India and China in the late nineteenth century, but argues that nations in these areas avoided devastating famine during these droughts with institutional preparation and organized relief efforts.

On Tehuantepecers

The synoptic condition for the Tehuantepecer, a violent mountain-gap wind in between the mountains of Mexico and Guatemala, is associated with high-pressure system forming in Sierra Madre of Mexico in the wake of an advancing cold front, which causes winds to accelerate through the Isthmus of Tehuantepec. Tehuantepecers primarily occur during the cold season months for the region in the wake of cold fronts, between October and February, with a summer maximum in July caused by the westward extension of the Azores-Bermuda high pressure system. Wind magnitude is greater during El Niño years than during La Niña years, due to the more frequent cold frontal incursions during El Niño winters. Tehuantepec winds reach 20 knots (40 km/h) to 45 knots (80 km/h), and on rare occasions 100 knots (190 km/h). The wind's direction is from the north to north-northeast. It leads to a localized acceleration of the trade winds in the region, and can enhance thunderstorm activity when it interacts with the Intertropical Convergence Zone. The effects can last from a few hours to six days.

On coral bleaching

Following the El Nino event in 1997 – 1998, the Pacific Marine Environmental Laboratory attributes the first large-scale coral bleaching event to the warming waters.

On hurricanes

Based on modeled and observed accumulated cyclone energy (ACE), El Niño years usually result in less active hurricane seasons in the Atlantic Ocean, but instead favor a shift of tropical cyclone activity in the Pacific Ocean, compared to La Niña years favoring above average hurricane development in the Atlantic and less so in the Pacific basin.

Variations

The traditional ENSO (El Niño Southern Oscillation), also called Eastern Pacific (EP) ENSO, involves temperature anomalies in the eastern Pacific. However, in the 1990s and 2000s, nontraditional ENSO conditions were observed, in which the usual place of the temperature anomaly (Niño 1 and 2) is not affected, but an anomaly arises in the central Pacific (Niño 3.4). The phenomenon is called Central Pacific (CP) ENSO, "dateline" ENSO (because the anomaly arises near the dateline), or ENSO "Modoki" (Modoki is Japanese for "similar, but different"). There are flavors of ENSO additional to EP and CP types and some scientists argue that ENSO exists as a continuum often with hybrid types.

The effects of the CP ENSO are different from those of the traditional EP ENSO. The El Niño Modoki leads to more hurricanes more frequently making landfall in the Atlantic. La Niña Modoki leads to a rainfall increase over northwestern Australia and northern Murray–Darling basin, rather than over the east as in a conventional La Niña. Also, La Niña Modoki increases the frequency of cyclonic storms over Bay of Bengal, but decreases the occurrence of severe storms in the Indian Ocean.

The recent discovery of ENSO Modoki has some scientists believing it to be linked to global warming. However, comprehensive satellite data go back only to 1979. More research must be done to find the correlation and study past El Niño episodes. More generally, there is no scientific consensus on how/if climate change might affect ENSO.

There is also a scientific debate on the very existence of this "new" ENSO. Indeed, a number of studies dispute the reality of this statistical distinction or its increasing occurrence, or both, either arguing the reliable record is too short to detect such a distinction, finding no distinction or trend using other statistical approaches, or that other types should be distinguished, such as standard and extreme ENSO.

Following the asymmetric nature of the warm and cold phases of ENSO, some studies could not identify such distinctions for La Niña, both in observations and in the climate models, but some sources indicate that there is a variation on La Niña with cooler waters on central Pacific and average or warmer water temperatures on both eastern and western Pacific, also showing eastern Pacific Ocean currents going to the opposite direction compared to the currents in traditional La Niñas.

Magnetic refrigeration

From Wikipedia, the free encyclopedia
Gadolinium alloy heats up inside the magnetic field and loses thermal energy to the environment, so it exits the field and becomes cooler than when it entered.

Magnetic refrigeration is a cooling technology based on the magnetocaloric effect. This technique can be used to attain extremely low temperatures, as well as the ranges used in common refrigerators.

A magnetocaloric material warms up when a magnetic field is applied. The warming is due to changes in the internal state of the material releasing heat. When the magnetic field is removed, the material returns to its original state, reabsorbing the heat, and returning to original temperature. To achieve refrigeration, the material is allowed to radiate away its heat while in the magnetized hot state. Removing the magnetism, the material then cools to below its original temperature.

The effect was first observed in 1881 by a German physicist Emil Warburg, followed by French physicist P. Weiss and Swiss physicist A. Piccard in 1917. The fundamental principle was suggested by P. Debye (1926) and W. Giauque (1927). The first working magnetic refrigerators were constructed by several groups beginning in 1933. Magnetic refrigeration was the first method developed for cooling below about 0.3 K (a temperature attainable by pumping on 3
He
vapors).

Magnetocaloric effect

The magnetocaloric effect (MCE, from magnet and calorie) is a magneto-thermodynamic phenomenon in which a temperature change of a suitable material is caused by exposing the material to a changing magnetic field. This is also known by low temperature physicists as adiabatic demagnetization. In that part of the refrigeration process, a decrease in the strength of an externally applied magnetic field allows the magnetic domains of a magnetocaloric material to become disoriented from the magnetic field by the agitating action of the thermal energy (phonons) present in the material. If the material is isolated so that no energy is allowed to (re)migrate into the material during this time, (i.e., an adiabatic process) the temperature drops as the domains absorb the thermal energy to perform their reorientation. The randomization of the domains occurs in a similar fashion to the randomization at the curie temperature of a ferromagnetic material, except that magnetic dipoles overcome a decreasing external magnetic field while energy remains constant, instead of magnetic domains being disrupted from internal ferromagnetism as energy is added.

One of the most notable examples of the magnetocaloric effect is in the chemical element gadolinium and some of its alloys. Gadolinium's temperature increases when it enters certain magnetic fields. When it leaves the magnetic field, the temperature drops. The effect is considerably stronger for the gadolinium alloy Gd
5
(Si
2
Ge
2
)
. Praseodymium alloyed with nickel (PrNi
5
) has such a strong magnetocaloric effect that it has allowed scientists to approach to within one millikelvin, one thousandth of a degree of absolute zero.

Equation

The magnetocaloric effect can be quantified with the following equation:

where is the adiabatic change in temperature of the magnetic system around temperature T, H is the applied external magnetic field, C is the heat capacity of the working magnet (refrigerant) and M is the magnetization of the refrigerant.

From the equation we can see that the magnetocaloric effect can be enhanced by:

  • a large field variation
  • a magnet material with a small heat capacity
  • a magnet with large changes in net magnetization vs. temperature, at constant magnetic field

The adiabatic change in temperature, , can be seen to be related to the magnet's change in magnetic entropy () since

This implies that the absolute change in the magnet's entropy determines the possible magnitude of the adiabatic temperature change under a thermodynamic cycle of magnetic field variation. T

Thermodynamic cycle

Analogy between magnetic refrigeration and vapor cycle or conventional refrigeration. H = externally applied magnetic field; Q = heat quantity; P = pressure; ΔTad = adiabatic temperature variation

The cycle is performed as a refrigeration cycle that is analogous to the Carnot refrigeration cycle, but with increases and decreases in magnetic field strength instead of increases and decreases in pressure. It can be described at a starting point whereby the chosen working substance is introduced into a magnetic field, i.e., the magnetic flux density is increased. The working material is the refrigerant, and starts in thermal equilibrium with the refrigerated environment.

  • Adiabatic magnetization: A magnetocaloric substance is placed in an insulated environment. The increasing external magnetic field (+H) causes the magnetic dipoles of the atoms to align, thereby decreasing the material's magnetic entropy and heat capacity. Since overall energy is not lost (yet) and therefore total entropy is not reduced (according to thermodynamic laws), the net result is that the substance is heated (T + ΔTad).
  • Isomagnetic enthalpic transfer: This added heat can then be removed (-Q) by a fluid or gas — gaseous or liquid helium, for example. The magnetic field is held constant to prevent the dipoles from reabsorbing the heat. Once sufficiently cooled, the magnetocaloric substance and the coolant are separated (H=0).
  • Adiabatic demagnetization: The substance is returned to another adiabatic (insulated) condition so the total entropy remains constant. However, this time the magnetic field is decreased, the thermal energy causes the magnetic moments to overcome the field, and thus the sample cools, i.e., an adiabatic temperature change. Energy (and entropy) transfers from thermal entropy to magnetic entropy, measuring the disorder of the magnetic dipoles.
  • Isomagnetic entropic transfer: The magnetic field is held constant to prevent the material from reheating. The material is placed in thermal contact with the environment to be refrigerated. Because the working material is cooler than the refrigerated environment (by design), heat energy migrates into the working material (+Q).

Once the refrigerant and refrigerated environment are in thermal equilibrium, the cycle can restart.

Applied technique

The basic operating principle of an adiabatic demagnetization refrigerator (ADR) is the use of a strong magnetic field to control the entropy of a sample of material, often called the "refrigerant". Magnetic field constrains the orientation of magnetic dipoles in the refrigerant. The stronger the magnetic field, the more aligned the dipoles are, corresponding to lower entropy and heat capacity because the material has (effectively) lost some of its internal degrees of freedom. If the refrigerant is kept at a constant temperature through thermal contact with a heat sink (usually liquid helium) while the magnetic field is switched on, the refrigerant must lose some energy because it is equilibrated with the heat sink. When the magnetic field is subsequently switched off, the heat capacity of the refrigerant rises again because the degrees of freedom associated with orientation of the dipoles are once again liberated, pulling their share of equipartitioned energy from the motion of the molecules, thereby lowering the overall temperature of a system with decreased energy. Since the system is now insulated when the magnetic field is switched off, the process is adiabatic, i.e., the system can no longer exchange energy with its surroundings (the heat sink), and its temperature decreases below its initial value, that of the heat sink.

The operation of a standard ADR proceeds roughly as follows. First, a strong magnetic field is applied to the refrigerant, forcing its various magnetic dipoles to align and putting these degrees of freedom of the refrigerant into a state of lowered entropy. The heat sink then absorbs the heat released by the refrigerant due to its loss of entropy. Thermal contact with the heat sink is then broken so that the system is insulated, and the magnetic field is switched off, increasing the heat capacity of the refrigerant, thus decreasing its temperature below the temperature of the heat sink. In practice, the magnetic field is decreased slowly in order to provide continuous cooling and keep the sample at an approximately constant low temperature. Once the field falls to zero or to some low limiting value determined by the properties of the refrigerant, the cooling power of the ADR vanishes, and heat leaks will cause the refrigerant to warm up.

Working materials

The magnetocaloric effect (MCE) is an intrinsic property of a magnetic solid. This thermal response of a solid to the application or removal of magnetic fields is maximized when the solid is near its magnetic ordering temperature. Thus, the materials considered for magnetic refrigeration devices should be magnetic materials with a magnetic phase transition temperature near the temperature region of interest. For refrigerators that could be used in the home, this temperature is room temperature. The temperature change can be further increased when the order-parameter of the phase transition changes strongly within the temperature range of interest.

The magnitudes of the magnetic entropy and the adiabatic temperature changes are strongly dependent upon the magnetic ordering process. The magnitude is generally small in antiferromagnets, ferrimagnets and spin glass systems but can be much larger for ferromagnets that undergo a magnetic phase transition. First order phase transitions are characterized by a discontinuity in the magnetization changes with temperature, resulting in a latent heat. Second order phase transitions do not have this latent heat associated with the phase transition.

In the late 1990s Pecharksy and Gschneidner reported a magnetic entropy change in Gd
5
(Si
2
Ge
2
)
that was about 50% larger than that reported for Gd metal, which had the largest known magnetic entropy change at the time. This giant magnetocaloric effect (GMCE) occurred at 270 K, which is lower than that of Gd (294 K). Since the MCE occurs below room temperature these materials would not be suitable for refrigerators operating at room temperature. Since then other alloys have also demonstrated the giant magnetocaloric effect. These include Gd
5
(Si
x
Ge
1−x
)
4
, La(Fe
x
Si
1−x
)
13
H
x
and MnFeP
1−x
As
x
alloys. Gadolinium and its alloys undergo second-order phase transitions that have no magnetic or thermal hysteresis. However, the use of rare earth elements makes these materials very expensive.

Current research has been used to describe alloys with a significant magnetocaloric effect in terms of a thermodynamic system. Literature says that Gd5(Si2Ge2) for example may be described as a thermodynamic system provided it satisfies the condition of being “a quantity of matter or region in space chosen for study”. Such systems have become relevant to modern research in thermodynamics because they serve as plausible materials for the creation of high performance thermoelectric materials.

Ni
2
Mn-X
(X = Ga, Co, In, Al, Sb) Heusler alloys are also promising candidates for magnetic cooling applications because they have Curie temperatures near room temperature and, depending on composition, can have martensitic phase transformations near room temperature. These materials exhibit the magnetic shape memory effect and can also be used as actuators, energy harvesting devices, and sensors. When the martensitic transformation temperature and the Curie temperature are the same (based on composition) the magnitude of the magnetic entropy change is the largest. In February 2014, GE announced the development of a functional Ni-Mn-based magnetic refrigerator.

The development of this technology is very material-dependent and will likely not replace vapor-compression refrigeration without significantly improved materials that are cheap, abundant, and exhibit much larger magnetocaloric effects over a larger range of temperatures. Such materials need to show significant temperature changes under a field of two tesla or less, so that permanent magnets can be used for the production of the magnetic field.

Paramagnetic salts

The original proposed refrigerant was a paramagnetic salt, such as cerium magnesium nitrate. The active magnetic dipoles in this case are those of the electron shells of the paramagnetic atoms.

In a paramagnetic salt ADR, the heat sink is usually provided by a pumped 4
He
(about 1.2 K) or 3
He
(about 0.3 K) cryostat. An easily attainable 1 T magnetic field is generally required for initial magnetization. The minimum temperature attainable is determined by the self-magnetization tendencies of the refrigerant salt, but temperatures from 1 to 100 mK are accessible. Dilution refrigerators had for many years supplanted paramagnetic salt ADRs, but interest in space-based and simple to use lab-ADRs has remained, due to the complexity and unreliability of the dilution refrigerator.

At a low enough temperature, paramagnetic salts become either diamagnetic or ferromagnetic, limiting the lowest temperature that can be reached using this method.

Nuclear demagnetization

One variant of adiabatic demagnetization that continues to find substantial research application is nuclear demagnetization refrigeration (NDR). NDR follows the same principles, but in this case the cooling power arises from the magnetic dipoles of the nuclei of the refrigerant atoms, rather than their electron configurations. Since these dipoles are of much smaller magnitude, they are less prone to self-alignment and have lower intrinsic minimum fields. This allows NDR to cool the nuclear spin system to very low temperatures, often 1 µK or below. Unfortunately, the small magnitudes of nuclear magnetic dipoles also makes them less inclined to align to external fields. Magnetic fields of 3 teslas or greater are often needed for the initial magnetization step of NDR.

In NDR systems, the initial heat sink must sit at very low temperatures (10–100 mK). This precooling is often provided by the mixing chamber of a dilution refrigerator or a paramagnetic salt.

Commercial development

Research and a demonstration proof of concept device in 2001 succeeded in applying commercial-grade materials and permanent magnets at room temperatures to construct a magnetocaloric refrigerator.

On August 20, 2007, the Risø National Laboratory (Denmark) at the Technical University of Denmark, claimed to have reached a milestone in their magnetic cooling research when they reported a temperature span of 8.7 K. They hoped to introduce the first commercial applications of the technology by 2010.

As of 2013 this technology had proven commercially viable only for ultra-low temperature cryogenic applications available for decades. Magnetocaloric refrigeration systems are composed of pumps, motors, secondary fluids, heat exchangers of different types, magnets and magnetic materials. These processes are greatly affected by irreversibilities and should be adequately considered. At year-end, Cooltech Applications announced that its first commercial refrigeration equipment would enter the market in 2014. Cooltech Applications launched their first commercially available magnetic refrigeration system on 20 June 2016. At the 2015 Consumer Electronics Show in Las Vegas, a consortium of Haier, Astronautics Corporation of America and BASF presented the first cooling appliance. BASF claim of their technology a 35% improvement over using compressors.

In November 2015, at the Medica 2015 fair, Cooltech Applications presented, in collaboration with Kirsch medical GmbH, the world's first magnetocaloric medical cabinet. One year later, in September 2016, at the 7th International Conference on Magnetic Refrigeration at Room Temperature (Thermag VII)] held in Torino, Italy, Cooltech Applications presented the world's first magnetocaloric frozen heat exchanger.

In 2017, Cooltech Applications presented a fully functional 500 liters' magnetocaloric cooled cabinet with a 30 kg (66 lb) load and an air temperature inside the cabinet of +2 °C. That proved that magnetic refrigeration is a mature technology, capable of replacing the classic refrigeration solutions.

One year later, in September 2018, at the 8th International Conference on Magnetic Refrigeration at Room Temperature (Thermag VIII]), Cooltech Applications presented a paper on a magnetocaloric prototype designed as a 15 kW proof-of-concept unit. This has been considered by the community as the largest magnetocaloric prototype ever created.

At the same conference, Dr. Sergiu Lionte announced that, due to financial issues, Cooltech Applications declared bankruptcy. Later on, in 2019 Ubiblue company, today named Magnoric, is formed by some of the old Cooltech Application's team members. The entire patent portfolio form Cooltech Applications was taken over by Magnoric since then, while publishing additional patents at the same time.

In 2019, at the 5th Delft Days Conference on Magnetocalorics, Dr. Sergiu Lionte presented Ubiblue's (former Cooltech Application) last prototype. Later, the magnetocaloric community acknowledged that Ubiblue had the most developed magnetocalorics prototypes.

Thermal and magnetic hysteresis problems remain to be solved for first-order phase transition materials that exhibit the GMCE.

One potential application is in spacecraft.

Vapor-compression refrigeration units typically achieve performance coefficients of 60% of that of a theoretical ideal Carnot cycle, much higher than current MR technology. Small domestic refrigerators are however much less efficient.

In 2014 giant anisotropic behaviour of the magnetocaloric effect was found in HoMn
2
O
5
at 10 K. The anisotropy of the magnetic entropy change gives rise to a large rotating MCE offering the possibility to build simplified, compact, and efficient magnetic cooling systems by rotating it in a constant magnetic field.

In 2015 Aprea et al. presented a new refrigeration concept, GeoThermag, which is a combination of magnetic refrigeration technology with that of low-temperature geothermal energy. To demonstrate the applicability of the GeoThermag technology, they developed a pilot system that consists of a 100-m deep geothermal probe; inside the probe, water flows and is used directly as a regenerating fluid for a magnetic refrigerator operating with gadolinium. The GeoThermag system showed the ability to produce cold water even at 281.8 K in the presence of a heat load of 60 W. In addition, the system has shown the existence of an optimal frequency f AMR, 0.26 Hz, for which it was possible to produce cold water at 287.9 K with a thermal load equal to 190 W with a COP of 2.20. Observing the temperature of the cold water that was obtained in the tests, the GeoThermag system showed a good ability to feed the cooling radiant floors and a reduced capacity for feeding the fan coil systems.

History

The effect was discovered first observed by German physicist Emil Warburg in 1881, subsequently by French physicist Pierre Weiss and Swiss physicist Auguste Piccard in 1917.

Major advances first appeared in the late 1920s when cooling via adiabatic demagnetization was independently proposed by chemistry Nobel Laureates Peter Debye in 1926 and William F. Giauque in 1927.

It was first demonstrated experimentally by Giauque and his colleague D. P. MacDougall in 1933 for cryogenic purposes when they reached 0.25 K. Between 1933 and 1997, advances in MCE cooling occurred.

In 1997, the first near room-temperature proof of concept magnetic refrigerator was demonstrated by Karl A. Gschneidner, Jr. by the Iowa State University at Ames Laboratory. This event attracted interest from scientists and companies worldwide who started developing new kinds of room temperature materials and magnetic refrigerator designs.

A major breakthrough came 2002 when a group at the University of Amsterdam demonstrated the giant magnetocaloric effect in MnFe(P,As) alloys that are based on abundant materials.

Refrigerators based on the magnetocaloric effect have been demonstrated in laboratories, using magnetic fields starting at 0.6 T up to 10 T. Magnetic fields above 2 T are difficult to produce with permanent magnets and are produced by a superconducting magnet (1 T is about 20.000 times the Earth's magnetic field).

Polarization

From Wikipedia, the free encyclopedia https://en.wikipedia.org/wiki/Polarization_(waves) Circular...