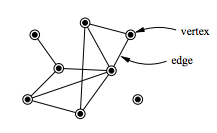
A small example network with eight vertices and ten edges
Network theory is the study of graphs as a representation of either symmetric relations or asymmetric relations between discrete objects. In computer science and network science, network theory is a part of graph theory: a network can be defined as a graph in which nodes and/or edges have attributes (e.g. names).
Network theory has applications in many disciplines including statistical physics, particle physics, computer science, electrical engineering, biology, economics, finance, operations research, climatology, ecology and sociology. Applications of network theory include logistical networks, the World Wide Web, Internet, gene regulatory networks, metabolic networks, social networks, epistemological networks, etc.; see List of network theory topics for more examples.
Euler's solution of the Seven Bridges of Königsberg problem is considered to be the first true proof in the theory of networks.
Network optimization
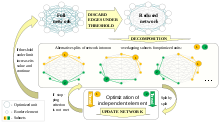
Break down a NP-hard network optimization task into subtasks by discarding of the most irrelevant interactions in network.
Network problems that involve finding an optimal way of doing something are studied under the name combinatorial optimization. Examples include network flow, shortest path problem, transport problem, transshipment problem, location problem, matching problem, assignment problem, packing problem, routing problem, critical path analysis and PERT (Program Evaluation & Review Technique). In order to break a NP-hard task of network optimization down into subtasks the network is decomposed into relatively independent subnets.
Network analysis
Electric network analysis
The electric power systems analysis could be conducted using network theory from two main points of view:
(1) an abstract perspective (i.e., as a graph consists from nodes
and edges), regardless of the electric power aspects (e.g.,
transmission line impedances). Most of these studies focus only on the
abstract structure of the power grid using node degree distribution and
betweenness distribution, which introduces substantial insight regarding
the vulnerability assessment of the grid. Through these types of
studies, the category of the grid structure could be identified from the
complex network perspective (e.g., single-scale, scale-free). This
classification might help the electric power system engineers in the
planning stage or while upgrading the infrastructure (e.g., add a new
transmission line) to maintain a proper redundancy level in the
transmission system.
(2) weighted graphs that blend an abstract understanding of complex network theories and electric power systems properties.
Social network analysis
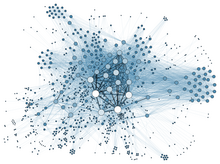
Visualization of social network analysis
Social network analysis examines the structure of relationships between social entities. These entities are often persons, but may also be groups, organizations, nation states, web sites, or scholarly publications.
Since the 1970s, the empirical study of networks has played a central role in social science, and many of the mathematical and statistical tools used for studying networks have been first developed in sociology. Amongst many other applications, social network analysis has been used to understand the diffusion of innovations, news and rumors. Similarly, it has been used to examine the spread of both diseases and health-related behaviors. It has also been applied to the study of markets, where it has been used to examine the role of trust in exchange relationships and of social mechanisms in setting prices. Similarly, it has been used to study recruitment into political movements
and social organizations. It has also been used to conceptualize
scientific disagreements as well as academic prestige. More recently,
network analysis (and its close cousin traffic analysis) has gained a significant use in military intelligence, for uncovering insurgent networks of both hierarchical and leaderless nature.
Biological network analysis
With the recent explosion of publicly available high throughput biological data, the analysis of molecular networks has gained significant interest.
The type of analysis in this context is closely related to social
network analysis, but often focusing on local patterns in the network.
For example, network motifs are small subgraphs that are over-represented in the network. Similarly, activity motifs
are patterns in the attributes of nodes and edges in the network that
are over-represented given the network structure. Using networks to
analyse patterns in biological systems, such as food-webs, allows us to
visualize the nature and strength of interactions between species. The
analysis of biological networks with respect to diseases has led to the development of the field of network medicine. Recent examples of application of network theory in biology include applications to understanding the cell cycle.
The interactions between physiological systems like brain, heart, eyes, etc. can be regarded as a physiological network.
Narrative network analysis
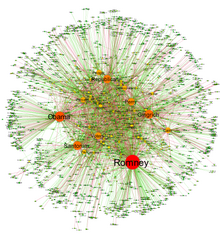
Narrative network of US Elections 2012
The automatic parsing of textual corpora has enabled the extraction of actors and their relational networks on a vast scale. The resulting narrative networks,
which can contain thousands of nodes, are then analysed by using tools
from Network theory to identify the key actors, the key communities or
parties, and general properties such as robustness or structural
stability of the overall network, or centrality of certain nodes. This automates the approach introduced by Quantitative Narrative Analysis, whereby subject-verb-object triplets are identified with pairs of actors linked by an action, or pairs formed by actor-object.
Link analysis
Link analysis
is a subset of network analysis, exploring associations between
objects. An example may be examining the addresses of suspects and
victims, the telephone numbers they have dialed and financial
transactions that they have partaken in during a given timeframe, and
the familial relationships between these subjects as a part of police
investigation. Link analysis here provides the crucial relationships and
associations between very many objects of different types that are not
apparent from isolated pieces of information. Computer-assisted or fully
automatic computer-based link analysis is increasingly employed by banks and insurance agencies in fraud detection, by telecommunication operators in telecommunication network analysis, by medical sector in epidemiology and pharmacology, in law enforcement investigations, by search engines for relevance rating (and conversely by the spammers for spamdexing and by business owners for search engine optimization),
and everywhere else where relationships between many objects have to be
analyzed. Links are also derived from similarity of time behavior in
both nodes. Examples include climate networks where the links between
two locations (nodes) are determined for example, by the similarity of
the rainfall or temperature fluctuations in both sites.
Network robustness
The structural robustness of networks is studied using percolation theory.
When a critical fraction of nodes (or links) is removed the network
becomes fragmented into small disconnected clusters. This phenomenon is
called percolation, and it represents an order-disorder type of phase transition with critical exponents.
Percolation theory can predict the size of the largest component
(called giant component), the critical threshold and the critical
exponents.
Web link analysis
Several Web search ranking algorithms use link-based centrality metrics, including Google's PageRank, Kleinberg's HITS algorithm, the CheiRank and TrustRank
algorithms. Link analysis is also conducted in information science and
communication science in order to understand and extract information
from the structure of collections of web pages. For example, the
analysis might be of the interlinking between politicians' web sites or
blogs. Another use is for classifying pages according to their mention
in other pages.
Centrality measures
Information about the relative importance of nodes and edges in a graph can be obtained through centrality measures, widely used in disciplines like sociology. For example, eigenvector centrality uses the eigenvectors of the adjacency matrix
corresponding to a network, to determine nodes that tend to be
frequently visited. Formally established measures of centrality are degree centrality, closeness centrality, betweenness centrality, eigenvector centrality, subgraph centrality and Katz centrality.
The purpose or objective of analysis generally determines the type of
centrality measure to be used. For example, if one is interested in
dynamics on networks or the robustness of a network to node/link
removal, often the dynamical importance of a node is the most relevant centrality measure.For a centrality measure based on k-core analysis see ref.
Assortative and disassortative mixing
These concepts are used to characterize the linking preferences of
hubs in a network. Hubs are nodes which have a large number of links.
Some hubs tend to link to other hubs while others avoid connecting to
hubs and prefer to connect to nodes with low connectivity. We say a hub
is assortative when it tends to connect to other hubs. A disassortative
hub avoids connecting to other hubs. If hubs have connections with the
expected random probabilities, they are said to be neutral. There are
three methods to quantify degree correlations.
Recurrence networks
The recurrence matrix of a recurrence plot
can be considered as the adjacency matrix of an undirected and
unweighted network. This allows for the analysis of time series by
network measures. Applications range from detection of regime changes
over characterizing dynamics to synchronization analysis.
Spread
Content in a complex network can spread via two major methods: conserved spread and non-conserved spread.
In conserved spread, the total amount of content that enters a complex
network remains constant as it passes through. The model of conserved
spread can best be represented by a pitcher containing a fixed amount of
water being poured into a series of funnels connected by tubes. Here,
the pitcher represents the original source and the water is the content
being spread. The funnels and connecting tubing represent the nodes
and the connections between nodes, respectively. As the water passes
from one funnel into another, the water disappears instantly from the
funnel that was previously exposed to the water. In non-conserved
spread, the amount of content changes as it enters and passes through a
complex network. The model of non-conserved spread can best be
represented by a continuously running faucet running through a series of
funnels connected by tubes. Here, the amount of water from the
original source is infinite. Also, any funnels that have been exposed to
the water continue to experience the water even as it passes into
successive funnels. The non-conserved model is the most suitable for
explaining the transmission of most infectious diseases, neural excitation, information and rumors, etc.
Interdependent networks
An
interdependent network is a system of coupled networks where nodes of
one or more networks depend on nodes in other networks. Such
dependencies are enhanced by the developments in modern technology.
Dependencies may lead to cascading failures between the networks and a
relatively small failure can lead to a catastrophic breakdown of the
system. Blackouts are a fascinating demonstration of the important role
played by the dependencies between networks. A recent study developed a
framework to study the cascading failures in an interdependent networks
system.


