Crop tolerance to seawater is the ability of an agricultural crop to withstand the high salinity induced by irrigation with seawater, or a mixture of fresh water and seawater. There are crops that can grow on seawater and demonstration farms have shown the feasibility.
The government of the Netherlands reports a breakthrough in food
security as specific varieties of potatoes, carrots, red onions, white
cabbage and broccoli appear to thrive if they are irrigated with salt
water.
Salt Farm Texel
The Salt Farm Texel, a farm on the island of Texel, The Netherlands, is testing the salt tolerance of crops under controlled field conditions. There are 56 experimental plots of 160 m2
each that are treated in eight replicas with seven different salt
concentrations. These concentrations are obtained with intensive daily
drip irrigations of 10 or more mm (i.e. more than 10 liter per m2 per day) with water having a salt concentration expressed in electric conductivity (EC) of 2, 4, 8, 12, 16, 20 and 35 dS/m. The range of EC values is obtained by mixing fresh water with the appropriate amount of seawater
having a salinity corresponding to an EC value of about 50 dS/m. After
planting, crops were allowed to germinate under fresh water conditions
before the salt treatment started.
Soil salinity
The soil salinity is expressed in the electric conductivity of the extract of a saturated soil paste (ECe in dS/m).
Author Schleiff presented a classification of salt tolerance of crops based on ECe in dS/m [5] that may be summarized as follows:
| Salt tolerance ECe (dS/m) ^) |
Tolerance classification |
|---|---|
| < 2 | very sensitive |
| 2 – 4 | sensitive |
| 4 – 6 | slightly sensitive |
| 6 – 8 | moderately tolerant |
| 8 – 10 | tolerant |
| > 10 | very tolerant |
^) The crop performs well (no yield reduction) up to the soil
salinity level listed in the table. Beyond that level, the yield goes
down.
The main difference with the classification published by Richards in the USDA Agriculture Handbook No. 60, 1954 is that the classes are narrower with steps of 2 dS/m instead of 4.
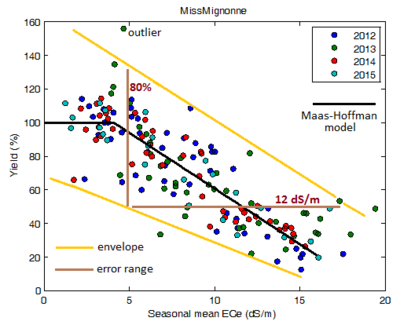
Maas–Hoffman model fitted to a data set.
In this example the crop has a salt tolerance (threshold) of ECe=7 dS/m beyond which the yield declines.
In this example the crop has a salt tolerance (threshold) of ECe=7 dS/m beyond which the yield declines.
Data
from Salt Farm Brochure. Boundaries (yellow) and error ranges (brown)
have been added. The scatter is quite high. It is not known whether the
yield percentages were computed year by year (A), or for all years
combined (B). In case B the error ranges are still larger due to annual
yield differences. No analysis of variance
(Anova) was done to prove that the Maas-Hoffman model really is a
statistically significant improvement over a simple, straightforward,
downward sloping linear regression model.
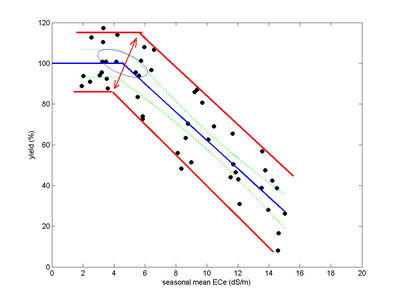
The
Salt Farm Texel also published a graph of the yield-salinity relation
of white cabbage. Boundary lines were added separately in red color. The
boundaries suggest that the slope of the ellipse encompassing the
confidence area of the breakpoint should be upward to the right instead
of to the left. However the Texel document does not give an explanation
of the construction of the ellipse.
Modeling
The Salt Farm Texel uses the Maas–Hoffman model for crop response to soil salinity.
The model uses a response function starting with a horizontal line
connected furtheron to a downward sloping line. The connection point is
also called threshold or tolerance. Up to the threshold the crop is not
affected by soil salinity while beyond it the yield starts declining.
The model is fitted to the data by piecewise linear regression.
Results
| Crop | Variety ^) | Threshold *) (ECe in dS/m) |
Class |
|---|---|---|---|
| Potato x) | Mignonne #) | 4.1 | slightly sensitive |
| Achilles | 2.9 | sensitive | |
| Foc | 2.1 | sensitive | |
| Met | 1.9 | very sensitive | |
| "927" | 3.4 | sensitive | |
| Carrot | Cas | 4.5 | slightly sensitive |
| Ner | 3.6 | sensitive | |
| Nat | < 1 | very sensitive | |
| Ben | < 1 | very sensitive | |
| "101" | 3.0 | sensitive | |
| "102" | 5.0 | slightly sensitive | |
| Pri | 2.1 | sensitive | |
| Onion | Alo | 2.4 | sensitive |
| Red | 5.9 | slightly sensitive | |
| San | 3.2 | sensitive | |
| Hyb | 3.4 | sensitive | |
| Lettuce | Batavia H | < 1 | very sensitive |
| Batavia S | 2.3 | sensitive | |
| Butterhead L | 1.8 | very sensitive | |
| Cabbage | White cabbage #) | 4.6 | slightly sensitive |
| Broccoli | 5.6 | slightly sensitive | |
| Barley | Que 2014 | 3.3 | sensitive +) |
| Que 2015 | 1.7 | very sensitive +) |
^) Many variety names are uncommon as they consist of 3 letters only
*) It is not known what the results would have been if the planting was not done under fresh water conditions but in saline conditions.
#) Graphs with scatter plots are shown in the report for these two varieties only. They show considerable variation both in Y (Yield) and X (ECe) direction.
x) For potato only one comparable value is known in literature, namely for the very sensitive variety white rose having a threshold of 1.7 dS/m
+) For barley, in contrast, the U.S. Salinity Laboratory mentions a threshold value of ECe = 8 dS/m, which makes it a tolerant crop
Summary
The
highest tolerance is found for the onion variety "Red" which classifies
as slightly sensitive. All crops classify in the range from very
sensitive over sensitive to slightly sensitive. There is no crop
classified as tolerant, not even moderately tolerant.
S-curve model
In the Texel report, also the Van Genuchten-Gupta model (giving an S-curve) was used to find the soil salinity at the 90% yield point. The rationale for this was not given.
Lentils
Lentils
The Mediterranean Agronomic Institute, Valenzano, Bari, Italy South coast grew 5 cultivars of lentil
irrigated with sea water of different salinity levels. Saline water
was prepared by mixing fresh water (EC = 0.9 dS/m) with sea water
(EC = 48 dS/m) to achieve salinity levels of 3.0, 6.0, 9.0 and 12.0
dS/m. Some of the results are shown in the following table:
| Salinity (dS/m) |
Relative seedling length in % (control = 100%) by cultivar | ||||
|---|---|---|---|---|---|
| ILL4400 | ILL5582 | ILL5845 | ILL5883 | ILL8006 | |
| 3 | 98 | 83 | 82 | 98 | 96 |
| 6 | 70 | 43 | 78 | 90 | 83 |
| 9 | 57 | 48 | 63 | 52 | 62 |
| 12 | 36 | 40 | 38 | 30 | 43 |
Halophytes
Turtleweed
Halophytes,
or salt loving plants, can be irrigated with pure seawater with the aim
to grow fodder crops. A trial was made by Glenn et al. to use
halophytes for feeding of sheep and it was concluded that the animals
thrived well.
Setting the yield of an alfalfa (lucerne) fodder crop irrigated with fresh water (2 kg/m2) at 100%, the following results were obtained for the yield of halophytic crops irrigated with seawater:
| Crop | Relative yield (%) |
|---|---|
| Atriplex lentiformis, Quailbush | 90 |
| Pickleweed, Turtleweed | 89 |
| Suaeda, Sea blite | 88 |
| Glasswort, Salicornia | 87 |
| Sesuvium, Sea purslane | 85 |
| Distichlis palmeri , Palmers grass | 65 |
| Atriplex cinerea , Coast salt bush | 45 |
Barley (Hordeum vulgare)
Barley
After selecting the most salt tolerant strains, the University of California at Davis has grown barley
irrigated with pure seawater and obtained half the normal yield per
acre, i.e. half of the average yield per acre at national level. The experiment was conducted at Bodega Bay, North of San Francisco, in a laboratory on the Pacific Ocean.
Rice
A team led by
Liu Shiping, a professor of agriculture at Yangzhou University, created
rice varieties that can be grown in salt water, and achieve yields of
6.5 to 9.3 tons per hectare.[12][13]
Lettuce, Chard and Chicory
In
a recent trial comparing three seawater and freshwater blends (i.e.
5%–10%–15% of seawater), some scientists found that lettuce productivity
was negatively affected by 10% and 15% of seawater, whereas chard and
chicory’s growth was not affected by any blend. Interestingly, water
consumptions dropped and WUE significantly upturned in every tested crop
accordingly with increased seawater concentrations. They concluded that
certain amounts of seawater can be practically used in hydroponics,
allowing freshwater saving and increasing certain mineral nutrients
concentrations.


