Search This Blog

Wednesday, December 18, 2024

Wien's displacement law

From Wikipedia, the free encyclopedia
https://en.wikipedia.org/wiki/Wien%27s_displacement_law
Black-body radiation as a function of wavelength for various temperatures. Each temperature curve peaks at a different wavelength and Wien's law describes the shift of that peak.
There are a variety of ways of associating a characteristic wavelength or frequency with the Planck black-body emission spectrum. Each of these metrics scales similarly with temperature, a principle referred to as Wien's displacement law. For different versions of the law, the proportionality constant differs—so, for a given temperature, there is no unique characteristic wavelength or frequency.

In physics, Wien's displacement law states that the black-body radiation curve for different temperatures will peak at different wavelengths that are inversely proportional to the temperature. The shift of that peak is a direct consequence of the Planck radiation law, which describes the spectral brightness or intensity of black-body radiation as a function of wavelength at any given temperature. However, it had been discovered by German physicist Wilhelm Wien several years before Max Planck developed that more general equation, and describes the entire shift of the spectrum of black-body radiation toward shorter wavelengths as temperature increases.

Formally, the wavelength version of Wien's displacement law states that the spectral radiance of black-body radiation per unit wavelength, peaks at the wavelength given by: where T is the absolute temperature and b is a constant of proportionality called Wien's displacement constant, equal to 2.897771955...×10−3 m⋅K, or b ≈ 2898 μm⋅K.

This is an inverse relationship between wavelength and temperature. So the higher the temperature, the shorter or smaller the wavelength of the thermal radiation. The lower the temperature, the longer or larger the wavelength of the thermal radiation. For visible radiation, hot objects emit bluer light than cool objects. If one is considering the peak of black body emission per unit frequency or per proportional bandwidth, one must use a different proportionality constant. However, the form of the law remains the same: the peak wavelength is inversely proportional to temperature, and the peak frequency is directly proportional to temperature.

There are other formulations of Wien's displacement law, which are parameterized relative to other quantities. For these alternate formulations, the form of the relationship is similar, but the proportionality constant, b, differs.

Wien's displacement law may be referred to as "Wien's law", a term which is also used for the Wien approximation.

In "Wien's displacement law", the word displacement refers to how the intensity-wavelength graphs appear shifted (displaced) for different temperatures.

Examples

Blacksmiths work iron when it is hot enough to emit plainly visible thermal radiation.
The color of a star is determined by its temperature, according to Wien's law. In the constellation of Orion, one can compare Betelgeuse (T ≈ 3800 K, upper left), Rigel (T = 12100 K, bottom right), Bellatrix (T = 22000 K, upper right), and Mintaka (T = 31800 K, rightmost of the 3 "belt stars" in the middle).

Wien's displacement law is relevant to some everyday experiences:

  • A piece of metal heated by a blow torch first becomes "red hot" as the very longest visible wavelengths appear red, then becomes more orange-red as the temperature is increased, and at very high temperatures would be described as "white hot" as shorter and shorter wavelengths come to predominate the black body emission spectrum. Before it had even reached the red hot temperature, the thermal emission was mainly at longer infrared wavelengths, which are not visible; nevertheless, that radiation could be felt as it warms one's nearby skin.
  • One easily observes changes in the color of an incandescent light bulb (which produces light through thermal radiation) as the temperature of its filament is varied by a light dimmer. As the light is dimmed and the filament temperature decreases, the distribution of color shifts toward longer wavelengths and the light appears redder, as well as dimmer.
  • A wood fire at 1500 K puts out peak radiation at about 2000 nanometers. 98% of its radiation is at wavelengths longer than 1000 nm, and only a tiny proportion at visible wavelengths (390–700 nanometers). Consequently, a campfire can keep one warm but is a poor source of visible light.
  • The effective temperature of the Sun is 5778 Kelvin. Using Wien's law, one finds a peak emission per nanometer (of wavelength) at a wavelength of about 500 nm, in the green portion of the spectrum near the peak sensitivity of the human eye. On the other hand, in terms of power per unit optical frequency, the Sun's peak emission is at 343 THz or a wavelength of 883 nm in the near infrared. In terms of power per percentage bandwidth, the peak is at about 635 nm, a red wavelength. About half of the Sun's radiation is at wavelengths shorter than 710 nm, about the limit of the human vision. Of that, about 12% is at wavelengths shorter than 400 nm, ultraviolet wavelengths, which is invisible to an unaided human eye. A large amount of the Sun's radiation falls in the fairly small visible spectrum and passes through the atmosphere.
  • The preponderance of emission in the visible range, however, is not the case in most stars. The hot supergiant Rigel emits 60% of its light in the ultraviolet, while the cool supergiant Betelgeuse emits 85% of its light at infrared wavelengths. With both stars prominent in the constellation of Orion, one can easily appreciate the color difference between the blue-white Rigel (T = 12100 K) and the red Betelgeuse (T ≈ 3800 K). While few stars are as hot as Rigel, stars cooler than the Sun or even as cool as Betelgeuse are very commonplace.
  • Mammals with a skin temperature of about 300 K emit peak radiation at around 10 μm in the far infrared. This is therefore the range of infrared wavelengths that pit viper snakes and passive IR cameras must sense.
  • When comparing the apparent color of lighting sources (including fluorescent lights, LED lighting, computer monitors, and photoflash), it is customary to cite the color temperature. Although the spectra of such lights are not accurately described by the black-body radiation curve, a color temperature (the correlated color temperature) is quoted for which black-body radiation would most closely match the subjective color of that source. For instance, the blue-white fluorescent light sometimes used in an office may have a color temperature of 6500 K, whereas the reddish tint of a dimmed incandescent light may have a color temperature (and an actual filament temperature) of 2000 K. Note that the informal description of the former (bluish) color as "cool" and the latter (reddish) as "warm" is exactly opposite the actual temperature change involved in black-body radiation.

Discovery

The law is named for Wilhelm Wien, who derived it in 1893 based on a thermodynamic argument. Wien considered adiabatic expansion of a cavity containing waves of light in thermal equilibrium. Using Doppler's principle, he showed that, under slow expansion or contraction, the energy of light reflecting off the walls changes in exactly the same way as the frequency. A general principle of thermodynamics is that a thermal equilibrium state, when expanded very slowly, stays in thermal equilibrium.

Wien himself deduced this law theoretically in 1893, following Boltzmann's thermodynamic reasoning. It had previously been observed, at least semi-quantitatively, by an American astronomer, Langley. This upward shift in with is familiar to everyone—when an iron is heated in a fire, the first visible radiation (at around 900 K) is deep red, the lowest frequency visible light. Further increase in causes the color to change to orange then yellow, and finally blue at very high temperatures (10,000 K or more) for which the peak in radiation intensity has moved beyond the visible into the ultraviolet.

The adiabatic principle allowed Wien to conclude that for each mode, the adiabatic invariant energy/frequency is only a function of the other adiabatic invariant, the frequency/temperature. From this, he derived the "strong version" of Wien's displacement law: the statement that the blackbody spectral radiance is proportional to for some function F of a single variable. A modern variant of Wien's derivation can be found in the textbook by Wannier and in a paper by E. Buckingham

The consequence is that the shape of the black-body radiation function (which was not yet understood) would shift proportionally in frequency (or inversely proportionally in wavelength) with temperature. When Max Planck later formulated the correct black-body radiation function it did not explicitly include Wien's constant . Rather, the Planck constant was created and introduced into his new formula. From the Planck constant and the Boltzmann constant , Wien's constant can be obtained.

Peak differs according to parameterization

Constants for different parameterizations of Wien's law
Parameterized by x b (μm⋅K)
Wavelength, 4.965114231744276303... 2898
or 3.920690394872886343... 3670
Frequency, 2.821439372122078893... 5099
Other characterizations of spectrum
Parameterized by x b (μm⋅K)
Mean photon energy 2.701... 5327
10% percentile 6.553... 2195
25% percentile 4.965... 2898
50% percentile 3.503... 4107
70% percentile 2.574... 5590
90% percentile 1.534... 9376

The results in the tables above summarize results from other sections of this article. Percentiles are percentiles of the Planck blackbody spectrum. Only 25 percent of the energy in the black-body spectrum is associated with wavelengths shorter than the value given by the peak-wavelength version of Wien's law.

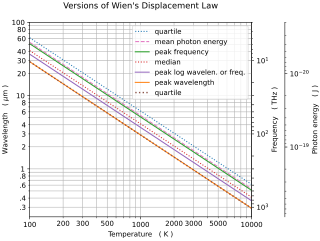
Planck blackbody spectrum parameterized by wavelength, fractional bandwidth (log wavelength or log frequency), and frequency, for a temperature of 6000 K

Notice that for a given temperature, different parameterizations imply different maximal wavelengths. In particular, the curve of intensity per unit frequency peaks at a different wavelength than the curve of intensity per unit wavelength.

For example, using = 6,000 K (5,730 °C; 10,340 °F) and parameterization by wavelength, the wavelength for maximal spectral radiance is = 482.962 nm with corresponding frequency = 620.737 THz. For the same temperature, but parameterizing by frequency, the frequency for maximal spectral radiance is = 352.735 THz with corresponding wavelength = 849.907 nm.

These functions are radiance density functions, which are probability density functions scaled to give units of radiance. The density function has different shapes for different parameterizations, depending on relative stretching or compression of the abscissa, which measures the change in probability density relative to a linear change in a given parameter. Since wavelength and frequency have a reciprocal relation, they represent significantly non-linear shifts in probability density relative to one another.

The total radiance is the integral of the distribution over all positive values, and that is invariant for a given temperature under any parameterization. Additionally, for a given temperature the radiance consisting of all photons between two wavelengths must be the same regardless of which distribution you use. That is to say, integrating the wavelength distribution from to will result in the same value as integrating the frequency distribution between the two frequencies that correspond to and , namely from to . However, the distribution shape depends on the parameterization, and for a different parameterization the distribution will typically have a different peak density, as these calculations demonstrate.

The important point of Wien's law, however, is that any such wavelength marker, including the median wavelength (or, alternatively, the wavelength below which any specified percentage of the emission occurs) is proportional to the reciprocal of temperature. That is, the shape of the distribution for a given parameterization scales with and translates according to temperature, and can be calculated once for a canonical temperature, then appropriately shifted and scaled to obtain the distribution for another temperature. This is a consequence of the strong statement of Wien's law.

Frequency-dependent formulation

For spectral flux considered per unit frequency (in hertz), Wien's displacement law describes a peak emission at the optical frequency given by: or equivalently where = 2.821439372122078893... is a constant resulting from the maximization equation, k is the Boltzmann constant, h is the Planck constant, and T is the absolute temperature. With the emission now considered per unit frequency, this peak now corresponds to a wavelength about 76% longer than the peak considered per unit wavelength. The relevant math is detailed in the next section.

Derivation from Planck's law

Parameterization by wavelength

Planck's law for the spectrum of black-body radiation predicts the Wien displacement law and may be used to numerically evaluate the constant relating temperature and the peak parameter value for any particular parameterization. Commonly a wavelength parameterization is used and in that case the black body spectral radiance (power per emitting area per solid angle) is:

Differentiating with respect to and setting the derivative equal to zero gives: which can be simplified to give:

By defining: the equation becomes one in the single variable x: which is equivalent to:

This equation is solved by where is the principal branch of the Lambert W function, and gives 4.965114231744276303.... Solving for the wavelength in millimetres, and using kelvins for the temperature yields:

(2.897771955185172661... mm⋅K).

Parameterization by frequency

Another common parameterization is by frequency. The derivation yielding peak parameter value is similar, but starts with the form of Planck's law as a function of frequency :

The preceding process using this equation yields: The net result is: This is similarly solved with the Lambert W function: giving = 2.821439372122078893....

Solving for produces:

(0.05878925757646824946... THz⋅K−1).

Parameterization by the logarithm of wavelength or frequency

Using the implicit equation yields the peak in the spectral radiance density function expressed in the parameter radiance per proportional bandwidth. (That is, the density of irradiance per frequency bandwidth proportional to the frequency itself, which can be calculated by considering infinitesimal intervals of (or equivalently ) rather of frequency itself.) This is perhaps a more intuitive way of presenting "wavelength of peak emission". That yields = 3.920690394872886343....

Mean photon energy as an alternate characterization

Another way of characterizing the radiance distribution is via the mean photon energy where is the Riemann zeta function. The wavelength corresponding to the mean photon energy is given by

Criticism

Marr and Wilkin (2012) contend that the widespread teaching of Wien's displacement law in introductory courses is undesirable, and it would be better replaced by alternate material. They argue that teaching the law is problematic because:

  1. the Planck curve is too broad for the peak to stand out or be regarded as significant;
  2. the location of the peak depends on the parameterization, and they cite several sources as concurring that "that the designation of any peak of the function is not meaningful and should, therefore, be de-emphasized";
  3. the law is not used for determining temperatures in actual practice, direct use of the Planck function being relied upon instead.
They suggest that the average photon energy be presented in place of Wien's displacement law, as being a more physically meaningful indicator of changes that occur with changing temperature. In connection with this, they recommend that the average number of photons per second be discussed in connection with the Stefan–Boltzmann law. They recommend that the Planck spectrum be plotted as a "spectral energy density per fractional bandwidth distribution," using a logarithmic scale for the wavelength or frequency.

Spectral radiance

From Wikipedia, the free encyclopedia
https://en.wikipedia.org/wiki/Spectral_radiance

In radiometry, spectral radiance or specific intensity is the radiance of a surface per unit frequency or wavelength, depending on whether the spectrum is taken as a function of frequency or of wavelength. The SI unit of spectral radiance in frequency is the watt per steradian per square metre per hertz (W·sr−1·m−2·Hz−1) and that of spectral radiance in wavelength is the watt per steradian per square metre per metre (W·sr−1·m−3)—commonly the watt per steradian per square metre per nanometre (W·sr−1·m−2·nm−1). The microflick is also used to measure spectral radiance in some fields.

Spectral radiance gives a full radiometric description of the field of classical electromagnetic radiation of any kind, including thermal radiation and light. It is conceptually distinct from the descriptions in explicit terms of Maxwellian electromagnetic fields or of photon distribution. It refers to material physics as distinct from psychophysics.

For the concept of specific intensity, the line of propagation of radiation lies in a semi-transparent medium which varies continuously in its optical properties. The concept refers to an area, projected from the element of source area into a plane at right angles to the line of propagation, and to an element of solid angle subtended by the detector at the element of source area.

The term brightness is also sometimes used for this concept. The SI system states that the word brightness should not be so used, but should instead refer only to psychophysics.

The geometry for the definition of specific (radiative) intensity. Note the potential in the geometry for laws of reciprocity.

Definition

The specific (radiative) intensity is a quantity that describes the rate of radiative transfer of energy at P1, a point of space with coordinates x, at time t. It is a scalar-valued function of four variables, customarily written as where:

  • ν denotes frequency.
  • r1 denotes a unit vector, with the direction and sense of the geometrical vector r in the line of propagation from
  • the effective source point P1, to
  • a detection point P2.

I (x, t ; r1, ν) is defined to be such that a virtual source area, dA1, containing the point P1 , is an apparent emitter of a small but finite amount of energy dE transported by radiation of frequencies (ν, ν + ) in a small time duration dt , where and where θ1 is the angle between the line of propagation r and the normal P1N1 to dA1; the effective destination of dE is a finite small area dA2 , containing the point P2 , that defines a finite small solid angle dΩ1 about P1 in the direction of r. The cosine accounts for the projection of the source area dA1 into a plane at right angles to the line of propagation indicated by r.

The use of the differential notation for areas dAi indicates they are very small compared to r2, the square of the magnitude of vector r, and thus the solid angles dΩi are also small.

There is no radiation that is attributed to P1 itself as its source, because P1 is a geometrical point with no magnitude. A finite area is needed to emit a finite amount of light.

Invariance

For propagation of light in a vacuum, the definition of specific (radiative) intensity implicitly allows for the inverse square law of radiative propagation. The concept of specific (radiative) intensity of a source at the point P1 presumes that the destination detector at the point P2 has optical devices (telescopic lenses and so forth) that can resolve the details of the source area dA1. Then the specific radiative intensity of the source is independent of the distance from source to detector; it is a property of the source alone. This is because it is defined per unit solid angle, the definition of which refers to the area dA2 of the detecting surface.

This may be understood by looking at the diagram. The factor cos θ1 has the effect of converting the effective emitting area dA1 into a virtual projected area cos θ1 dA1 = r2 dΩ2 at right angles to the vector r from source to detector. The solid angle dΩ1 also has the effect of converting the detecting area dA2 into a virtual projected area cos θ2 dA2 = r2 dΩ1 at right angles to the vector r , so that dΩ1 = cos θ2 dA2 / r2 . Substituting this for dΩ1 in the above expression for the collected energy dE, one finds dE = I (x, t ; r1, ν) cos θ1 dA1 cos θ2 dA2 dt / r2: when the emitting and detecting areas and angles dA1 and dA2, θ1 and θ2, are held constant, the collected energy dE is inversely proportional to the square of the distance r between them, with invariant I (x, t ; r1, ν) .

This may be expressed also by the statement that I (x, t ; r1, ν) is invariant with respect to the length r of r ; that is to say, provided the optical devices have adequate resolution, and that the transmitting medium is perfectly transparent, as for example a vacuum, then the specific intensity of the source is unaffected by the length r of the ray r.

For the propagation of light in a transparent medium with a non-unit non-uniform refractive index, the invariant quantity along a ray is the specific intensity divided by the square of the absolute refractive index.

Reciprocity

For the propagation of light in a semi-transparent medium, specific intensity is not invariant along a ray, because of absorption and emission. Nevertheless, the Stokes-Helmholtz reversion-reciprocity principle applies, because absorption and emission are the same for both senses of a given direction at a point in a stationary medium.

Étendue and reciprocity

The term étendue is used to focus attention specifically on the geometrical aspects. The reciprocal character of étendue is indicated in the article about it. Étendue is defined as a second differential. In the notation of the present article, the second differential of the étendue, d2G , of the pencil of light which "connects" the two surface elements dA1 and dA2 is defined as

This can help understand the geometrical aspects of the Stokes-Helmholtz reversion-reciprocity principle.

Collimated beam

For the present purposes, the light from a star can be treated as a practically collimated beam, but apart from this, a collimated beam is rarely if ever found in nature, though artificially produced beams can be very nearly collimated. For some purposes the rays of the sun can be considered as practically collimated, because the sun subtends an angle of only 32′ of arc. The specific (radiative) intensity is suitable for the description of an uncollimated radiative field. The integrals of specific (radiative) intensity with respect to solid angle, used for the definition of spectral flux density, are singular for exactly collimated beams, or may be viewed as Dirac delta functions. Therefore, the specific (radiative) intensity is unsuitable for the description of a collimated beam, while spectral flux density is suitable for that purpose.

Rays

Specific (radiative) intensity is built on the idea of a pencil of rays of light.

In an optically isotropic medium, the rays are normals to the wavefronts, but in an optically anisotropic crystalline medium, they are in general at angles to those normals. That is to say, in an optically anisotropic crystal, the energy does not in general propagate at right angles to the wavefronts.

Alternative approaches

The specific (radiative) intensity is a radiometric concept. Related to it is the intensity in terms of the photon distribution function, which uses the metaphor of a particle of light that traces the path of a ray.

The idea common to the photon and the radiometric concepts is that the energy travels along rays.

Another way to describe the radiative field is in terms of the Maxwell electromagnetic field, which includes the concept of the wavefront. The rays of the radiometric and photon concepts are along the time-averaged Poynting vector of the Maxwell field. In an anisotropic medium, the rays are not in general perpendicular to the wavefront.


Radiance

From Wikipedia, the free encyclopedia

In radiometry, radiance is the radiant flux emitted, reflected, transmitted or received by a given surface, per unit solid angle per unit projected area. Radiance is used to characterize diffuse emission and reflection of electromagnetic radiation, and to quantify emission of neutrinos and other particles. The SI unit of radiance is the watt per steradian per square metre (W·sr−1·m−2). It is a directional quantity: the radiance of a surface depends on the direction from which it is being observed.

The related quantity spectral radiance is the radiance of a surface per unit frequency or wavelength, depending on whether the spectrum is taken as a function of frequency or of wavelength.

Historically, radiance was called "intensity" and spectral radiance was called "specific intensity". Many fields still use this nomenclature. It is especially dominant in heat transfer, astrophysics and astronomy. "Intensity" has many other meanings in physics, with the most common being power per unit area (so the radiance is the intensity per solid angle in this case).

Description

Comparison of photometric and radiometric quantities

Radiance is useful because it indicates how much of the power emitted, reflected, transmitted or received by a surface will be received by an optical system looking at that surface from a specified angle of view. In this case, the solid angle of interest is the solid angle subtended by the optical system's entrance pupil. Since the eye is an optical system, radiance and its cousin luminance are good indicators of how bright an object will appear. For this reason, radiance and luminance are both sometimes called "brightness". This usage is now discouraged (see the article Brightness for a discussion). The nonstandard usage of "brightness" for "radiance" persists in some fields, notably laser physics.

The radiance divided by the index of refraction squared is invariant in geometric optics. This means that for an ideal optical system in air, the radiance at the output is the same as the input radiance. This is sometimes called conservation of radiance. For real, passive, optical systems, the output radiance is at most equal to the input, unless the index of refraction changes. As an example, if you form a demagnified image with a lens, the optical power is concentrated into a smaller area, so the irradiance is higher at the image. The light at the image plane, however, fills a larger solid angle so the radiance comes out to be the same assuming there is no loss at the lens.

Spectral radiance expresses radiance as a function of frequency or wavelength. Radiance is the integral of the spectral radiance over all frequencies or wavelengths. For radiation emitted by the surface of an ideal black body at a given temperature, spectral radiance is governed by Planck's law, while the integral of its radiance, over the hemisphere into which its surface radiates, is given by the Stefan–Boltzmann law. Its surface is Lambertian, so that its radiance is uniform with respect to angle of view, and is simply the Stefan–Boltzmann integral divided by π. This factor is obtained from the solid angle 2π steradians of a hemisphere decreased by integration over the cosine of the zenith angle.

Mathematical definitions

Radiance

Radiance of a surface, denoted Le,Ω ("e" for "energetic", to avoid confusion with photometric quantities, and "Ω" to indicate this is a directional quantity), is defined as

where

In general Le,Ω is a function of viewing direction, depending on θ through cos θ and azimuth angle through ∂Φe/∂Ω. For the special case of a Lambertian surface, 2Φe/(∂Ω ∂A) is proportional to cos θ, and Le,Ω is isotropic (independent of viewing direction).

When calculating the radiance emitted by a source, A refers to an area on the surface of the source, and Ω to the solid angle into which the light is emitted. When calculating radiance received by a detector, A refers to an area on the surface of the detector and Ω to the solid angle subtended by the source as viewed from that detector. When radiance is conserved, as discussed above, the radiance emitted by a source is the same as that received by a detector observing it.

Spectral radiance

Spectral radiance in frequency of a surface, denoted Le,Ω,ν, is defined as

where ν is the frequency.

Spectral radiance in wavelength of a surface, denoted Le,Ω,λ, is defined as

where λ is the wavelength.

Conservation of basic radiance

Radiance of a surface is related to étendue by

where

  • n is the refractive index in which that surface is immersed;
  • G is the étendue of the light beam.

As the light travels through an ideal optical system, both the étendue and the radiant flux are conserved. Therefore, basic radiance defined by

is also conserved. In real systems, the étendue may increase (for example due to scattering) or the radiant flux may decrease (for example due to absorption) and, therefore, basic radiance may decrease. However, étendue may not decrease and radiant flux may not increase and, therefore, basic radiance may not increase.

Luminance

From Wikipedia, the free encyclopedia
https://en.wikipedia.org/wiki/Luminance
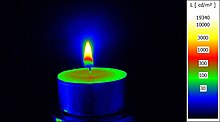
A tea light-type candle, imaged with a luminance camera; false colors indicate luminance levels per the bar on the right (cd/m2)

Luminance is a photometric measure of the luminous intensity per unit area of light travelling in a given direction. It describes the amount of light that passes through, is emitted from, or is reflected from a particular area, and falls within a given solid angle.

The procedure for conversion from spectral radiance to luminance is standardized by the CIE and ISO.

Brightness is the term for the subjective impression of the objective luminance measurement standard (see Objectivity (science) § Objectivity in measurement for the importance of this contrast).

The SI unit for luminance is candela per square metre (cd/m2). A non-SI term for the same unit is the nit. The unit in the Centimetre–gram–second system of units (CGS) (which predated the SI system) is the stilb, which is equal to one candela per square centimetre or 10 kcd/m2.

Description

Luminance is often used to characterize emission or reflection from flat, diffuse surfaces. Luminance levels indicate how much luminous power could be detected by the human eye looking at a particular surface from a particular angle of view. Luminance is thus an indicator of how bright the surface will appear. In this case, the solid angle of interest is the solid angle subtended by the eye's pupil.

Luminance is used in the video industry to characterize the brightness of displays. A typical computer display emits between 50 and 300 cd/m2. The sun has a luminance of about 1.6×10⁹ cd/m2 at noon.

Luminance is invariant in geometric optics. This means that for an ideal optical system, the luminance at the output is the same as the input luminance.

For real, passive optical systems, the output luminance is at most equal to the input. As an example, if one uses a lens to form an image that is smaller than the source object, the luminous power is concentrated into a smaller area, meaning that the illuminance is higher at the image. The light at the image plane, however, fills a larger solid angle so the luminance comes out to be the same assuming there is no loss at the lens. The image can never be "brighter" than the source.

Health effects

Retinal damage can occur when the eye is exposed to high luminance. Damage can occur because of local heating of the retina. Photochemical effects can also cause damage, especially at short wavelengths.

The IEC 60825 series gives guidance on safety relating to exposure of the eye to lasers, which are high luminance sources. The IEC 62471 series gives guidance for evaluating the photobiological safety of lamps and lamp systems including luminaires. Specifically it specifies the exposure limits, reference measurement technique and classification scheme for the evaluation and control of photobiological hazards from all electrically powered incoherent broadband sources of optical radiation, including LEDs but excluding lasers, in the wavelength range from 200 nm through 3000 nm. This standard was prepared as Standard CIE S 009:2002 by the International Commission on Illumination.

Luminance meter

A luminance meter is a device used in photometry that can measure the luminance in a particular direction and with a particular solid angle. The simplest devices measure the luminance in a single direction while imaging luminance meters measure luminance in a way similar to the way a digital camera records color images.

Formulation

Parameters for defining the luminance

The luminance of a specified point of a light source, in a specified direction, is defined by the mixed partial derivative where

  • Lv is the luminance (cd/m2);
  • d2Φv is the luminous flux (lm) leaving the area in any direction contained inside the solid angle Σ;
  • is an infinitesimal area (m2) of the source containing the specified point;
  • Σ is an infinitesimal solid angle (sr) containing the specified direction; and
  • θΣ is the angle between the normal nΣ to the surface and the specified direction.

If light travels through a lossless medium, the luminance does not change along a given light ray. As the ray crosses an arbitrary surface S, the luminance is given by where

  • dS is the infinitesimal area of S seen from the source inside the solid angle Σ;
  • S is the infinitesimal solid angle subtended by as seen from dS; and
  • θS is the angle between the normal nS to dS and the direction of the light.

More generally, the luminance along a light ray can be defined as where

  • dG is the etendue of an infinitesimally narrow beam containing the specified ray;
  • v is the luminous flux carried by this beam; and
  • n is the index of refraction of the medium.

Relation to illuminance

Comparison of photometric and radiometric quantities

The luminance of a reflecting surface is related to the illuminance it receives: where the integral covers all the directions of emission ΩΣ,

In the case of a perfectly diffuse reflector (also called a Lambertian reflector), the luminance is isotropic, per Lambert's cosine law. Then the relationship is simply

Units

A variety of units have been used for luminance, besides the candela per square metre. Luminance is essentially the same as surface brightness, the term used in astronomy. This is measured with a logarithmic scale, magnitudes per square arcsecond (MPSAS).

Super-resolution imaging

From Wikipedia, the free encyclopedia

Super-resolution imaging (SR) is a class of techniques that enhance (increase) the resolution of an imaging system. In optical SR the diffraction limit of systems is transcended, while in geometrical SR the resolution of digital imaging sensors is enhanced.

In some radar and sonar imaging applications (e.g. magnetic resonance imaging (MRI), high-resolution computed tomography), subspace decomposition-based methods (e.g. MUSIC) and compressed sensing-based algorithms (e.g., SAMV) are employed to achieve SR over standard periodogram algorithm.

Super-resolution imaging techniques are used in general image processing and in super-resolution microscopy.

Basic concepts

Because some of the ideas surrounding super-resolution raise fundamental issues, there is need at the outset to examine the relevant physical and information-theoretical principles:

  • Diffraction limit: The detail of a physical object that an optical instrument can reproduce in an image has limits that are mandated by laws of physics, whether formulated by the diffraction equations in the wave theory of light or equivalently the uncertainty principle for photons in quantum mechanics. Information transfer can never be increased beyond this boundary, but packets outside the limits can be cleverly swapped for (or multiplexed with) some inside it. One does not so much “break” as “run around” the diffraction limit. New procedures probing electro-magnetic disturbances at the molecular level (in the so-called near field) remain fully consistent with Maxwell's equations.
    • Spatial-frequency domain: A succinct expression of the diffraction limit is given in the spatial-frequency domain. In Fourier optics light distributions are expressed as superpositions of a series of grating light patterns in a range of fringe widths, technically spatial frequencies. It is generally taught that diffraction theory stipulates an upper limit, the cut-off spatial-frequency, beyond which pattern elements fail to be transferred into the optical image, i.e., are not resolved. But in fact what is set by diffraction theory is the width of the passband, not a fixed upper limit. No laws of physics are broken when a spatial frequency band beyond the cut-off spatial frequency is swapped for one inside it: this has long been implemented in dark-field microscopy. Nor are information-theoretical rules broken when superimposing several bands,[7][8][9] disentangling them in the received image needs assumptions of object invariance during multiple exposures, i.e., the substitution of one kind of uncertainty for another.
  • Information: When the term super-resolution is used in techniques of inferring object details from statistical treatment of the image within standard resolution limits, for example, averaging multiple exposures, it involves an exchange of one kind of information (extracting signal from noise) for another (the assumption that the target has remained invariant).
  • Resolution and localization: True resolution involves the distinction of whether a target, e.g. a star or a spectral line, is single or double, ordinarily requiring separable peaks in the image. When a target is known to be single, its location can be determined with higher precision than the image width by finding the centroid (center of gravity) of its image light distribution. The word ultra-resolution had been proposed for this process but it did not catch on, and the high-precision localization procedure is typically referred to as super-resolution.

The technical achievements of enhancing the performance of imaging-forming and –sensing devices now classified as super-resolution use to the fullest but always stay within the bounds imposed by the laws of physics and information theory.

Techniques

Optical or diffractive super-resolution

Substituting spatial-frequency bands: Though the bandwidth allowable by diffraction is fixed, it can be positioned anywhere in the spatial-frequency spectrum. Dark-field illumination in microscopy is an example. See also aperture synthesis.

The "structured illumination" technique of super-resolution is related to moiré patterns. The target, a band of fine fringes (top row), is beyond the diffraction limit. When a band of somewhat coarser resolvable fringes (second row) is artificially superimposed, the combination (third row) features moiré components that are within the diffraction limit and hence contained in the image (bottom row) allowing the presence of the fine fringes to be inferred even though they are not themselves represented in the image.

Multiplexing spatial-frequency bands

An image is formed using the normal passband of the optical device. Then some known light structure, for example a set of light fringes that need not even be within the passband, is superimposed on the target. The image now contains components resulting from the combination of the target and the superimposed light structure, e.g. moiré fringes, and carries information about target detail which simple unstructured illumination does not. The “superresolved” components, however, need disentangling to be revealed. For an example, see structured illumination (figure to left).

Multiple parameter use within traditional diffraction limit

If a target has no special polarization or wavelength properties, two polarization states or non-overlapping wavelength regions can be used to encode target details, one in a spatial-frequency band inside the cut-off limit the other beyond it. Both would use normal passband transmission but are then separately decoded to reconstitute target structure with extended resolution.

Probing near-field electromagnetic disturbance

The usual discussion of super-resolution involved conventional imagery of an object by an optical system. But modern technology allows probing the electromagnetic disturbance within molecular distances of the source which has superior resolution properties, see also evanescent waves and the development of the new super lens.

Geometrical or image-processing super-resolution

Compared to a single image marred by noise during its acquisition or transmission (left), the signal-to-noise ratio is improved by suitable combination of several separately-obtained images (right). This can be achieved only within the intrinsic resolution capability of the imaging process for revealing such detail.

Multi-exposure image noise reduction

When an image is degraded by noise, there can be more detail in the average of many exposures, even within the diffraction limit. See example on the right.

Single-frame deblurring

Known defects in a given imaging situation, such as defocus or aberrations, can sometimes be mitigated in whole or in part by suitable spatial-frequency filtering of even a single image. Such procedures all stay within the diffraction-mandated passband, and do not extend it.

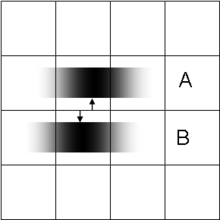
Both features extend over 3 pixels but in different amounts, enabling them to be localized with precision superior to pixel dimension.

Sub-pixel image localization

The location of a single source can be determined by computing the "center of gravity" (centroid) of the light distribution extending over several adjacent pixels (see figure on the left). Provided that there is enough light, this can be achieved with arbitrary precision, very much better than pixel width of the detecting apparatus and the resolution limit for the decision of whether the source is single or double. This technique, which requires the presupposition that all the light comes from a single source, is at the basis of what has become known as super-resolution microscopy, e.g. stochastic optical reconstruction microscopy (STORM), where fluorescent probes attached to molecules give nanoscale distance information. It is also the mechanism underlying visual hyperacuity.

Bayesian induction beyond traditional diffraction limit

Some object features, though beyond the diffraction limit, may be known to be associated with other object features that are within the limits and hence contained in the image. Then conclusions can be drawn, using statistical methods, from the available image data about the presence of the full object. The classical example is Toraldo di Francia's proposition of judging whether an image is that of a single or double star by determining whether its width exceeds the spread from a single star. This can be achieved at separations well below the classical resolution bounds, and requires the prior limitation to the choice "single or double?"

The approach can take the form of extrapolating the image in the frequency domain, by assuming that the object is an analytic function, and that we can exactly know the function values in some interval. This method is severely limited by the ever-present noise in digital imaging systems, but it can work for radar, astronomy, microscopy or magnetic resonance imaging. More recently, a fast single image super-resolution algorithm based on a closed-form solution to problems has been proposed and demonstrated to accelerate most of the existing Bayesian super-resolution methods significantly.

Aliasing

Geometrical SR reconstruction algorithms are possible if and only if the input low resolution images have been under-sampled and therefore contain aliasing. Because of this aliasing, the high-frequency content of the desired reconstruction image is embedded in the low-frequency content of each of the observed images. Given a sufficient number of observation images, and if the set of observations vary in their phase (i.e. if the images of the scene are shifted by a sub-pixel amount), then the phase information can be used to separate the aliased high-frequency content from the true low-frequency content, and the full-resolution image can be accurately reconstructed.

In practice, this frequency-based approach is not used for reconstruction, but even in the case of spatial approaches (e.g. shift-add fusion), the presence of aliasing is still a necessary condition for SR reconstruction.

Technical implementations

There are many both single-frame and multiple-frame variants of SR. Multiple-frame SR uses the sub-pixel shifts between multiple low resolution images of the same scene. It creates an improved resolution image fusing information from all low resolution images, and the created higher resolution images are better descriptions of the scene. Single-frame SR methods attempt to magnify the image without producing blur. These methods use other parts of the low resolution images, or other unrelated images, to guess what the high-resolution image should look like. Algorithms can also be divided by their domain: frequency or space domain. Originally, super-resolution methods worked well only on grayscale images, but researchers have found methods to adapt them to color camera images. Recently, the use of super-resolution for 3D data has also been shown.

Research

There is promising research on using deep convolutional networks to perform super-resolution. In particular work has been demonstrated showing the transformation of a 20x microscope image of pollen grains into a 1500x scanning electron microscope image using it. While this technique can increase the information content of an image, there is no guarantee that the upscaled features exist in the original image and deep convolutional upscalers should not be used in analytical applications with ambiguous inputs. These methods can hallucinate image features, which can make them unsafe for medical use.

Cascadia subduction zone

From Wikipedia, the free encyclopedia https://en.wikipedia.org/wiki/Cascadia_subduction_zone Area of the C...