A hologram is a real world recording of an interference pattern which uses diffraction to reproduce a 3D light field, resulting in an image which still has the depth, parallax, and other properties of the original scene. Holography is the science and practice of making holograms. A hologram is a photographic recording of a light field, rather than an image formed by a lens. The holographic medium, for example the object produced by a holographic process (which may be referred to as a hologram) is usually unintelligible when viewed under diffuse ambient light. It is an encoding of the light field as an interference pattern of variations in the opacity, density, or surface profile of the photographic medium. When suitably lit, the interference pattern diffracts the light into an accurate reproduction of the original light field, and the objects that were in it exhibit visual depth cues such as parallax and perspective that change realistically with the different angles of viewing. That is, the view of the image from different angles represents the subject viewed from similar angles. In this sense, holograms do not have just the illusion of depth but are truly three-dimensional images.
In its pure form, holography needs a laser light for illuminating the subject and for viewing the finished hologram. A microscopic level of detail throughout the recorded scene can be reproduced. In common practice, however, major image quality compromises are made to remove the need for laser illumination to view the hologram, and in some cases, to make it. Holographic portraiture often resorts to a non-holographic intermediate imaging procedure, to avoid the dangerous high-powered pulsed lasers which would be needed to optically "freeze" moving subjects as perfectly as the extremely motion-intolerant holographic recording process requires. Holograms can now also be entirely computer-generated to show objects or scenes that never existed.
Holography is distinct from lenticular and other earlier autostereoscopic 3D display technologies, which can produce superficially similar results but are based on conventional lens imaging. Images requiring the aid of special glasses or other intermediate optics, stage illusions such as Pepper's Ghost and other unusual, baffling, or seemingly magical images are often incorrectly called holograms.
Dennis Gabor invented holography in 1947 and later won a Nobel Prize for his efforts.
Overview and history
The Hungarian-British physicist Dennis Gabor (in Hungarian: Gábor Dénes) was awarded the Nobel Prize in Physics in 1971 "for his invention and development of the holographic method". His work, done in the late 1940s, was built on pioneering work in the field of X-ray microscopy by other scientists including Mieczysław Wolfke in 1920 and William Lawrence Bragg in 1939. This discovery was an unexpected result of research into improving electron microscopes at the British Thomson-Houston Company (BTH) in Rugby, England, and the company filed a patent in December 1947 (patent GB685286). The technique as originally invented is still used in electron microscopy, where it is known as electron holography, but optical holography did not really advance until the development of the laser in 1960. The word holography comes from the Greek words ὅλος (holos; "whole") and γραφή (graphē; "writing" or "drawing").
The development of the laser enabled the first practical optical holograms that recorded 3D objects to be made in 1962 by Yuri Denisyuk in the Soviet Union and by Emmett Leith and Juris Upatnieks at the University of Michigan, USA. Early holograms used silver halide photographic emulsions as the recording medium. They were not very efficient as the produced grating absorbed much of the incident light. Various methods of converting the variation in transmission to a variation in refractive index (known as "bleaching") were developed which enabled much more efficient holograms to be produced.
Several types of holograms can be made. Transmission holograms, such as those produced by Leith and Upatnieks, are viewed by shining laser light through them and looking at the reconstructed image from the side of the hologram opposite the source. A later refinement, the "rainbow transmission" hologram, allows more convenient illumination by white light rather than by lasers. Rainbow holograms are commonly used for security and authentication, for example, on credit cards and product packaging.
Another kind of common hologram, the reflection or Denisyuk hologram, can also be viewed using a white-light illumination source on the same side of the hologram as the viewer and is the type of hologram normally seen in holographic displays. They are also capable of multicolour-image reproduction.
Specular holography is a related technique for making three-dimensional images by controlling the motion of specularities on a two-dimensional surface. It works by reflectively or refractively manipulating bundles of light rays, whereas Gabor-style holography works by diffractively reconstructing wavefronts.
Most holograms produced are of static objects but systems for displaying changing scenes on a holographic volumetric display are now being developed.
Holograms can also be used to store, retrieve, and process information optically.
In its early days, holography required high-power and expensive lasers, but currently, mass-produced low-cost laser diodes, such as those found on DVD recorders and used in other common applications, can be used to make holograms and have made holography much more accessible to low-budget researchers, artists and dedicated hobbyists.
It was thought that it would be possible to use X-rays to make holograms of very small objects and view them using visible light. Today, holograms with x-rays are generated by using synchrotrons or x-ray free-electron lasers as radiation sources and pixelated detectors such as CCDs as recording medium. The reconstruction is then retrieved via computation. Due to the shorter wavelength of x-rays compared to visible light, this approach allows imaging objects with higher spatial resolution. As free-electron lasers can provide ultrashort and x-ray pulses in the range of femtoseconds which are intense and coherent, x-ray holography has been used to capture ultrafast dynamic processes.
How it works
Holography is a technique that enables a light field (which is generally the result of a light source scattered off objects) to be recorded and later reconstructed when the original light field is no longer present, due to the absence of the original objects. Holography can be thought of as somewhat similar to sound recording, whereby a sound field created by vibrating matter like musical instruments or vocal cords, is encoded in such a way that it can be reproduced later, without the presence of the original vibrating matter. However, it is even more similar to Ambisonic sound recording in which any listening angle of a sound field can be reproduced in the reproduction.
Laser
In laser holography, the hologram is recorded using a source of laser light, which is very pure in its color and orderly in its composition. Various setups may be used, and several types of holograms can be made, but all involve the interaction of light coming from different directions and producing a microscopic interference pattern which a plate, film, or other medium photographically records.
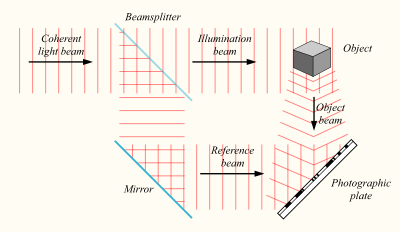
In one common arrangement, the laser beam is split into two, one known as the object beam and the other as the reference beam. The object beam is expanded by passing it through a lens and used to illuminate the subject. The recording medium is located where this light, after being reflected or scattered by the subject, will strike it. The edges of the medium will ultimately serve as a window through which the subject is seen, so its location is chosen with that in mind. The reference beam is expanded and made to shine directly on the medium, where it interacts with the light coming from the subject to create the desired interference pattern.
Like conventional photography, holography requires an appropriate exposure time to correctly affect the recording medium. Unlike conventional photography, during the exposure the light source, the optical elements, the recording medium, and the subject must all remain motionless relative to each other, to within about a quarter of the wavelength of the light, or the interference pattern will be blurred and the hologram spoiled. With living subjects and some unstable materials, that is only possible if a very intense and extremely brief pulse of laser light is used, a hazardous procedure which is rare and rarely done outside of scientific and industrial laboratory settings. Exposures lasting several seconds to several minutes, using a much lower-powered continuously operating laser, are typical.
Apparatus
A hologram can be made by shining part of the light beam directly into the recording medium, and the other part onto the object in such a way that some of the scattered light falls onto the recording medium. A more flexible arrangement for recording a hologram requires the laser beam to be aimed through a series of elements that change it in different ways. The first element is a beam splitter that divides the beam into two identical beams, each aimed in different directions:
- One beam (known as the illumination or object beam) is spread using lenses and directed onto the scene using mirrors. Some of the light scattered (reflected) from the scene then falls onto the recording medium.
- The second beam (known as the reference beam) is also spread through the use of lenses, but is directed so that it doesn't come in contact with the scene, and instead travels directly onto the recording medium.
Several different materials can be used as the recording medium. One of the most common is a film very similar to photographic film (silver halide photographic emulsion), but with a much higher concentration of light-reactive grains, making it capable of the much higher resolution that holograms require. A layer of this recording medium (e.g., silver halide) is attached to a transparent substrate, which is commonly glass, but may also be plastic.
Process
When the two laser beams reach the recording medium, their light waves intersect and interfere with each other. It is this interference pattern that is imprinted on the recording medium. The pattern itself is seemingly random, as it represents the way in which the scene's light interfered with the original light source – but not the original light source itself. The interference pattern can be considered an encoded version of the scene, requiring a particular key – the original light source – in order to view its contents.
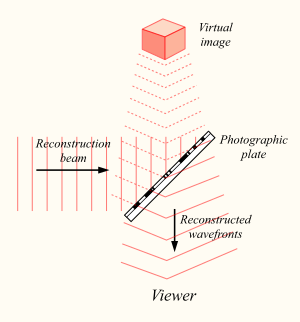
This missing key is provided later by shining a laser, identical to the one used to record the hologram, onto the developed film. When this beam illuminates the hologram, it is diffracted by the hologram's surface pattern. This produces a light field identical to the one originally produced by the scene and scattered onto the hologram.
Comparison with photography
Holography may be better understood via an examination of its differences from ordinary photography:
- A hologram represents a recording of information regarding the light that came from the original scene as scattered in a range of directions rather than from only one direction, as in a photograph. This allows the scene to be viewed from a range of different angles, as if it were still present.
- A photograph can be recorded using normal light sources (sunlight or electric lighting) whereas a laser is required to record a hologram.
- A lens is required in photography to record the image, whereas in holography, the light from the object is scattered directly onto the recording medium.
- A holographic recording requires a second light beam (the reference beam) to be directed onto the recording medium.
- A photograph can be viewed in a wide range of lighting conditions, whereas holograms can only be viewed with very specific forms of illumination.
- When a photograph is cut in half, each piece shows half of the scene. When a hologram is cut in half, the whole scene can still be seen in each piece. This is because, whereas each point in a photograph only represents light scattered from a single point in the scene, each point on a holographic recording includes information about light scattered from every point in the scene. It can be thought of as viewing a street outside a house through a 120 cm × 120 cm (4 ft × 4 ft) window, then through a 60 cm × 120 cm (2 ft × 4 ft) window. One can see all of the same things through the smaller window (by moving the head to change the viewing angle), but the viewer can see more at once through the 120 cm (4 ft) window.
- A photograph is a two-dimensional representation that can only reproduce a rudimentary three-dimensional effect, whereas the reproduced viewing range of a hologram adds many more depth perception cues that were present in the original scene. These cues are recognized by the human brain and translated into the same perception of a three-dimensional image as when the original scene might have been viewed.
- A photograph clearly maps out the light field of the original scene. The developed hologram's surface consists of a very fine, seemingly random pattern, which appears to bear no relationship to the scene it recorded.
Physics of holography
For a better understanding of the process, it is necessary to understand interference and diffraction. Interference occurs when one or more wavefronts are superimposed. Diffraction occurs when a wavefront encounters an object. The process of producing a holographic reconstruction is explained below purely in terms of interference and diffraction. It is somewhat simplified but is accurate enough to give an understanding of how the holographic process works.
For those unfamiliar with these concepts, it is worthwhile to read those articles before reading further in this article.
Plane wavefronts
A diffraction grating is a structure with a repeating pattern. A simple example is a metal plate with slits cut at regular intervals. A light wave that is incident on a grating is split into several waves; the direction of these diffracted waves is determined by the grating spacing and the wavelength of the light.
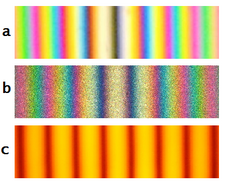
A simple hologram can be made by superimposing two plane waves from the same light source on a holographic recording medium. The two waves interfere, giving a straight-line fringe pattern whose intensity varies sinusoidally across the medium. The spacing of the fringe pattern is determined by the angle between the two waves, and by the wavelength of the light.
The recorded light pattern is a diffraction grating. When it is illuminated by only one of the waves used to create it, it can be shown that one of the diffracted waves emerges at the same angle as that at which the second wave was originally incident, so that the second wave has been 'reconstructed'. Thus, the recorded light pattern is a holographic recording as defined above.
Point sources
If the recording medium is illuminated with a point source and a normally incident plane wave, the resulting pattern is a sinusoidal zone plate, which acts as a negative Fresnel lens whose focal length is equal to the separation of the point source and the recording plane.
When a plane wave-front illuminates a negative lens, it is expanded into a wave that appears to diverge from the focal point of the lens. Thus, when the recorded pattern is illuminated with the original plane wave, some of the light is diffracted into a diverging beam equivalent to the original spherical wave; a holographic recording of the point source has been created.
When the plane wave is incident at a non-normal angle at the time of recording, the pattern formed is more complex, but still acts as a negative lens if it is illuminated at the original angle.
Complex objects
To record a hologram of a complex object, a laser beam is first split into two beams of light. One beam illuminates the object, which then scatters light onto the recording medium. According to diffraction theory, each point in the object acts as a point source of light so the recording medium can be considered to be illuminated by a set of point sources located at varying distances from the medium.
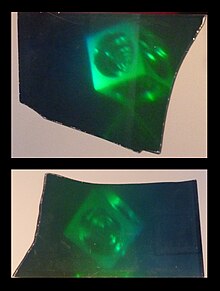
The second (reference) beam illuminates the recording medium directly. Each point source wave interferes with the reference beam, giving rise to its own sinusoidal zone plate in the recording medium. The resulting pattern is the sum of all these 'zone plates', which combine to produce a random (speckle) pattern as in the photograph above.
When the hologram is illuminated by the original reference beam, each of the individual zone plates reconstructs the object wave that produced it, and these individual wavefronts are combined to reconstruct the whole of the object beam. The viewer perceives a wavefront that is identical with the wavefront scattered from the object onto the recording medium, so that it appears that the object is still in place even if it has been removed.
Mathematical model
A single-frequency light wave can be modeled by a complex number, U, which represents the electric or magnetic field of the light wave. The amplitude and phase of the light are represented by the absolute value and angle of the complex number. The object and reference waves at any point in the holographic system are given by UO and UR. The combined beam is given by UO + UR. The energy of the combined beams is proportional to the square of magnitude of the combined waves as
If a photographic plate is exposed to the two beams and then developed, its transmittance, T, is proportional to the light energy that was incident on the plate and is given by
- ,
where k is a constant.
When the developed plate is illuminated by the reference beam, the light transmitted through the plate, UH, is equal to the transmittance, T, multiplied by the reference beam amplitude, UR, giving
It can be seen that UH has four terms, each representing a light beam emerging from the hologram. The first of these is proportional to UO. This is the reconstructed object beam, which enables a viewer to 'see' the original object even when it is no longer present in the field of view.
The second and third beams are modified versions of the reference beam. The fourth term is the "conjugate object beam". It has the reverse curvature to the object beam itself and forms a real image of the object in the space beyond the holographic plate.
When the reference and object beams are incident on the holographic recording medium at significantly different angles, the virtual, real, and reference wavefronts all emerge at different angles, enabling the reconstructed object to be seen clearly.
Recording a hologram
Items required
To make a hologram, the following are required:
- a suitable object or set of objects
- part of the laser beam to be directed so that it illuminates the object (the object beam) and another part so that it illuminates the recording medium directly (the reference beam), enabling the reference beam and the light which is scattered from the object onto the recording medium to form an interference pattern
- a recording medium which converts this interference pattern into an optical element which modifies either the amplitude or the phase of an incident light beam according to the intensity of the interference pattern.
- a laser beam that produces coherent light with one wavelength.
- an environment which provides sufficient mechanical and thermal stability that the interference pattern is stable during the time in which the interference pattern is recorded
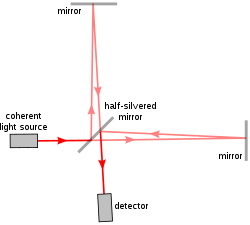
These requirements are inter-related, and it is essential to understand the nature of optical interference to see this. Interference is the variation in intensity which can occur when two light waves are superimposed. The intensity of the maxima exceeds the sum of the individual intensities of the two beams, and the intensity at the minima is less than this and may be zero. The interference pattern maps the relative phase between the two waves, and any change in the relative phases causes the interference pattern to move across the field of view. If the relative phase of the two waves changes by one cycle, then the pattern drifts by one whole fringe. One phase cycle corresponds to a change in the relative distances travelled by the two beams of one wavelength. Since the wavelength of light is of the order of 0.5 μm, it can be seen that very small changes in the optical paths travelled by either of the beams in the holographic recording system lead to movement of the interference pattern which is the holographic recording. Such changes can be caused by relative movements of any of the optical components or the object itself, and also by local changes in air-temperature. It is essential that any such changes are significantly less than the wavelength of light if a clear well-defined recording of the interference is to be created.
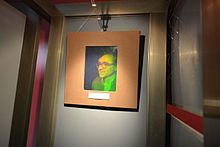
The exposure time required to record the hologram depends on the laser power available, on the particular medium used and on the size and nature of the object(s) to be recorded, just as in conventional photography. This determines the stability requirements. Exposure times of several minutes are typical when using quite powerful gas lasers and silver halide emulsions. All the elements within the optical system have to be stable to fractions of a μm over that period. It is possible to make holograms of much less stable objects by using a pulsed laser which produces a large amount of energy in a very short time (μs or less). These systems have been used to produce holograms of live people. A holographic portrait of Dennis Gabor was produced in 1971 using a pulsed ruby laser.
Thus, the laser power, recording medium sensitivity, recording time and mechanical and thermal stability requirements are all interlinked. Generally, the smaller the object, the more compact the optical layout, so that the stability requirements are significantly less than when making holograms of large objects.
Another very important laser parameter is its coherence. This can be envisaged by considering a laser producing a sine wave whose frequency drifts over time; the coherence length can then be considered to be the distance over which it maintains a single frequency. This is important because two waves of different frequencies do not produce a stable interference pattern. The coherence length of the laser determines the depth of field which can be recorded in the scene. A good holography laser will typically have a coherence length of several meters, ample for a deep hologram.
The objects that form the scene must, in general, have optically rough surfaces so that they scatter light over a wide range of angles. A specularly reflecting (or shiny) surface reflects the light in only one direction at each point on its surface, so in general, most of the light will not be incident on the recording medium. A hologram of a shiny object can be made by locating it very close to the recording plate.
Hologram classifications
There are three important properties of a hologram which are defined in this section. A given hologram will have one or other of each of these three properties, e.g. an amplitude modulated, thin, transmission hologram, or a phase modulated, volume, reflection hologram.
Amplitude and phase modulation holograms
An amplitude modulation hologram is one where the amplitude of light diffracted by the hologram is proportional to the intensity of the recorded light. A straightforward example of this is photographic emulsion on a transparent substrate. The emulsion is exposed to the interference pattern, and is subsequently developed giving a transmittance which varies with the intensity of the pattern – the more light that fell on the plate at a given point, the darker the developed plate at that point.
A phase hologram is made by changing either the thickness or the refractive index of the material in proportion to the intensity of the holographic interference pattern. This is a phase grating and it can be shown that when such a plate is illuminated by the original reference beam, it reconstructs the original object wavefront. The efficiency (i.e., the fraction of the illuminated object beam which is converted into the reconstructed object beam) is greater for phase than for amplitude modulated holograms.
Thin holograms and thick (volume) holograms
A thin hologram is one where the thickness of the recording medium is much less than the spacing of the interference fringes which make up the holographic recording. The thickness of a thin hologram can be down to 60 nm by using a topological insulator material Sb2Te3 thin film.[32] Ultrathin holograms hold the potential to be integrated with everyday consumer electronics like smartphones.
A thick or volume hologram is one where the thickness of the recording medium is greater than the spacing of the interference pattern. The recorded hologram is now a three dimensional structure, and it can be shown that incident light is diffracted by the grating only at a particular angle, known as the Bragg angle.[33] If the hologram is illuminated with a light source incident at the original reference beam angle but a broad spectrum of wavelengths; reconstruction occurs only at the wavelength of the original laser used. If the angle of illumination is changed, reconstruction will occur at a different wavelength and the colour of the re-constructed scene changes. A volume hologram effectively acts as a colour filter.
Transmission and reflection holograms
A transmission hologram is one where the object and reference beams are incident on the recording medium from the same side. In practice, several more mirrors may be used to direct the beams in the required directions.
Normally, transmission holograms can only be reconstructed using a laser or a quasi-monochromatic source, but a particular type of transmission hologram, known as a rainbow hologram, can be viewed with white light.
In a reflection hologram, the object and reference beams are incident on the plate from opposite sides of the plate. The reconstructed object is then viewed from the same side of the plate as that at which the re-constructing beam is incident.
Only volume holograms can be used to make reflection holograms, as only a very low intensity diffracted beam would be reflected by a thin hologram.
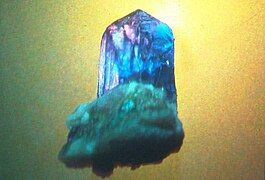
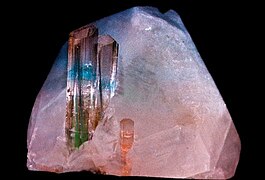
Examples of full-color reflection holograms of mineral specimens:
Holographic recording media
The recording medium has to convert the original interference pattern into an optical element that modifies either the amplitude or the phase of an incident light beam in proportion to the intensity of the original light field.
The recording medium should be able to resolve fully all the fringes arising from interference between object and reference beam. These fringe spacings can range from tens of micrometers to less than one micrometer, i.e. spatial frequencies ranging from a few hundred to several thousand cycles/mm, and ideally, the recording medium should have a response which is flat over this range. Photographic film has a very low or even zero response at the frequencies involved and cannot be used to make a hologram – for example, the resolution of Kodak's professional black and white film starts falling off at 20 lines/mm – it is unlikely that any reconstructed beam could be obtained using this film.
If the response is not flat over the range of spatial frequencies in the interference pattern, then the resolution of the reconstructed image may also be degraded.
The table below shows the principal materials used for holographic recording. Note that these do not include the materials used in the mass replication of an existing hologram, which are discussed in the next section. The resolution limit given in the table indicates the maximal number of interference lines/mm of the gratings. The required exposure, expressed as millijoules (mJ) of photon energy impacting the surface area, is for a long exposure time. Short exposure times (less than 1⁄1000 of a second, such as with a pulsed laser) require much higher exposure energies, due to reciprocity failure.
| Material | Reusable | Processing | Type | Theoretical max. efficiency | Required exposure (mJ/cm2) | Resolution limit (mm−1) |
|---|---|---|---|---|---|---|
| Photographic emulsions | No | Wet | Amplitude | 6% | 1.5 | 5000 |
| Phase (bleached) | 60% | |||||
| Dichromated gelatin | No | Wet | Phase | 100% | 100 | 10,000 |
| Photoresists | No | Wet | Phase | 30% | 100 | 3,000 |
| Photothermoplastics | Yes | Charge and heat | Phase | 33% | 0.1 | 500–1,200 |
| Photopolymers | No | Post exposure | Phase | 100% | 10000 | 5,000 |
| Photorefractives | Yes | None | Phase | 100% | 10 | 10,000 |
Copying and mass production
An existing hologram can be copied by embossing or optically.
Most holographic recordings (e.g. bleached silver halide, photoresist, and photopolymers) have surface relief patterns which conform with the original illumination intensity. Embossing, which is similar to the method used to stamp out plastic discs from a master in audio recording, involves copying this surface relief pattern by impressing it onto another material.
The first step in the embossing process is to make a stamper by electrodeposition of nickel on the relief image recorded on the photoresist or photothermoplastic. When the nickel layer is thick enough, it is separated from the master hologram and mounted on a metal backing plate. The material used to make embossed copies consists of a polyester base film, a resin separation layer and a thermoplastic film constituting the holographic layer.
The embossing process can be carried out with a simple heated press. The bottom layer of the duplicating film (the thermoplastic layer) is heated above its softening point and pressed against the stamper, so that it takes up its shape. This shape is retained when the film is cooled and removed from the press. In order to permit the viewing of embossed holograms in reflection, an additional reflecting layer of aluminum is usually added on the hologram recording layer. This method is particularly suited to mass production.
The first book to feature a hologram on the front cover was The Skook (Warner Books, 1984) by JP Miller, featuring an illustration by Miller. The first record album cover to have a hologram was "UB44", produced in 1982 for the British group UB40 by Advanced Holographics in Loughborough. This featured a 5.75" square embossed hologram showing a 3D image of the letters UB carved out of polystyrene to look like stone and the numbers 44 hovering in space on the picture plane. On the inner sleeve was an explanation of the holographic process and instructions on how to light the hologram. National Geographic published the first magazine with a hologram cover in March 1984. Embossed holograms are used widely on credit cards, banknotes, and high value products for authentication purposes.
It is possible to print holograms directly into steel using a sheet explosive charge to create the required surface relief. The Royal Canadian Mint produces holographic gold and silver coinage through a complex stamping process.
A hologram can be copied optically by illuminating it with a laser beam, and locating a second hologram plate so that it is illuminated both by the reconstructed object beam, and the illuminating beam. Stability and coherence requirements are significantly reduced if the two plates are located very close together. An index matching fluid is often used between the plates to minimize spurious interference between the plates. Uniform illumination can be obtained by scanning point-by-point or with a beam shaped into a thin line.
Reconstructing and viewing the holographic image
When the hologram plate is illuminated by a laser beam identical to the reference beam which was used to record the hologram, an exact reconstruction of the original object wavefront is obtained. An imaging system (an eye or a camera) located in the reconstructed beam 'sees' exactly the same scene as it would have done when viewing the original. When the lens is moved, the image changes in the same way as it would have done when the object was in place. If several objects were present when the hologram was recorded, the reconstructed objects move relative to one another, i.e. exhibit parallax, in the same way as the original objects would have done. It was very common in the early days of holography to use a chess board as the object and then take photographs at several different angles using the reconstructed light to show how the relative positions of the chess pieces appeared to change.
A holographic image can also be obtained using a different laser beam configuration to the original recording object beam, but the reconstructed image will not match the original exactly. When a laser is used to reconstruct the hologram, the image is speckled just as the original image will have been. This can be a major drawback in viewing a hologram.
White light consists of light of a wide range of wavelengths. Normally, if a hologram is illuminated by a white light source, each wavelength can be considered to generate its own holographic reconstruction, and these will vary in size, angle, and distance. These will be superimposed, and the summed image will wipe out any information about the original scene, as if superimposing a set of photographs of the same object of different sizes and orientations. However, a holographic image can be obtained using white light in specific circumstances, e.g. with volume holograms and rainbow holograms. The white light source used to view these holograms should always approximate to a point source, i.e. a spot light or the sun. An extended source (e.g. a fluorescent lamp) will not reconstruct a hologram since its light is incident at each point at a wide range of angles, giving multiple reconstructions which will "wipe" one another out.
White light reconstructions do not contain speckles.
Volume holograms
A reflection-type volume hologram can give an acceptably clear reconstructed image using a white light source, as the hologram structure itself effectively filters out light of wavelengths outside a relatively narrow range. In theory, the result should be an image of approximately the same colour as the laser light used to make the hologram. In practice, with recording media that require chemical processing, there is typically a compaction of the structure due to the processing and a consequent colour shift to a shorter wavelength. Such a hologram recorded in a silver halide gelatin emulsion by red laser light will usually display a green image. Deliberate temporary alteration of the emulsion thickness before exposure, or permanent alteration after processing, has been used by artists to produce unusual colours and multicoloured effects.
Rainbow holograms
In this method, parallax in the vertical plane is sacrificed to allow a bright, well-defined, gradiently colored reconstructed image to be obtained using white light. The rainbow holography recording process usually begins with a standard transmission hologram and copies it using a horizontal slit to eliminate vertical parallax in the output image. The viewer is therefore effectively viewing the holographic image through a narrow horizontal slit, but the slit has been expanded into a window by the same dispersion that would otherwise smear the entire image. Horizontal parallax information is preserved but movement in the vertical direction results in a color shift rather than altered vertical perspective. Because perspective effects are reproduced along one axis only, the subject will appear variously stretched or squashed when the hologram is not viewed at an optimum distance; this distortion may go unnoticed when there is not much depth, but can be severe when the distance of the subject from the plane of the hologram is very substantial. Stereopsis and horizontal motion parallax, two relatively powerful cues to depth, are preserved.
The holograms found on credit cards are examples of rainbow holograms. These are technically transmission holograms mounted onto a reflective surface like a metalized polyethylene terephthalate substrate commonly known as PET.
Fidelity of the reconstructed beam
To replicate the original object beam exactly, the reconstructing reference beam must be identical to the original reference beam and the recording medium must be able to fully resolve the interference pattern formed between the object and reference beams. Exact reconstruction is required in holographic interferometry, where the holographically reconstructed wavefront interferes with the wavefront coming from the actual object, giving a null fringe if there has been no movement of the object and mapping out the displacement if the object has moved. This requires very precise relocation of the developed holographic plate.
Any change in the shape, orientation or wavelength of the reference beam gives rise to aberrations in the reconstructed image. For instance, the reconstructed image is magnified if the laser used to reconstruct the hologram has a longer wavelength than the original laser. Nonetheless, good reconstruction is obtained using a laser of a different wavelength, quasi-monochromatic light or white light, in the right circumstances.
Since each point in the object illuminates all of the hologram, the whole object can be reconstructed from a small part of the hologram. Thus, a hologram can be broken up into small pieces and each one will enable the whole of the original object to be imaged. One does, however, lose information and the spatial resolution gets worse as the size of the hologram is decreased – the image becomes "fuzzier". The field of view is also reduced, and the viewer will have to change position to see different parts of the scene.
Applications
Art
Early on, artists saw the potential of holography as a medium and gained access to science laboratories to create their work. Holographic art is often the result of collaborations between scientists and artists, although some holographers would regard themselves as both an artist and a scientist.
Salvador Dalí claimed to have been the first to employ holography artistically. He was certainly the first and best-known surrealist to do so, but the 1972 New York exhibit of Dalí holograms had been preceded by the holographic art exhibition that was held at the Cranbrook Academy of Art in Michigan in 1968 and by the one at the Finch College gallery in New York in 1970, which attracted national media attention. In Great Britain, Margaret Benyon began using holography as an artistic medium in the late 1960s and had a solo exhibition at the University of Nottingham art gallery in 1969. This was followed in 1970 by a solo show at the Lisson Gallery in London, which was billed as the "first London expo of holograms and stereoscopic paintings".
During the 1970s, a number of art studios and schools were established, each with their particular approach to holography. Notably, there was the San Francisco School of Holography established by Lloyd Cross, The Museum of Holography in New York founded by Rosemary (Posy) H. Jackson, the Royal College of Art in London and the Lake Forest College Symposiums organised by Tung Jeong. None of these studios still exist; however, there is the Center for the Holographic Arts in New York and the HOLOcenter in Seoul, which offers artists a place to create and exhibit work.
During the 1980s, many artists who worked with holography helped the diffusion of this so-called "new medium" in the art world, such as Harriet Casdin-Silver of the United States, Dieter Jung of Germany, and Moysés Baumstein of Brazil, each one searching for a proper "language" to use with the three-dimensional work, avoiding the simple holographic reproduction of a sculpture or object. For instance, in Brazil, many concrete poets (Augusto de Campos, Décio Pignatari, Julio Plaza and José Wagner Garcia, associated with Moysés Baumstein) found in holography a way to express themselves and to renew Concrete Poetry.
A small but active group of artists still integrate holographic elements into their work. Some are associated with novel holographic techniques; for example, artist Matt Brand employed computational mirror design to eliminate image distortion from specular holography.
The MIT Museum and Jonathan Ross both have extensive collections of holography and on-line catalogues of art holograms.
Data storage
Holography can be put to a variety of uses other than recording images. Holographic data storage is a technique that can store information at high density inside crystals or photopolymers. The ability to store large amounts of information in some kind of medium is of great importance, as many electronic products incorporate storage devices. As current storage techniques such as Blu-ray Disc reach the limit of possible data density (due to the diffraction-limited size of the writing beams), holographic storage has the potential to become the next generation of popular storage media. The advantage of this type of data storage is that the volume of the recording media is used instead of just the surface. Currently available SLMs can produce about 1000 different images a second at 1024×1024-bit resolution. With the right type of medium (probably polymers rather than something like LiNbO3), this would result in about one-gigabit-per-second writing speed. Read speeds can surpass this, and experts believe one-terabit-per-second readout is possible.
In 2005, companies such as Optware and Maxell produced a 120mm disc that uses a holographic layer to store data to a potential 3.9TB, a format called Holographic Versatile Disc. As of September 2014, no commercial product has been released.
Another company, InPhase Technologies, was developing a competing format, but went bankrupt in 2011 and all its assets were sold to Akonia Holographics, LLC.
While many holographic data storage models have used "page-based" storage, where each recorded hologram holds a large amount of data, more recent research into using submicrometre-sized "microholograms" has resulted in several potential 3D optical data storage solutions. While this approach to data storage can not attain the high data rates of page-based storage, the tolerances, technological hurdles, and cost of producing a commercial product are significantly lower.
Dynamic holography
In static holography, recording, developing and reconstructing occur sequentially, and a permanent hologram is produced.
There also exist holographic materials that do not need the developing process and can record a hologram in a very short time. This allows one to use holography to perform some simple operations in an all-optical way. Examples of applications of such real-time holograms include phase-conjugate mirrors ("time-reversal" of light), optical cache memories, image processing (pattern recognition of time-varying images), and optical computing.
The amount of processed information can be very high (terabits/s), since the operation is performed in parallel on a whole image. This compensates for the fact that the recording time, which is in the order of a microsecond, is still very long compared to the processing time of an electronic computer. The optical processing performed by a dynamic hologram is also much less flexible than electronic processing. On one side, one has to perform the operation always on the whole image, and on the other side, the operation a hologram can perform is basically either a multiplication or a phase conjugation. In optics, addition and Fourier transform are already easily performed in linear materials, the latter simply by a lens. This enables some applications, such as a device that compares images in an optical way.
The search for novel nonlinear optical materials for dynamic holography is an active area of research. The most common materials are photorefractive crystals, but in semiconductors or semiconductor heterostructures (such as quantum wells), atomic vapors and gases, plasmas and even liquids, it was possible to generate holograms.
A particularly promising application is optical phase conjugation. It allows the removal of the wavefront distortions a light beam receives when passing through an aberrating medium, by sending it back through the same aberrating medium with a conjugated phase. This is useful, for example, in free-space optical communications to compensate for atmospheric turbulence (the phenomenon that gives rise to the twinkling of starlight).
Hobbyist use
Since the beginning of holography, amateur experimenters have explored its uses.
In 1971, Lloyd Cross opened the San Francisco School of Holography and taught amateurs how to make holograms using only a small (typically 5 mW) helium-neon laser and inexpensive home-made equipment. Holography had been supposed to require a very expensive metal optical table set-up to lock all the involved elements down in place and damp any vibrations that could blur the interference fringes and ruin the hologram. Cross's home-brew alternative was a sandbox made of a cinder block retaining wall on a plywood base, supported on stacks of old tires to isolate it from ground vibrations, and filled with sand that had been washed to remove dust. The laser was securely mounted atop the cinder block wall. The mirrors and simple lenses needed for directing, splitting and expanding the laser beam were affixed to short lengths of PVC pipe, which were stuck into the sand at the desired locations. The subject and the photographic plate holder were similarly supported within the sandbox. The holographer turned off the room light, blocked the laser beam near its source using a small relay-controlled shutter, loaded a plate into the holder in the dark, left the room, waited a few minutes to let everything settle, then made the exposure by remotely operating the laser shutter.
Many of these holographers would go on to produce art holograms. In 1983, Fred Unterseher, a co-founder of the San Francisco School of Holography and a well-known holographic artist, published the Holography Handbook, an easy-to-read guide to making holograms at home. This brought in a new wave of holographers and provided simple methods for using the then-available AGFA silver halide recording materials.
In 2000, Frank DeFreitas published the Shoebox Holography Book and introduced the use of inexpensive laser pointers to countless hobbyists. For many years, it had been assumed that certain characteristics of semiconductor laser diodes made them virtually useless for creating holograms, but when they were eventually put to the test of practical experiment, it was found that not only was this untrue, but that some actually provided a coherence length much greater than that of traditional helium-neon gas lasers. This was a very important development for amateurs, as the price of red laser diodes had dropped from hundreds of dollars in the early 1980s to about $5 after they entered the mass market as a component of DVD players in the late 1990s. Now, there are thousands of amateur holographers worldwide.
By late 2000, holography kits with inexpensive laser pointer diodes entered the mainstream consumer market. These kits enabled students, teachers, and hobbyists to make several kinds of holograms without specialized equipment, and became popular gift items by 2005. The introduction of holography kits with self-developing plates in 2003 made it possible for hobbyists to create holograms without the bother of wet chemical processing.
In 2006, a large number of surplus holography-quality green lasers (Coherent C315) became available and put dichromated gelatin (DCG) holography within the reach of the amateur holographer. The holography community was surprised at the amazing sensitivity of DCG to green light. It had been assumed that this sensitivity would be uselessly slight or non-existent. Jeff Blyth responded with the G307 formulation of DCG to increase the speed and sensitivity to these new lasers.
Kodak and Agfa, the former major suppliers of holography-quality silver halide plates and films, are no longer in the market. While other manufacturers have helped fill the void, many amateurs are now making their own materials. The favorite formulations are dichromated gelatin, Methylene-Blue-sensitised dichromated gelatin, and diffusion method silver halide preparations. Jeff Blyth has published very accurate methods for making these in a small lab or garage.
A small group of amateurs are even constructing their own pulsed lasers to make holograms of living subjects and other unsteady or moving objects.
Holographic interferometry
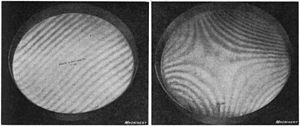
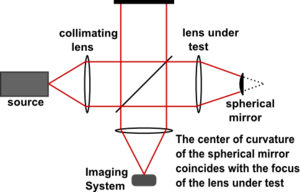
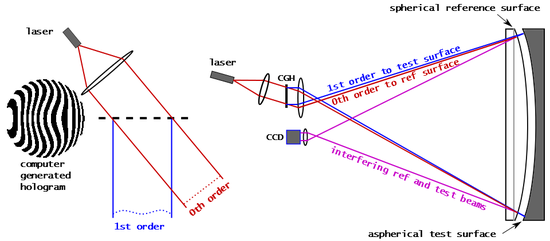
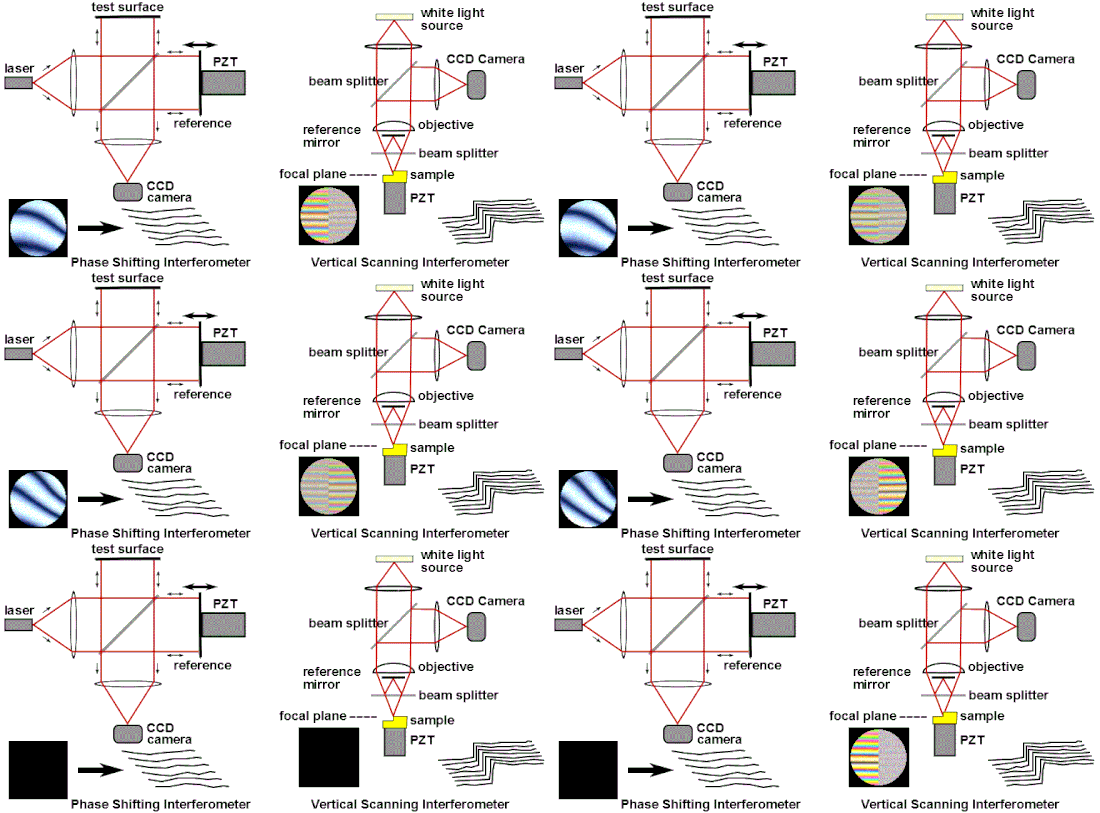
Holographic interferometry (HI) is a technique that enables static and dynamic displacements of objects with optically rough surfaces to be measured to optical interferometric precision (i.e. to fractions of a wavelength of light). It can also be used to detect optical-path-length variations in transparent media, which enables, for example, fluid flow to be visualized and analyzed. It can also be used to generate contours representing the form of the surface or the isodose regions in radiation dosimetry.
It has been widely used to measure stress, strain, and vibration in engineering structures.
Interferometric microscopy
The hologram keeps the information on the amplitude and phase of the field. Several holograms may keep information about the same distribution of light, emitted to various directions. The numerical analysis of such holograms allows one to emulate large numerical aperture, which, in turn, enables enhancement of the resolution of optical microscopy. The corresponding technique is called interferometric microscopy. Recent achievements of interferometric microscopy allow one to approach the quarter-wavelength limit of resolution.
Sensors or biosensors
The hologram is made with a modified material that interacts with certain molecules generating a change in the fringe periodicity or refractive index, therefore, the color of the holographic reflection.
Security
Security holograms are very difficult to forge, because they are replicated from a master hologram that requires expensive, specialized and technologically advanced equipment. They are used widely in many currencies, such as the Brazilian 20, 50, and 100-reais notes; British 5, 10, and 20-pound notes; South Korean 5000, 10,000, and 50,000-won notes; Japanese 5000 and 10,000 yen notes, Indian 50,100,500, and 2000 rupee notes; and all the currently-circulating banknotes of the Canadian dollar, Croatian kuna, Danish krone, and Euro. They can also be found in credit and bank cards as well as passports, ID cards, books, DVDs, and sports equipment.
Other applications
Holographic scanners are in use in post offices, larger shipping firms, and automated conveyor systems to determine the three-dimensional size of a package. They are often used in tandem with checkweighers to allow automated pre-packing of given volumes, such as a truck or pallet for bulk shipment of goods. Holograms produced in elastomers can be used as stress-strain reporters due to its elasticity and compressibility, the pressure and force applied are correlated to the reflected wavelength, therefore its color. Holography technique can also be effectively used for radiation dosimetry.
FMCG industry
These are the hologram adhesive strips that provide protection against counterfeiting and duplication of products. These protective strips can be used on FMCG products like cards, medicines, food, audio-visual products etc. Hologram protection strips can be directly laminated on the product covering.
Electrical and electronic products
Hologram tags have an excellent ability to inspect an identical product. These kind of tags are more often used for protecting duplication of electrical and electronic products. These tags are available in a variety colors, sizes and shapes.
Hologram dockets for vehicle number plate
Some vehicle number plates on bikes or cars have registered hologram stickers which indicate authenticity. For the purpose of identification they have unique ID numbers.
High security holograms for credit cards
These are holograms with high security features like micro texts, nano texts, complex images, logos and a multitude of other features. Holograms once affixed on Debit cards/passports cannot be removed easily. They offer an individual identity to a brand along with its protection.
Non-optical
In principle, it is possible to make a hologram for any wave.
Electron holography is the application of holography techniques to electron waves rather than light waves. Electron holography was invented by Dennis Gabor to improve the resolution and avoid the aberrations of the transmission electron microscope. Today it is commonly used to study electric and magnetic fields in thin films, as magnetic and electric fields can shift the phase of the interfering wave passing through the sample. The principle of electron holography can also be applied to interference lithography.
Acoustic holography is a method used to estimate the sound field near a source by measuring acoustic parameters away from the source via an array of pressure and/or particle velocity transducers.
Measuring techniques included within acoustic holography are becoming increasingly popular in various fields, most notably those of transportation, vehicle and aircraft design, and NVH. The general idea of acoustic holography has led to different versions such as near-field acoustic holography (NAH) and statistically optimal near-field acoustic holography (SONAH). For audio rendition, the wave field synthesis is the most related procedure.
Atomic holography has evolved out of the development of the basic elements of atom optics. With the Fresnel diffraction lens and atomic mirrors atomic holography follows a natural step in the development of the physics (and applications) of atomic beams. Recent developments including atomic mirrors and especially ridged mirrors have provided the tools necessary for the creation of atomic holograms, although such holograms have not yet been commercialized.
Neutron beam holography has been used to see the inside of solid objects.
False holograms
Effects produced by lenticular printing, the Pepper's ghost illusion (or modern variants such as the Musion Eyeliner), tomography and volumetric displays are often confused with holograms. Such illusions have been called "fauxlography".
The Pepper's ghost technique, being the easiest to implement of these methods, is most prevalent in 3D displays that claim to be (or are referred to as) "holographic". While the original illusion, used in theater, involved actual physical objects and persons, located offstage, modern variants replace the source object with a digital screen, which displays imagery generated with 3D computer graphics to provide the necessary depth cues. The reflection, which seems to float mid-air, is still flat, however, thus less realistic than if an actual 3D object was being reflected.
Examples of this digital version of Pepper's ghost illusion include the Gorillaz performances in the 2005 MTV Europe Music Awards and the 48th Grammy Awards; and Tupac Shakur's virtual performance at Coachella Valley Music and Arts Festival in 2012, rapping alongside Snoop Dogg during his set with Dr. Dre.
An even simpler illusion can be created by rear-projecting realistic images into semi-transparent screens. The rear projection is necessary because otherwise the semi-transparency of the screen would allow the background to be illuminated by the projection, which would break the illusion.
Crypton Future Media, a music software company that produced Hatsune Miku, one of many Vocaloid singing synthesizer applications, has produced concerts that have Miku, along with other Crypton Vocaloids, performing on stage as "holographic" characters. These concerts use rear projection onto a semi-transparent DILAD screen to achieve its "holographic" effect.
In 2011, in Beijing, apparel company Burberry produced the "Burberry Prorsum Autumn/Winter 2011 Hologram Runway Show", which included life size 2-D projections of models. The company's own video shows several centered and off-center shots of the main 2-dimensional projection screen, the latter revealing the flatness of the virtual models. The claim that holography was used was reported as fact in the trade media.
In Madrid, on 10 April 2015, a public visual presentation called "Hologramas por la Libertad" (Holograms for Liberty), featuring a ghostly virtual crowd of demonstrators, was used to protest a new Spanish law that prohibits citizens from demonstrating in public places. Although widely called a "hologram protest" in news reports, no actual holography was involved – it was yet another technologically updated variant of the Pepper's Ghost illusion.
In fiction
Holography has been widely referred to in movies, novels, and TV, usually in science fiction, starting in the late 1970s. Science fiction writers absorbed the urban legends surrounding holography that had been spread by overly-enthusiastic scientists and entrepreneurs trying to market the idea. This had the effect of giving the public overly high expectations of the capability of holography, due to the unrealistic depictions of it in most fiction, where they are fully three-dimensional computer projections that are sometimes tactile through the use of force fields. Examples of this type of depiction include the hologram of Princess Leia in Star Wars, Arnold Rimmer from Red Dwarf, who was later converted to "hard light" to make him solid, and the Holodeck and Emergency Medical Hologram from Star Trek.
Holography served as an inspiration for many video games with the science fiction elements. In many titles, fictional holographic technology has been used to reflect real life misrepresentations of potential military use of holograms, such as the "mirage tanks" in Command & Conquer: Red Alert 2 that can disguise themselves as trees. Player characters are able to use holographic decoys in games such as Halo: Reach and Crysis 2 to confuse and distract the enemy. Starcraft ghost agent Nova has access to "holo decoy" as one of her three primary abilities in Heroes of the Storm.[91]
Fictional depictions of holograms have, however, inspired technological advances in other fields, such as augmented reality, that promise to fulfill the fictional depictions of holograms by other means.


