Search This Blog

Wednesday, March 31, 2021

Atmospheric model

From Wikipedia, the free encyclopedia
 
A 96-hour forecast of 850 mbar geopotential height and temperature from the Global Forecast System

An atmospheric model is a mathematical model constructed around the full set of primitive dynamical equations which govern atmospheric motions. It can supplement these equations with parameterizations for turbulent diffusion, radiation, moist processes (clouds and precipitation), heat exchange, soil, vegetation, surface water, the kinematic effects of terrain, and convection. Most atmospheric models are numerical, i.e. they discretize equations of motion. They can predict microscale phenomena such as tornadoes and boundary layer eddies, sub-microscale turbulent flow over buildings, as well as synoptic and global flows. The horizontal domain of a model is either global, covering the entire Earth, or regional (limited-area), covering only part of the Earth. The different types of models run are thermotropic, barotropic, hydrostatic, and nonhydrostatic. Some of the model types make assumptions about the atmosphere which lengthens the time steps used and increases computational speed.

Forecasts are computed using mathematical equations for the physics and dynamics of the atmosphere. These equations are nonlinear and are impossible to solve exactly. Therefore, numerical methods obtain approximate solutions. Different models use different solution methods. Global models often use spectral methods for the horizontal dimensions and finite-difference methods for the vertical dimension, while regional models usually use finite-difference methods in all three dimensions. For specific locations, model output statistics use climate information, output from numerical weather prediction, and current surface weather observations to develop statistical relationships which account for model bias and resolution issues.

Types

The main assumption made by the thermotropic model is that while the magnitude of the thermal wind may change, its direction does not change with respect to height, and thus the baroclinicity in the atmosphere can be simulated using the 500 mb (15 inHg) and 1,000 mb (30 inHg) geopotential height surfaces and the average thermal wind between them.

Barotropic models assume the atmosphere is nearly barotropic, which means that the direction and speed of the geostrophic wind are independent of height. In other words, no vertical wind shear of the geostrophic wind. It also implies that thickness contours (a proxy for temperature) are parallel to upper level height contours. In this type of atmosphere, high and low pressure areas are centers of warm and cold temperature anomalies. Warm-core highs (such as the subtropical ridge and Bermuda-Azores high) and cold-core lows have strengthening winds with height, with the reverse true for cold-core highs (shallow arctic highs) and warm-core lows (such as tropical cyclones). A barotropic model tries to solve a simplified form of atmospheric dynamics based on the assumption that the atmosphere is in geostrophic balance; that is, that the Rossby number of the air in the atmosphere is small. If the assumption is made that the atmosphere is divergence-free, the curl of the Euler equations reduces into the barotropic vorticity equation. This latter equation can be solved over a single layer of the atmosphere. Since the atmosphere at a height of approximately 5.5 kilometres (3.4 mi) is mostly divergence-free, the barotropic model best approximates the state of the atmosphere at a geopotential height corresponding to that altitude, which corresponds to the atmosphere's 500 mb (15 inHg) pressure surface.

Hydrostatic models filter out vertically moving acoustic waves from the vertical momentum equation, which significantly increases the time step used within the model's run. This is known as the hydrostatic approximation. Hydrostatic models use either pressure or sigma-pressure vertical coordinates. Pressure coordinates intersect topography while sigma coordinates follow the contour of the land. Its hydrostatic assumption is reasonable as long as horizontal grid resolution is not small, which is a scale where the hydrostatic assumption fails. Models which use the entire vertical momentum equation are known as nonhydrostatic. A nonhydrostatic model can be solved anelastically, meaning it solves the complete continuity equation for air assuming it is incompressible, or elastically, meaning it solves the complete continuity equation for air and is fully compressible. Nonhydrostatic models use altitude or sigma altitude for their vertical coordinates. Altitude coordinates can intersect land while sigma-altitude coordinates follow the contours of the land.

History

The ENIAC main control panel at the Moore School of Electrical Engineering

The history of numerical weather prediction began in the 1920s through the efforts of Lewis Fry Richardson who utilized procedures developed by Vilhelm Bjerknes. It was not until the advent of the computer and computer simulation that computation time was reduced to less than the forecast period itself. ENIAC created the first computer forecasts in 1950, and more powerful computers later increased the size of initial datasets and included more complicated versions of the equations of motion. In 1966, West Germany and the United States began producing operational forecasts based on primitive-equation models, followed by the United Kingdom in 1972 and Australia in 1977. The development of global forecasting models led to the first climate models. The development of limited area (regional) models facilitated advances in forecasting the tracks of tropical cyclone as well as air quality in the 1970s and 1980s.

Because the output of forecast models based on atmospheric dynamics requires corrections near ground level, model output statistics (MOS) were developed in the 1970s and 1980s for individual forecast points (locations). Even with the increasing power of supercomputers, the forecast skill of numerical weather models only extends to about two weeks into the future, since the density and quality of observations—together with the chaotic nature of the partial differential equations used to calculate the forecast—introduce errors which double every five days. The use of model ensemble forecasts since the 1990s helps to define the forecast uncertainty and extend weather forecasting farther into the future than otherwise possible.

Initialization

A WP-3D Orion weather reconnaissance aircraft in flight

The atmosphere is a fluid. As such, the idea of numerical weather prediction is to sample the state of the fluid at a given time and use the equations of fluid dynamics and thermodynamics to estimate the state of the fluid at some time in the future. On land, terrain maps, available at resolutions down to 1 kilometre (0.62 mi) globally, are used to help model atmospheric circulations within regions of rugged topography, in order to better depict features such as downslope winds, mountain waves, and related cloudiness which affects incoming solar radiation. The main inputs from country-based weather services are surface observations from automated weather stations at ground level over land and from weather buoys at sea. The World Meteorological Organization acts to standardize the instrumentation, observing practices and timing of these observations worldwide. Stations either report hourly in METAR reports, or every six hours in SYNOP reports. Models are initialized using this observed data. The irregularly spaced observations are processed by data assimilation and objective analysis methods, which perform quality control and obtain values at locations usable by the model's mathematical algorithms. The grid used for global models is geodesic or icosahedral, spaced by latitude, longitude, and elevation. The data are then used in the model as the starting point for a forecast.

A variety of methods are used to gather observational data for use in numerical models. Sites launch radiosondes, which rise through the troposphere and well into the stratosphere. Information from weather satellites is used where traditional data sources are not available. Commerce provides pilot reports along aircraft routes and ship reports along shipping routes. Research projects use reconnaissance aircraft to fly in and around weather systems of interest, such as tropical cyclones. Reconnaissance aircraft are also flown over the open oceans during the cold season into systems which cause significant uncertainty in forecast guidance, or are expected to be of high impact 3–7 days into the future over the downstream continent. Sea ice began to be initialized in forecast models in 1971. Efforts to involve sea surface temperature in model initialization began in 1972 due to its role in modulating weather in higher latitudes of the Pacific.

Computation

An example of 500 mbar geopotential height prediction from a numerical weather prediction model.
 
Supercomputers are capable of running highly complex models to help scientists better understand Earth's climate.

A model is a computer program that produces meteorological information for future times at given locations and altitudes. Within any model is a set of equations, known as the primitive equations, used to predict the future state of the atmosphere. These equations are initialized from the analysis data and rates of change are determined. These rates of change predict the state of the atmosphere a short time into the future, with each time increment known as a time step. The equations are then applied to this new atmospheric state to find new rates of change, and these new rates of change predict the atmosphere at a yet further time into the future. Time stepping is repeated until the solution reaches the desired forecast time. The length of the time step chosen within the model is related to the distance between the points on the computational grid, and is chosen to maintain numerical stability. Time steps for global models are on the order of tens of minutes, while time steps for regional models are between one and four minutes. The global models are run at varying times into the future. The UKMET Unified model is run six days into the future, the European Centre for Medium-Range Weather Forecasts model is run out to 10 days into the future, while the Global Forecast System model run by the Environmental Modeling Center is run 16 days into the future.

The equations used are nonlinear partial differential equations which are impossible to solve exactly through analytical methods, with the exception of a few idealized cases. Therefore, numerical methods obtain approximate solutions. Different models use different solution methods: some global models use spectral methods for the horizontal dimensions and finite difference methods for the vertical dimension, while regional models and other global models usually use finite-difference methods in all three dimensions. The visual output produced by a model solution is known as a prognostic chart, or prog.

Parameterization

Weather and climate model gridboxes have sides of between 5 kilometres (3.1 mi) and 300 kilometres (190 mi). A typical cumulus cloud has a scale of less than 1 kilometre (0.62 mi), and would require a grid even finer than this to be represented physically by the equations of fluid motion. Therefore, the processes that such clouds represent are parameterized, by processes of various sophistication. In the earliest models, if a column of air in a model gridbox was unstable (i.e., the bottom warmer than the top) then it would be overturned, and the air in that vertical column mixed. More sophisticated schemes add enhancements, recognizing that only some portions of the box might convect and that entrainment and other processes occur. Weather models that have gridboxes with sides between 5 kilometres (3.1 mi) and 25 kilometres (16 mi) can explicitly represent convective clouds, although they still need to parameterize cloud microphysics. The formation of large-scale (stratus-type) clouds is more physically based, they form when the relative humidity reaches some prescribed value. Still, sub grid scale processes need to be taken into account. Rather than assuming that clouds form at 100% relative humidity, the cloud fraction can be related to a critical relative humidity of 70% for stratus-type clouds, and at or above 80% for cumuliform clouds, reflecting the sub grid scale variation that would occur in the real world.

The amount of solar radiation reaching ground level in rugged terrain, or due to variable cloudiness, is parameterized as this process occurs on the molecular scale. Also, the grid size of the models is large when compared to the actual size and roughness of clouds and topography. Sun angle as well as the impact of multiple cloud layers is taken into account. Soil type, vegetation type, and soil moisture all determine how much radiation goes into warming and how much moisture is drawn up into the adjacent atmosphere. Thus, they are important to parameterize.

Domains

The horizontal domain of a model is either global, covering the entire Earth, or regional, covering only part of the Earth. Regional models also are known as limited-area models, or LAMs. Regional models use finer grid spacing to resolve explicitly smaller-scale meteorological phenomena, since their smaller domain decreases computational demands. Regional models use a compatible global model for initial conditions of the edge of their domain. Uncertainty and errors within LAMs are introduced by the global model used for the boundary conditions of the edge of the regional model, as well as within the creation of the boundary conditions for the LAMs itself.

The vertical coordinate is handled in various ways. Some models, such as Richardson's 1922 model, use geometric height () as the vertical coordinate. Later models substituted the geometric coordinate with a pressure coordinate system, in which the geopotential heights of constant-pressure surfaces become dependent variables, greatly simplifying the primitive equations. This follows since pressure decreases with height through the Earth's atmosphere. The first model used for operational forecasts, the single-layer barotropic model, used a single pressure coordinate at the 500-millibar (15 inHg) level, and thus was essentially two-dimensional. High-resolution models—also called mesoscale models—such as the Weather Research and Forecasting model tend to use normalized pressure coordinates referred to as sigma coordinates.

Global versions

Some of the better known global numerical models are:

Regional versions

Some of the better known regional numerical models are:

  • WRF The Weather Research and Forecasting model was developed cooperatively by NCEP, NCAR, and the meteorological research community. WRF has several configurations, including:
    • WRF-NMM The WRF Nonhydrostatic Mesoscale Model is the primary short-term weather forecast model for the U.S., replacing the Eta model.
    • WRF-ARW Advanced Research WRF developed primarily at the U.S. National Center for Atmospheric Research (NCAR)
  • NAM The term North American Mesoscale model refers to whatever regional model NCEP operates over the North American domain. NCEP began using this designation system in January 2005. Between January 2005 and May 2006 the Eta model used this designation. Beginning in May 2006, NCEP began to use the WRF-NMM as the operational NAM.
  • RAMS the Regional Atmospheric Modeling System developed at Colorado State University for numerical simulations of atmospheric meteorology and other environmental phenomena on scales from meters to hundreds of kilometers – now supported in the public domain
  • MM5 The Fifth Generation Penn State/NCAR Mesoscale Model
  • ARPS the Advanced Region Prediction System developed at the University of Oklahoma is a comprehensive multi-scale nonhydrostatic simulation and prediction system that can be used for regional-scale weather prediction up to the tornado-scale simulation and prediction. Advanced radar data assimilation for thunderstorm prediction is a key part of the system..
  • HIRLAM High Resolution Limited Area Model, is developed by the European NWP research consortia HIRLAM co-funded by 10 European weather services. The meso-scale HIRLAM model is known as HARMONIE and developed in collaboration with Meteo France and ALADIN consortia.
  • GEM-LAM Global Environmental Multiscale Limited Area Model, the high resolution 2.5 km (1.6 mi) GEM by the Meteorological Service of Canada (MSC)
  • ALADIN The high-resolution limited-area hydrostatic and non-hydrostatic model developed and operated by several European and North African countries under the leadership of Météo-France
  • COSMO The COSMO Model, formerly known as LM, aLMo or LAMI, is a limited-area non-hydrostatic model developed within the framework of the Consortium for Small-Scale Modelling (Germany, Switzerland, Italy, Greece, Poland, Romania, and Russia).
  • Meso-NH The Meso-NH Model is a limited-area non-hydrostatic model developed jointly by the Centre National de Recherches Météorologiques and the Laboratoire d'Aérologie (France, Toulouse) since 1998. Its application is from mesoscale to centimetric scales weather simulations.

Model output statistics

Because forecast models based upon the equations for atmospheric dynamics do not perfectly determine weather conditions near the ground, statistical corrections were developed to attempt to resolve this problem. Statistical models were created based upon the three-dimensional fields produced by numerical weather models, surface observations, and the climatological conditions for specific locations. These statistical models are collectively referred to as model output statistics (MOS), and were developed by the National Weather Service for their suite of weather forecasting models. The United States Air Force developed its own set of MOS based upon their dynamical weather model by 1983.

Model output statistics differ from the perfect prog technique, which assumes that the output of numerical weather prediction guidance is perfect. MOS can correct for local effects that cannot be resolved by the model due to insufficient grid resolution, as well as model biases. Forecast parameters within MOS include maximum and minimum temperatures, percentage chance of rain within a several hour period, precipitation amount expected, chance that the precipitation will be frozen in nature, chance for thunderstorms, cloudiness, and surface winds.

Applications

Climate modeling

In 1956, Norman Phillips developed a mathematical model that realistically depicted monthly and seasonal patterns in the troposphere. This was the first successful climate model. Several groups then began working to create general circulation models. The first general circulation climate model combined oceanic and atmospheric processes and was developed in the late 1960s at the Geophysical Fluid Dynamics Laboratory, a component of the U.S. National Oceanic and Atmospheric Administration. By the early 1980s, the U.S. National Center for Atmospheric Research had developed the Community Atmosphere Model (CAM), which can be run by itself or as the atmospheric component of the Community Climate System Model. The latest update (version 3.1) of the standalone CAM was issued on 1 February 2006. In 1986, efforts began to initialize and model soil and vegetation types, resulting in more realistic forecasts. Coupled ocean-atmosphere climate models, such as the Hadley Centre for Climate Prediction and Research's HadCM3 model, are being used as inputs for climate change studies.

Limited area modeling

Model spread with Hurricane Ernesto (2006) within the National Hurricane Center limited area models

Air pollution forecasts depend on atmospheric models to provide fluid flow information for tracking the movement of pollutants. In 1970, a private company in the U.S. developed the regional Urban Airshed Model (UAM), which was used to forecast the effects of air pollution and acid rain. In the mid- to late-1970s, the United States Environmental Protection Agency took over the development of the UAM and then used the results from a regional air pollution study to improve it. Although the UAM was developed for California, it was during the 1980s used elsewhere in North America, Europe, and Asia.

The Movable Fine-Mesh model, which began operating in 1978, was the first tropical cyclone forecast model to be based on atmospheric dynamics. Despite the constantly improving dynamical model guidance made possible by increasing computational power, it was not until the 1980s that numerical weather prediction (NWP) showed skill in forecasting the track of tropical cyclones. And it was not until the 1990s that NWP consistently outperformed statistical or simple dynamical models. Predicting the intensity of tropical cyclones using NWP has also been challenging. As of 2009, dynamical guidance remained less skillful than statistical methods.

Meteorology

From Wikipedia, the free encyclopedia

Meteorology is a branch of the atmospheric sciences which includes atmospheric chemistry and atmospheric physics, with a major focus on weather forecasting. The study of meteorology dates back millennia, though significant progress in meteorology did not occur until the 18th century. The 19th century saw modest progress in the field after weather observation networks were formed across broad regions. Prior attempts at prediction of weather depended on historical data. It was not until after the elucidation of the laws of physics and more particularly, the development of the computer, allowing for the automated solution of a great many equations that model the weather, in the latter half of the 20th century that significant breakthroughs in weather forecasting were achieved. An important domain of weather forecasting is marine weather forecasting as it relates to maritime and coastal safety, in which weather effects also include atmospheric interactions with large bodies of water.

Meteorological phenomena are observable weather events that are explained by the science of meteorology. Meteorological phenomena are described and quantified by the variables of Earth's atmosphere: temperature, air pressure, water vapour, mass flow, and the variations and interactions of those variables, and how they change over time. Different spatial scales are used to describe and predict weather on local, regional, and global levels.

Meteorology, climatology, atmospheric physics, and atmospheric chemistry are sub-disciplines of the atmospheric sciences. Meteorology and hydrology compose the interdisciplinary field of hydrometeorology. The interactions between Earth's atmosphere and its oceans are part of a coupled ocean-atmosphere system. Meteorology has application in many diverse fields such as the military, energy production, transport, agriculture, and construction.

The word meteorology is from the Ancient Greek μετέωρος metéōros (meteor) and -λογία -logia (-(o)logy), meaning "the study of things high in the air."

History

The ability to predict rains and floods based on annual cycles was evidently used by humans at least from the time of agricultural settlement if not earlier. Early approaches to predicting weather were based on astrology and were practiced by priests. Cuneiform inscriptions on Babylonian tablets included associations between thunder and rain. The Chaldeans differentiated the 22° and 46° halos.

Ancient Indian Upanishads contain mentions of clouds and seasons. The Samaveda mentions sacrifices to be performed when certain phenomena were noticed. Varāhamihira's classical work Brihatsamhita, written about 500 AD, provides evidence of weather observation.

In 350 BC, Aristotle wrote Meteorology. Aristotle is considered the founder of meteorology. One of the most impressive achievements described in the Meteorology is the description of what is now known as the hydrologic cycle.

The book De Mundo (composed before 250 BC or between 350 and 200 BC) noted:

If the flashing body is set on fire and rushes violently to the Earth it is called a thunderbolt; if it is only half of fire, but violent also and massive, it is called a meteor; if it is entirely free from fire, it is called a smoking bolt. They are all called 'swooping bolts' because they swoop down upon the Earth. Lightning is sometimes smoky, and is then called 'smoldering lightning"; sometimes it darts quickly along, and is then said to be vivid. At other times, it travels in crooked lines, and is called forked lightning. When it swoops down upon some object it is called 'swooping lightning'.

The Greek scientist Theophrastus compiled a book on weather forecasting, called the Book of Signs. The work of Theophrastus remained a dominant influence in the study of weather and in weather forecasting for nearly 2,000 years. In 25 AD, Pomponius Mela, a geographer for the Roman Empire, formalized the climatic zone system. According to Toufic Fahd, around the 9th century, Al-Dinawari wrote the Kitab al-Nabat (Book of Plants), in which he deals with the application of meteorology to agriculture during the Arab Agricultural Revolution. He describes the meteorological character of the sky, the planets and constellations, the sun and moon, the lunar phases indicating seasons and rain, the anwa (heavenly bodies of rain), and atmospheric phenomena such as winds, thunder, lightning, snow, floods, valleys, rivers, lakes.

Early attempts at predicting weather were often related to prophecy and divining, and were sometimes based on astrological ideas. Admiral FitzRoy tried to separate scientific approaches from prophetic ones.

Research of visual atmospheric phenomena

Twilight at Baker Beach

Ptolemy wrote on the atmospheric refraction of light in the context of astronomical observations. In 1021, Alhazen showed that atmospheric refraction is also responsible for twilight; he estimated that twilight begins when the sun is 19 degrees below the horizon, and also used a geometric determination based on this to estimate the maximum possible height of the Earth's atmosphere as 52,000 passim (about 49 miles, or 79 km).

St. Albert the Great was the first to propose that each drop of falling rain had the form of a small sphere, and that this form meant that the rainbow was produced by light interacting with each raindrop. Roger Bacon was the first to calculate the angular size of the rainbow. He stated that a rainbow summit can not appear higher than 42 degrees above the horizon. In the late 13th century and early 14th century, Kamāl al-Dīn al-Fārisī and Theodoric of Freiberg were the first to give the correct explanations for the primary rainbow phenomenon. Theoderic went further and also explained the secondary rainbow. In 1716, Edmund Halley suggested that aurorae are caused by "magnetic effluvia" moving along the Earth's magnetic field lines.

Instruments and classification scales

A hemispherical cup anemometer

In 1441, King Sejong's son, Prince Munjong of Korea, invented the first standardized rain gauge. These were sent throughout the Joseon dynasty of Korea as an official tool to assess land taxes based upon a farmer's potential harvest. In 1450, Leone Battista Alberti developed a swinging-plate anemometer, and was known as the first anemometer. In 1607, Galileo Galilei constructed a thermoscope. In 1611, Johannes Kepler wrote the first scientific treatise on snow crystals: "Strena Seu de Nive Sexangula (A New Year's Gift of Hexagonal Snow)." In 1643, Evangelista Torricelli invented the mercury barometer. In 1662, Sir Christopher Wren invented the mechanical, self-emptying, tipping bucket rain gauge. In 1714, Gabriel Fahrenheit created a reliable scale for measuring temperature with a mercury-type thermometer. In 1742, Anders Celsius, a Swedish astronomer, proposed the "centigrade" temperature scale, the predecessor of the current Celsius scale. In 1783, the first hair hygrometer was demonstrated by Horace-Bénédict de Saussure. In 1802–1803, Luke Howard wrote On the Modification of Clouds, in which he assigns cloud types Latin names. In 1806, Francis Beaufort introduced his system for classifying wind speeds. Near the end of the 19th century the first cloud atlases were published, including the International Cloud Atlas, which has remained in print ever since. The April 1960 launch of the first successful weather satellite, TIROS-1, marked the beginning of the age where weather information became available globally.

Atmospheric composition research

In 1648, Blaise Pascal rediscovered that atmospheric pressure decreases with height, and deduced that there is a vacuum above the atmosphere. In 1738, Daniel Bernoulli published Hydrodynamics, initiating the Kinetic theory of gases and established the basic laws for the theory of gases. In 1761, Joseph Black discovered that ice absorbs heat without changing its temperature when melting. In 1772, Black's student Daniel Rutherford discovered nitrogen, which he called phlogisticated air, and together they developed the phlogiston theory. In 1777, Antoine Lavoisier discovered oxygen and developed an explanation for combustion. In 1783, in Lavoisier's essay "Reflexions sur le phlogistique," he deprecates the phlogiston theory and proposes a caloric theory. In 1804, Sir John Leslie observed that a matte black surface radiates heat more effectively than a polished surface, suggesting the importance of black-body radiation. In 1808, John Dalton defended caloric theory in A New System of Chemistry and described how it combines with matter, especially gases; he proposed that the heat capacity of gases varies inversely with atomic weight. In 1824, Sadi Carnot analyzed the efficiency of steam engines using caloric theory; he developed the notion of a reversible process and, in postulating that no such thing exists in nature, laid the foundation for the second law of thermodynamics.

Research into cyclones and air flow

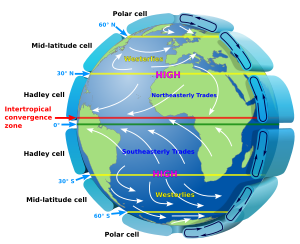
General circulation of the Earth's atmosphere: The westerlies and trade winds are part of the Earth's atmospheric circulation.

In 1494, Christopher Columbus experienced a tropical cyclone, which led to the first written European account of a hurricane. In 1686, Edmund Halley presented a systematic study of the trade winds and monsoons and identified solar heating as the cause of atmospheric motions. In 1735, an ideal explanation of global circulation through study of the trade winds was written by George Hadley. In 1743, when Benjamin Franklin was prevented from seeing a lunar eclipse by a hurricane, he decided that cyclones move in a contrary manner to the winds at their periphery. Understanding the kinematics of how exactly the rotation of the Earth affects airflow was partial at first. Gaspard-Gustave Coriolis published a paper in 1835 on the energy yield of machines with rotating parts, such as waterwheels. In 1856, William Ferrel proposed the existence of a circulation cell in the mid-latitudes, and the air within deflected by the Coriolis force resulting in the prevailing westerly winds. Late in the 19th century, the motion of air masses along isobars was understood to be the result of the large-scale interaction of the pressure gradient force and the deflecting force. By 1912, this deflecting force was named the Coriolis effect. Just after World War I, a group of meteorologists in Norway led by Vilhelm Bjerknes developed the Norwegian cyclone model that explains the generation, intensification and ultimate decay (the life cycle) of mid-latitude cyclones, and introduced the idea of fronts, that is, sharply defined boundaries between air masses. The group included Carl-Gustaf Rossby (who was the first to explain the large scale atmospheric flow in terms of fluid dynamics), Tor Bergeron (who first determined how rain forms) and Jacob Bjerknes.

Observation networks and weather forecasting

Cloud classification by altitude of occurrence
 
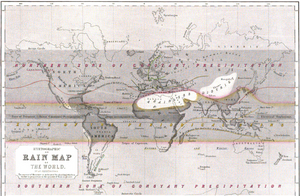
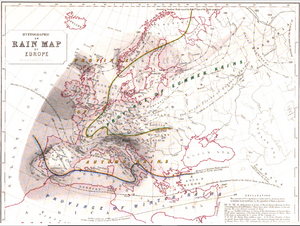
This "Hyetographic or Rain Map of the World " was first published 1848 by Alexander Keith Johnston.
 
This "Hyetographic or Rain Map of Europe" was also published in 1848 as part of "The Physical Atlas".

In the late 16th century and first half of the 17th century a range of meteorological instruments were invented – the thermometer, barometer, hydrometer, as well as wind and rain gauges. In the 1650s natural philosophers started using these instruments to systematically record weather observations. Scientific academies established weather diaries and organised observational networks. In 1654, Ferdinando II de Medici established the first weather observing network, that consisted of meteorological stations in Florence, Cutigliano, Vallombrosa, Bologna, Parma, Milan, Innsbruck, Osnabrück, Paris and Warsaw. The collected data were sent to Florence at regular time intervals. In the 1660s Robert Hooke of the Royal Society of London sponsored networks of weather observers. Hippocrates' treatise Airs, Waters, and Places had linked weather to disease. Thus early meteorologists attempted to correlate weather patterns with epidemic outbreaks, and the climate with public health.

During the Age of Enlightenment meteorology tried to rationalise traditional weather lore, including astrological meteorology. But there were also attempts to establish a theoretical understanding of weather phenomena. Edmond Halley and George Hadley tried to explain trade winds. They reasoned that the rising mass of heated equator air is replaced by an inflow of cooler air from high latitudes. A flow of warm air at high altitude from equator to poles in turn established an early picture of circulation. Frustration with the lack of discipline among weather observers, and the poor quality of the instruments, led the early modern nation states to organise large observation networks. Thus by the end of the 18th century, meteorologists had access to large quantities of reliable weather data. In 1832, an electromagnetic telegraph was created by Baron Schilling. The arrival of the electrical telegraph in 1837 afforded, for the first time, a practical method for quickly gathering surface weather observations from a wide area.

This data could be used to produce maps of the state of the atmosphere for a region near the Earth's surface and to study how these states evolved through time. To make frequent weather forecasts based on these data required a reliable network of observations, but it was not until 1849 that the Smithsonian Institution began to establish an observation network across the United States under the leadership of Joseph Henry. Similar observation networks were established in Europe at this time. The Reverend William Clement Ley was key in understanding of cirrus clouds and early understandings of Jet Streams. Charles Kenneth Mackinnon Douglas, known as 'CKM' Douglas read Ley's papers after his death and carried on the early study of weather systems. Nineteenth century researchers in meteorology were drawn from military or medical backgrounds, rather than trained as dedicated scientists. In 1854, the United Kingdom government appointed Robert FitzRoy to the new office of Meteorological Statist to the Board of Trade with the task of gathering weather observations at sea. FitzRoy's office became the United Kingdom Meteorological Office in 1854, the second oldest national meteorological service in the world (the Central Institution for Meteorology and Geodynamics (ZAMG) in Austria was founded in 1851 and is the oldest weather service in the world). The first daily weather forecasts made by FitzRoy's Office were published in The Times newspaper in 1860. The following year a system was introduced of hoisting storm warning cones at principal ports when a gale was expected.

Over the next 50 years, many countries established national meteorological services. The India Meteorological Department (1875) was established to follow tropical cyclone and monsoon. The Finnish Meteorological Central Office (1881) was formed from part of Magnetic Observatory of Helsinki University. Japan's Tokyo Meteorological Observatory, the forerunner of the Japan Meteorological Agency, began constructing surface weather maps in 1883. The United States Weather Bureau (1890) was established under the United States Department of Agriculture. The Australian Bureau of Meteorology (1906) was established by a Meteorology Act to unify existing state meteorological services.

Numerical weather prediction

A meteorologist at the console of the IBM 7090 in the Joint Numerical Weather Prediction Unit. c. 1965

In 1904, Norwegian scientist Vilhelm Bjerknes first argued in his paper Weather Forecasting as a Problem in Mechanics and Physics that it should be possible to forecast weather from calculations based upon natural laws.

It was not until later in the 20th century that advances in the understanding of atmospheric physics led to the foundation of modern numerical weather prediction. In 1922, Lewis Fry Richardson published "Weather Prediction By Numerical Process," after finding notes and derivations he worked on as an ambulance driver in World War I. He described how small terms in the prognostic fluid dynamics equations that govern atmospheric flow could be neglected, and a numerical calculation scheme that could be devised to allow predictions. Richardson envisioned a large auditorium of thousands of people performing the calculations. However, the sheer number of calculations required was too large to complete without electronic computers, and the size of the grid and time steps used in the calculations led to unrealistic results. Though numerical analysis later found that this was due to numerical instability.

Starting in the 1950s, numerical forecasts with computers became feasible. The first weather forecasts derived this way used barotropic (single-vertical-level) models, and could successfully predict the large-scale movement of midlatitude Rossby waves, that is, the pattern of atmospheric lows and highs. In 1959, the UK Meteorological Office received its first computer, a Ferranti Mercury.

In the 1960s, the chaotic nature of the atmosphere was first observed and mathematically described by Edward Lorenz, founding the field of chaos theory. These advances have led to the current use of ensemble forecasting in most major forecasting centers, to take into account uncertainty arising from the chaotic nature of the atmosphere. Mathematical models used to predict the long term weather of the Earth (climate models), have been developed that have a resolution today that are as coarse as the older weather prediction models. These climate models are used to investigate long-term climate shifts, such as what effects might be caused by human emission of greenhouse gases.

Meteorologists

Meteorologists are scientists who study and work in the field of meteorology. The American Meteorological Society publishes and continually updates an authoritative electronic Meteorology Glossary. Meteorologists work in government agencies, private consulting and research services, industrial enterprises, utilities, radio and television stations, and in education. In the United States, meteorologists held about 10,000 jobs in 2018.

Although weather forecasts and warnings are the best known products of meteorologists for the public, weather presenters on radio and television are not necessarily professional meteorologists. They are most often reporters with little formal meteorological training, using unregulated titles such as weather specialist or weatherman. The American Meteorological Society and National Weather Association issue "Seals of Approval" to weather broadcasters who meet certain requirements but this is not mandatory to be hired by the medias.

Equipment

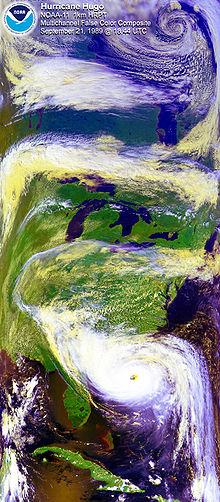
Satellite image of Hurricane Hugo with a polar low visible at the top of the image

Each science has its own unique sets of laboratory equipment. In the atmosphere, there are many things or qualities of the atmosphere that can be measured. Rain, which can be observed, or seen anywhere and anytime was one of the first atmospheric qualities measured historically. Also, two other accurately measured qualities are wind and humidity. Neither of these can be seen but can be felt. The devices to measure these three sprang up in the mid-15th century and were respectively the rain gauge, the anemometer, and the hygrometer. Many attempts had been made prior to the 15th century to construct adequate equipment to measure the many atmospheric variables. Many were faulty in some way or were simply not reliable. Even Aristotle noted this in some of his work as the difficulty to measure the air.

Sets of surface measurements are important data to meteorologists. They give a snapshot of a variety of weather conditions at one single location and are usually at a weather station, a ship or a weather buoy. The measurements taken at a weather station can include any number of atmospheric observables. Usually, temperature, pressure, wind measurements, and humidity are the variables that are measured by a thermometer, barometer, anemometer, and hygrometer, respectively. Professional stations may also include air quality sensors (carbon monoxide, carbon dioxide, methane, ozone, dust, and smoke), ceilometer (cloud ceiling), falling precipitation sensor, flood sensor, lightning sensor, microphone (explosions, sonic booms, thunder), pyranometer/pyrheliometer/spectroradiometer (IR/Vis/UV photodiodes), rain gauge/snow gauge, scintillation counter (background radiation, fallout, radon), seismometer (earthquakes and tremors), transmissometer (visibility), and a GPS clock for data logging. Upper air data are of crucial importance for weather forecasting. The most widely used technique is launches of radiosondes. Supplementing the radiosondes a network of aircraft collection is organized by the World Meteorological Organization.

Remote sensing, as used in meteorology, is the concept of collecting data from remote weather events and subsequently producing weather information. The common types of remote sensing are Radar, Lidar, and satellites (or photogrammetry). Each collects data about the atmosphere from a remote location and, usually, stores the data where the instrument is located. Radar and Lidar are not passive because both use EM radiation to illuminate a specific portion of the atmosphere. Weather satellites along with more general-purpose Earth-observing satellites circling the earth at various altitudes have become an indispensable tool for studying a wide range of phenomena from forest fires to El Niño.

Spatial scales

The study of the atmosphere can be divided into distinct areas that depend on both time and spatial scales. At one extreme of this scale is climatology. In the timescales of hours to days, meteorology separates into micro-, meso-, and synoptic scale meteorology. Respectively, the geospatial size of each of these three scales relates directly with the appropriate timescale.

Other subclassifications are used to describe the unique, local, or broad effects within those subclasses.

Typical Scales of Atmospheric Motion Systems
Type of motion Horizontal scale (meter)
Molecular mean free path 10−7
Minute turbulent eddies 10−2 – 10−1
Small eddies 10−1 – 1
Dust devils 1–10
Gusts 10 – 102
Tornadoes 102
Thunderclouds 103
Fronts, squall lines 104 – 105
Hurricanes 105
Synoptic Cyclones 106
Planetary waves 107
Atmospheric tides 107
Mean zonal wind 107

Microscale

Microscale meteorology is the study of atmospheric phenomena on a scale of about 1 kilometre (0.62 mi) or less. Individual thunderstorms, clouds, and local turbulence caused by buildings and other obstacles (such as individual hills) are modeled on this scale.

Mesoscale

Mesoscale meteorology is the study of atmospheric phenomena that has horizontal scales ranging from 1 km to 1000 km and a vertical scale that starts at the Earth's surface and includes the atmospheric boundary layer, troposphere, tropopause, and the lower section of the stratosphere. Mesoscale timescales last from less than a day to multiple weeks. The events typically of interest are thunderstorms, squall lines, fronts, precipitation bands in tropical and extratropical cyclones, and topographically generated weather systems such as mountain waves and sea and land breezes.

Synoptic scale

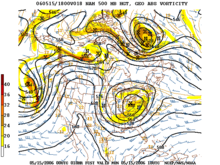
NOAA: Synoptic scale weather analysis.

Synoptic scale meteorology predicts atmospheric changes at scales up to 1000 km and 105 sec (28 days), in time and space. At the synoptic scale, the Coriolis acceleration acting on moving air masses (outside of the tropics) plays a dominant role in predictions. The phenomena typically described by synoptic meteorology include events such as extratropical cyclones, baroclinic troughs and ridges, frontal zones, and to some extent jet streams. All of these are typically given on weather maps for a specific time. The minimum horizontal scale of synoptic phenomena is limited to the spacing between surface observation stations.

Global scale

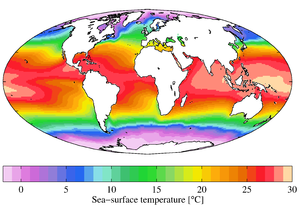
Annual mean sea surface temperatures.

Global scale meteorology is the study of weather patterns related to the transport of heat from the tropics to the poles. Very large scale oscillations are of importance at this scale. These oscillations have time periods typically on the order of months, such as the Madden–Julian oscillation, or years, such as the El Niño–Southern Oscillation and the Pacific decadal oscillation. Global scale meteorology pushes into the range of climatology. The traditional definition of climate is pushed into larger timescales and with the understanding of the longer time scale global oscillations, their effect on climate and weather disturbances can be included in the synoptic and mesoscale timescales predictions.

Numerical Weather Prediction is a main focus in understanding air–sea interaction, tropical meteorology, atmospheric predictability, and tropospheric/stratospheric processes. The Naval Research Laboratory in Monterey, California, developed a global atmospheric model called Navy Operational Global Atmospheric Prediction System (NOGAPS). NOGAPS is run operationally at Fleet Numerical Meteorology and Oceanography Center for the United States Military. Many other global atmospheric models are run by national meteorological agencies.

Some meteorological principles

Boundary layer meteorology

Boundary layer meteorology is the study of processes in the air layer directly above Earth's surface, known as the atmospheric boundary layer (ABL). The effects of the surface – heating, cooling, and friction – cause turbulent mixing within the air layer. Significant movement of heat, matter, or momentum on time scales of less than a day are caused by turbulent motions. Boundary layer meteorology includes the study of all types of surface–atmosphere boundary, including ocean, lake, urban land and non-urban land for the study of meteorology.

Dynamic meteorology

Dynamic meteorology generally focuses on the fluid dynamics of the atmosphere. The idea of air parcel is used to define the smallest element of the atmosphere, while ignoring the discrete molecular and chemical nature of the atmosphere. An air parcel is defined as a point in the fluid continuum of the atmosphere. The fundamental laws of fluid dynamics, thermodynamics, and motion are used to study the atmosphere. The physical quantities that characterize the state of the atmosphere are temperature, density, pressure, etc. These variables have unique values in the continuum.

Applications

Weather forecasting

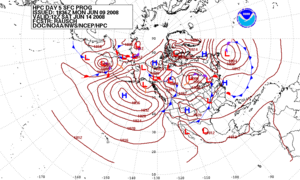
Forecast of surface pressures five days into the future for the north Pacific, North America, and north Atlantic Ocean

Weather forecasting is the application of science and technology to predict the state of the atmosphere at a future time and given location. Humans have attempted to predict the weather informally for millennia and formally since at least the 19th century.er forecasts are made by collecting quantitative data about the current state of the atmosphere and using scientific understanding of atmospheric processes to project how the atmosphere will evolve.

Once an all-human endeavor based mainly upon changes in barometric pressure, current weather conditions, and sky condition, forecast models are now used to determine future conditions. Human input is still required to pick the best possible forecast model to base the forecast upon, which involves pattern recognition skills, teleconnections, knowledge of model performance, and knowledge of model biases. The chaotic nature of the atmosphere, the massive computational power required to solve the equations that describe the atmosphere, error involved in measuring the initial conditions, and an incomplete understanding of atmospheric processes mean that forecasts become less accurate as the difference in current time and the time for which the forecast is being made (the range of the forecast) increases. The use of ensembles and model consensus help narrow the error and pick the most likely outcome.

There are a variety of end uses to weather forecasts. Weather warnings are important forecasts because they are used to protect life and property. Forecasts based on temperature and precipitation are important to agriculture, and therefore to commodity traders within stock markets. Temperature forecasts are used by utility companies to estimate demand over coming days. On an everyday basis, people use weather forecasts to determine what to wear. Since outdoor activities are severely curtailed by heavy rain, snow, and wind chill, forecasts can be used to plan activities around these events, and to plan ahead and survive them.

Aviation meteorology

Aviation meteorology deals with the impact of weather on air traffic management. It is important for air crews to understand the implications of weather on their flight plan as well as their aircraft, as noted by the Aeronautical Information Manual:

The effects of ice on aircraft are cumulative—thrust is reduced, drag increases, lift lessens, and weight increases. The results are an increase in stall speed and a deterioration of aircraft performance. In extreme cases, 2 to 3 inches of ice can form on the leading edge of the airfoil in less than 5 minutes. It takes but 1/2 inch of ice to reduce the lifting power of some aircraft by 50 percent and increases the frictional drag by an equal percentage.

Agricultural meteorology

Meteorologists, soil scientists, agricultural hydrologists, and agronomists are people concerned with studying the effects of weather and climate on plant distribution, crop yield, water-use efficiency, phenology of plant and animal development, and the energy balance of managed and natural ecosystems. Conversely, they are interested in the role of vegetation on climate and weather.

Hydrometeorology

Hydrometeorology is the branch of meteorology that deals with the hydrologic cycle, the water budget, and the rainfall statistics of storms. A hydrometeorologist prepares and issues forecasts of accumulating (quantitative) precipitation, heavy rain, heavy snow, and highlights areas with the potential for flash flooding. Typically the range of knowledge that is required overlaps with climatology, mesoscale and synoptic meteorology, and other geosciences.

The multidisciplinary nature of the branch can result in technical challenges, since tools and solutions from each of the individual disciplines involved may behave slightly differently, be optimized for different hard- and software platforms and use different data formats. There are some initiatives – such as the DRIHM project – that are trying to address this issue.

Nuclear meteorology

Nuclear meteorology investigates the distribution of radioactive aerosols and gases in the atmosphere.

Maritime meteorology

Maritime meteorology deals with air and wave forecasts for ships operating at sea. Organizations such as the Ocean Prediction Center, Honolulu National Weather Service forecast office, United Kingdom Met Office, and JMA prepare high seas forecasts for the world's oceans.

Military meteorology

Military meteorology is the research and application of meteorology for military purposes. In the United States, the United States Navy's Commander, Naval Meteorology and Oceanography Command oversees meteorological efforts for the Navy and Marine Corps while the United States Air Force's Air Force Weather Agency is responsible for the Air Force and Army.

Environmental meteorology

Environmental meteorology mainly analyzes industrial pollution dispersion physically and chemically based on meteorological parameters such as temperature, humidity, wind, and various weather conditions.

Renewable energy

Meteorology applications in renewable energy includes basic research, "exploration," and potential mapping of wind power and solar radiation for wind and solar energy.

Frequency domain

From Wikipedia, the free encyclopedia https://en.wikipedia.org/wiki/Frequency_domain ...