Search This Blog

Wednesday, September 23, 2020

Food web

From Wikipedia, the free encyclopedia
 

A food web (or food cycle) is the natural interconnection of food chains and a graphical representation (usually an image) of what-eats-what in an ecological community. Another name for food web is consumer-resource system. Ecologists can broadly lump all life forms into one of two categories called trophic levels: 1) the autotrophs, and 2) the heterotrophs. To maintain their bodies, grow, develop, and to reproduce, autotrophs produce organic matter from inorganic substances, including both minerals and gases such as carbon dioxide. These chemical reactions require energy, which mainly comes from the Sun and largely by photosynthesis, although a very small amount comes from bioelectrogenesis in wetlands, and mineral electron donors in hydrothermal vents and hot springs. A gradient exists between trophic levels running from complete autotrophs that obtain their sole source of carbon from the atmosphere, to mixotrophs (such as carnivorous plants) that are autotrophic organisms that partially obtain organic matter from sources other than the atmosphere, and complete heterotrophs that must feed to obtain organic matter. The linkages in a food web illustrate the feeding pathways, such as where heterotrophs obtain organic matter by feeding on autotrophs and other heterotrophs. The food web is a simplified illustration of the various methods of feeding that links an ecosystem into a unified system of exchange. There are different kinds of feeding relations that can be roughly divided into herbivory, carnivory, scavenging and parasitism. Some of the organic matter eaten by heterotrophs, such as sugars, provides energy. Autotrophs and heterotrophs come in all sizes, from microscopic to many tonnes - from cyanobacteria to giant redwoods, and from viruses and bdellovibrio to blue whales.

Charles Elton pioneered the concept of food cycles, food chains, and food size in his classical 1927 book "Animal Ecology"; Elton's 'food cycle' was replaced by 'food web' in a subsequent ecological text. Elton organized species into functional groups, which was the basis for Raymond Lindeman's classic and landmark paper in 1942 on trophic dynamics. Lindeman emphasized the important role of decomposer organisms in a trophic system of classification. The notion of a food web has a historical foothold in the writings of Charles Darwin and his terminology, including an "entangled bank", "web of life", "web of complex relations", and in reference to the decomposition actions of earthworms he talked about "the continued movement of the particles of earth". Even earlier, in 1768 John Bruckner described nature as "one continued web of life".

Food webs are limited representations of real ecosystems as they necessarily aggregate many species into trophic species, which are functional groups of species that have the same predators and prey in a food web. Ecologists use these simplifications in quantitative (or mathematical representation) models of trophic or consumer-resource systems dynamics. Using these models they can measure and test for generalized patterns in the structure of real food web networks. Ecologists have identified non-random properties in the topographic structure of food webs. Published examples that are used in meta analysis are of variable quality with omissions. However, the number of empirical studies on community webs is on the rise and the mathematical treatment of food webs using network theory had identified patterns that are common to all. Scaling laws, for example, predict a relationship between the topology of food web predator-prey linkages and levels of species richness.

Taxonomy of a food web

A simplified food web illustrating a three trophic food chain (producers-herbivores-carnivores) linked to decomposers. The movement of mineral nutrients is cyclic, whereas the movement of energy is unidirectional and noncyclic. Trophic species are encircled as nodes and arrows depict the links.
 
Food webs are the road-maps through Darwin's famous 'entangled bank' and have a long history in ecology. Like maps of unfamiliar ground, food webs appear bewilderingly complex. They were often published to make just that point. Yet recent studies have shown that food webs from a wide range of terrestrial, freshwater, and marine communities share a remarkable list of patterns.

Links in food webs map the feeding connections (who eats whom) in an ecological community. Food cycle is an obsolete term that is synonymous with food web. Ecologists can broadly group all life forms into one of two trophic layers, the autotrophs and the heterotrophs. Autotrophs produce more biomass energy, either chemically without the sun's energy or by capturing the sun's energy in photosynthesis, than they use during metabolic respiration. Heterotrophs consume rather than produce biomass energy as they metabolize, grow, and add to levels of secondary production. A food web depicts a collection of polyphagous heterotrophic consumers that network and cycle the flow of energy and nutrients from a productive base of self-feeding autotrophs.

The base or basal species in a food web are those species without prey and can include autotrophs or saprophytic detritivores (i.e., the community of decomposers in soil, biofilms, and periphyton). Feeding connections in the web are called trophic links. The number of trophic links per consumer is a measure of food web connectance. Food chains are nested within the trophic links of food webs. Food chains are linear (noncyclic) feeding pathways that trace monophagous consumers from a base species up to the top consumer, which is usually a larger predatory carnivore.

Linkages connect to nodes in a food web, which are aggregates of biological taxa called trophic species. Trophic species are functional groups that have the same predators and prey in a food web. Common examples of an aggregated node in a food web might include parasites, microbes, decomposers, saprotrophs, consumers, or predators, each containing many species in a web that can otherwise be connected to other trophic species.

Trophic levels

A trophic pyramid (a) and a simplified community food web (b) illustrating ecological relations among creatures that are typical of a northern Boreal terrestrial ecosystem. The trophic pyramid roughly represents the biomass (usually measured as total dry-weight) at each level. Plants generally have the greatest biomass. Names of trophic categories are shown to the right of the pyramid. Some ecosystems, such as many wetlands, do not organize as a strict pyramid, because aquatic plants are not as productive as long-lived terrestrial plants such as trees. Ecological trophic pyramids are typically one of three kinds: 1) pyramid of numbers, 2) pyramid of biomass, or 3) pyramid of energy.

Food webs have trophic levels and positions. Basal species, such as plants, form the first level and are the resource limited species that feed on no other living creature in the web. Basal species can be autotrophs or detritivores, including "decomposing organic material and its associated microorganisms which we defined as detritus, micro-inorganic material and associated microorganisms (MIP), and vascular plant material." Most autotrophs capture the sun's energy in chlorophyll, but some autotrophs (the chemolithotrophs) obtain energy by the chemical oxidation of inorganic compounds and can grow in dark environments, such as the sulfur bacterium Thiobacillus, which lives in hot sulfur springs. The top level has top (or apex) predators which no other species kills directly for its food resource needs. The intermediate levels are filled with omnivores that feed on more than one trophic level and cause energy to flow through a number of food pathways starting from a basal species.

In the simplest scheme, the first trophic level (level 1) is plants, then herbivores (level 2), and then carnivores (level 3). The trophic level is equal to one more than the chain length, which is the number of links connecting to the base. The base of the food chain (primary producers or detritivores) is set at zero. Ecologists identify feeding relations and organize species into trophic species through extensive gut content analysis of different species. The technique has been improved through the use of stable isotopes to better trace energy flow through the web. It was once thought that omnivory was rare, but recent evidence suggests otherwise. This realization has made trophic classifications more complex.

Trophic dynamics

The trophic level concept was introduced in a historical landmark paper on trophic dynamics in 1942 by Raymond L. Lindeman. The basis of trophic dynamics is the transfer of energy from one part of the ecosystem to another. The trophic dynamic concept has served as a useful quantitative heuristic, but it has several major limitations including the precision by which an organism can be allocated to a specific trophic level. Omnivores, for example, are not restricted to any single level. Nonetheless, recent research has found that discrete trophic levels do exist, but "above the herbivore trophic level, food webs are better characterized as a tangled web of omnivores."

A central question in the trophic dynamic literature is the nature of control and regulation over resources and production. Ecologists use simplified one trophic position food chain models (producer, carnivore, decomposer). Using these models, ecologists have tested various types of ecological control mechanisms. For example, herbivores generally have an abundance of vegetative resources, which meant that their populations were largely controlled or regulated by predators. This is known as the top-down hypothesis or 'green-world' hypothesis. Alternatively to the top-down hypothesis, not all plant material is edible and the nutritional quality or antiherbivore defenses of plants (structural and chemical) suggests a bottom-up form of regulation or control. Recent studies have concluded that both "top-down" and "bottom-up" forces can influence community structure and the strength of the influence is environmentally context dependent. These complex multitrophic interactions involve more than two trophic levels in a food web.

Another example of a multi-trophic interaction is a trophic cascade, in which predators help to increase plant growth and prevent overgrazing by suppressing herbivores. Links in a food-web illustrate direct trophic relations among species, but there are also indirect effects that can alter the abundance, distribution, or biomass in the trophic levels. For example, predators eating herbivores indirectly influence the control and regulation of primary production in plants. Although the predators do not eat the plants directly, they regulate the population of herbivores that are directly linked to plant trophism. The net effect of direct and indirect relations is called trophic cascades. Trophic cascades are separated into species-level cascades, where only a subset of the food-web dynamic is impacted by a change in population numbers, and community-level cascades, where a change in population numbers has a dramatic effect on the entire food-web, such as the distribution of plant biomass.

Energy flow and biomass

Energy flow diagram of a frog. The frog represents a node in an extended food web. The energy ingested is utilized for metabolic processes and transformed into biomass. The energy flow continues on its path if the frog is ingested by predators, parasites, or as a decaying carcass in soil. This energy flow diagram illustrates how energy is lost as it fuels the metabolic process that transform the energy and nutrients into biomass.

The Law of Conservation of Mass dates from Antoine Lavoisier's 1789 discovery that mass is neither created nor destroyed in chemical reactions. In other words, the mass of any one element at the beginning of a reaction will equal the mass of that element at the end of the reaction.
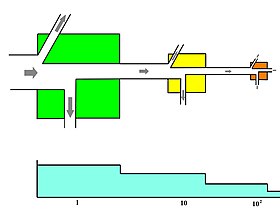
An expanded three link energy food chain (1. plants, 2. herbivores, 3. carnivores) illustrating the relationship between food flow diagrams and energy transformity. The transformity of energy becomes degraded, dispersed, and diminished from higher quality to lesser quantity as the energy within a food chain flows from one trophic species into another. Abbreviations: I=input, A=assimilation, R=respiration, NU=not utilized, P=production, B=biomass.

Food webs depict energy flow via trophic linkages. Energy flow is directional, which contrasts against the cyclic flows of material through the food web systems. Energy flow "typically includes production, consumption, assimilation, non-assimilation losses (feces), and respiration (maintenance costs)." In a very general sense, energy flow (E) can be defined as the sum of metabolic production (P) and respiration (R), such that E=P+R.

Biomass represents stored energy. However, concentration and quality of nutrients and energy is variable. Many plant fibers, for example, are indigestible to many herbivores leaving grazer community food webs more nutrient limited than detrital food webs where bacteria are able to access and release the nutrient and energy stores. "Organisms usually extract energy in the form of carbohydrates, lipids, and proteins. These polymers have a dual role as supplies of energy as well as building blocks; the part that functions as energy supply results in the production of nutrients (and carbon dioxide, water, and heat). Excretion of nutrients is, therefore, basic to metabolism." The units in energy flow webs are typically a measure mass or energy per m2 per unit time. Different consumers are going to have different metabolic assimilation efficiencies in their diets. Each trophic level transforms energy into biomass. Energy flow diagrams illustrate the rates and efficiency of transfer from one trophic level into another and up through the hierarchy.

It is the case that the biomass of each trophic level decreases from the base of the chain to the top. This is because energy is lost to the environment with each transfer as entropy increases. About eighty to ninety percent of the energy is expended for the organism's life processes or is lost as heat or waste. Only about ten to twenty percent of the organism's energy is generally passed to the next organism. The amount can be less than one percent in animals consuming less digestible plants, and it can be as high as forty percent in zooplankton consuming phytoplankton. Graphic representations of the biomass or productivity at each tropic level are called ecological pyramids or trophic pyramids. The transfer of energy from primary producers to top consumers can also be characterized by energy flow diagrams.

Food chain

A common metric used to quantify food web trophic structure is food chain length. Food chain length is another way of describing food webs as a measure of the number of species encountered as energy or nutrients move from the plants to top predators. There are different ways of calculating food chain length depending on what parameters of the food web dynamic are being considered: connectance, energy, or interaction. In its simplest form, the length of a chain is the number of links between a trophic consumer and the base of the web. The mean chain length of an entire web is the arithmetic average of the lengths of all chains in a food web.

In a simple predator-prey example, a deer is one step removed from the plants it eats (chain length = 1) and a wolf that eats the deer is two steps removed from the plants (chain length = 2). The relative amount or strength of influence that these parameters have on the food web address questions about:

  • the identity or existence of a few dominant species (called strong interactors or keystone species)
  • the total number of species and food-chain length (including many weak interactors) and
  • how community structure, function and stability is determined.

Ecological pyramids

Illustration of a range of ecological pyramids, including top pyramid of numbers, middle pyramid of biomass, and bottom pyramid of energy. The terrestrial forest (summer) and the English Channel ecosystems exhibit inverted pyramids.Note: trophic levels are not drawn to scale and the pyramid of numbers excludes microorganisms and soil animals. Abbreviations: P=Producers, C1=Primary consumers, C2=Secondary consumers, C3=Tertiary consumers, S=Saprotrophs.
 
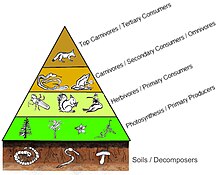
A four level trophic pyramid sitting on a layer of soil and its community of decomposers.
 
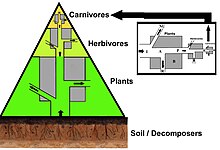
A three layer trophic pyramid linked to the biomass and energy flow concepts.

In a pyramid of numbers, the number of consumers at each level decreases significantly, so that a single top consumer, (e.g., a polar bear or a human), will be supported by a much larger number of separate producers. There is usually a maximum of four or five links in a food chain, although food chains in aquatic ecosystems are more often longer than those on land. Eventually, all the energy in a food chain is dispersed as heat.

Ecological pyramids place the primary producers at the base. They can depict different numerical properties of ecosystems, including numbers of individuals per unit of area, biomass (g/m2), and energy (k cal m−2 yr−1). The emergent pyramidal arrangement of trophic levels with amounts of energy transfer decreasing as species become further removed from the source of production is one of several patterns that is repeated amongst the planets ecosystems. The size of each level in the pyramid generally represents biomass, which can be measured as the dry weight of an organism. Autotrophs may have the highest global proportion of biomass, but they are closely rivaled or surpassed by microbes.

Pyramid structure can vary across ecosystems and across time. In some instances biomass pyramids can be inverted. This pattern is often identified in aquatic and coral reef ecosystems. The pattern of biomass inversion is attributed to different sizes of producers. Aquatic communities are often dominated by producers that are smaller than the consumers that have high growth rates. Aquatic producers, such as planktonic algae or aquatic plants, lack the large accumulation of secondary growth as exists in the woody trees of terrestrial ecosystems. However, they are able to reproduce quickly enough to support a larger biomass of grazers. This inverts the pyramid. Primary consumers have longer lifespans and slower growth rates that accumulates more biomass than the producers they consume. Phytoplankton live just a few days, whereas the zooplankton eating the phytoplankton live for several weeks and the fish eating the zooplankton live for several consecutive years. Aquatic predators also tend to have a lower death rate than the smaller consumers, which contributes to the inverted pyramidal pattern. Population structure, migration rates, and environmental refuge for prey are other possible causes for pyramids with biomass inverted. Energy pyramids, however, will always have an upright pyramid shape if all sources of food energy are included and this is dictated by the second law of thermodynamics.

Material flux and recycling

Many of the Earth's elements and minerals (or mineral nutrients) are contained within the tissues and diets of organisms. Hence, mineral and nutrient cycles trace food web energy pathways. Ecologists employ stoichiometry to analyze the ratios of the main elements found in all organisms: carbon (C), nitrogen (N), phosphorus (P). There is a large transitional difference between many terrestrial and aquatic systems as C:P and C:N ratios are much higher in terrestrial systems while N:P ratios are equal between the two systems. Mineral nutrients are the material resources that organisms need for growth, development, and vitality. Food webs depict the pathways of mineral nutrient cycling as they flow through organisms. Most of the primary production in an ecosystem is not consumed, but is recycled by detritus back into useful nutrients. Many of the Earth's microorganisms are involved in the formation of minerals in a process called biomineralization. Bacteria that live in detrital sediments create and cycle nutrients and biominerals. Food web models and nutrient cycles have traditionally been treated separately, but there is a strong functional connection between the two in terms of stability, flux, sources, sinks, and recycling of mineral nutrients.

Kinds of food webs

Food webs are necessarily aggregated and only illustrate a tiny portion of the complexity of real ecosystems. For example, the number of species on the planet are likely in the general order of 107, over 95% of these species consist of microbes and invertebrates, and relatively few have been named or classified by taxonomists. It is explicitly understood that natural systems are 'sloppy' and that food web trophic positions simplify the complexity of real systems that sometimes overemphasize many rare interactions. Most studies focus on the larger influences where the bulk of energy transfer occurs. "These omissions and problems are causes for concern, but on present evidence do not present insurmountable difficulties."

Paleoecological studies can reconstruct fossil food-webs and trophic levels. Primary producers form the base (red spheres), predators at top (yellow spheres), the lines represent feeding links. Original food-webs (left) are simplified (right) by aggregating groups feeding on common prey into coarser grained trophic species.

There are different kinds or categories of food webs:

  • Source web - one or more node(s), all of their predators, all the food these predators eat, and so on.
  • Sink web - one or more node(s), all of their prey, all the food that these prey eat, and so on.
  • Community (or connectedness) web - a group of nodes and all the connections of who eats whom.
  • Energy flow web - quantified fluxes of energy between nodes along links between a resource and a consumer.
  • Paleoecological web - a web that reconstructs ecosystems from the fossil record.
  • Functional web - emphasizes the functional significance of certain connections having strong interaction strength and greater bearing on community organization, more so than energy flow pathways. Functional webs have compartments, which are sub-groups in the larger network where there are different densities and strengths of interaction. Functional webs emphasize that "the importance of each population in maintaining the integrity of a community is reflected in its influence on the growth rates of other populations."

Within these categories, food webs can be further organized according to the different kinds of ecosystems being investigated. For example, human food webs, agricultural food webs, detrital food webs, marine food webs, aquatic food webs, soil food webs, Arctic (or polar) food webs, terrestrial food webs, and microbial food webs. These characterizations stem from the ecosystem concept, which assumes that the phenomena under investigation (interactions and feedback loops) are sufficient to explain patterns within boundaries, such as the edge of a forest, an island, a shoreline, or some other pronounced physical characteristic.

An illustration of a soil food web.

Detrital web

In a detrital web, plant and animal matter is broken down by decomposers, e.g., bacteria and fungi, and moves to detritivores and then carnivores. There are often relationships between the detrital web and the grazing web. Mushrooms produced by decomposers in the detrital web become a food source for deer, squirrels, and mice in the grazing web. Earthworms eaten by robins are detritivores consuming decaying leaves.

"Detritus can be broadly defined as any form of non-living organic matter, including different types of plant tissue (e.g. leaf litter, dead wood, aquatic macrophytes, algae), animal tissue (carrion), dead microbes, faeces (manure, dung, faecal pellets, guano, frass), as well as products secreted, excreted or exuded from organisms (e.g. extra-cellular polymers, nectar, root exudates and leachates, dissolved organic matter, extra-cellular matrix, mucilage). The relative importance of these forms of detritus, in terms of origin, size and chemical composition, varies across ecosystems."

Quantitative food webs

Ecologists collect data on trophic levels and food webs to statistically model and mathematically calculate parameters, such as those used in other kinds of network analysis (e.g., graph theory), to study emergent patterns and properties shared among ecosystems. There are different ecological dimensions that can be mapped to create more complicated food webs, including: species composition (type of species), richness (number of species), biomass (the dry weight of plants and animals), productivity (rates of conversion of energy and nutrients into growth), and stability (food webs over time). A food web diagram illustrating species composition shows how change in a single species can directly and indirectly influence many others. Microcosm studies are used to simplify food web research into semi-isolated units such as small springs, decaying logs, and laboratory experiments using organisms that reproduce quickly, such as daphnia feeding on algae grown under controlled environments in jars of water.

While the complexity of real food webs connections are difficult to decipher, ecologists have found mathematical models on networks an invaluable tool for gaining insight into the structure, stability, and laws of food web behaviours relative to observable outcomes. "Food web theory centers around the idea of connectance." Quantitative formulas simplify the complexity of food web structure. The number of trophic links (tL), for example, is converted into a connectance value:

,

where, S(S-1)/2 is the maximum number of binary connections among S species. "Connectance (C) is the fraction of all possible links that are realized (L/S2) and represents a standard measure of food web complexity..." The distance (d) between every species pair in a web is averaged to compute the mean distance between all nodes in a web (D) and multiplied by the total number of links (L) to obtain link-density (LD), which is influenced by scale dependent variables such as species richness. These formulas are the basis for comparing and investigating the nature of non-random patterns in the structure of food web networks among many different types of ecosystems.

Scaling laws, complexity, chaos, and pattern correlates are common features attributed to food web structure.

Complexity and stability

Food webs are extremely complex. Complexity is a measure of an increasing number of permutations and it is also a metaphorical term that conveys the mental intractability or limits concerning unlimited algorithmic possibilities. In food web terminology, complexity is a product of the number of species and connectance. Connectance is "the fraction of all possible links that are realized in a network". These concepts were derived and stimulated through the suggestion that complexity leads to stability in food webs, such as increasing the number of trophic levels in more species rich ecosystems. This hypothesis was challenged through mathematical models suggesting otherwise, but subsequent studies have shown that the premise holds in real systems.

At different levels in the hierarchy of life, such as the stability of a food web, "the same overall structure is maintained in spite of an ongoing flow and change of components." The farther a living system (e.g., ecosystem) sways from equilibrium, the greater its complexity. Complexity has multiple meanings in the life sciences and in the public sphere that confuse its application as a precise term for analytical purposes in science. Complexity in the life sciences (or biocomplexity) is defined by the "properties emerging from the interplay of behavioral, biological, physical, and social interactions that affect, sustain, or are modified by living organisms, including humans".

Several concepts have emerged from the study of complexity in food webs. Complexity explains many principals pertaining to self-organization, non-linearity, interaction, cybernetic feedback, discontinuity, emergence, and stability in food webs. Nestedness, for example, is defined as "a pattern of interaction in which specialists interact with species that form perfect subsets of the species with which generalists interact", "—that is, the diet of the most specialized species is a subset of the diet of the next more generalized species, and its diet a subset of the next more generalized, and so on." Until recently, it was thought that food webs had little nested structure, but empirical evidence shows that many published webs have nested subwebs in their assembly.

Food webs are complex networks. As networks, they exhibit similar structural properties and mathematical laws that have been used to describe other complex systems, such as small world and scale free properties. The small world attribute refers to the many loosely connected nodes, non-random dense clustering of a few nodes (i.e., trophic or keystone species in ecology), and small path length compared to a regular lattice. "Ecological networks, especially mutualistic networks, are generally very heterogeneous, consisting of areas with sparse links among species and distinct areas of tightly linked species. These regions of high link density are often referred to as cliques, hubs, compartments, cohesive sub-groups, or modules...Within food webs, especially in aquatic systems, nestedness appears to be related to body size because the diets of smaller predators tend to be nested subsets of those of larger predators (Woodward & Warren 2007; YvonDurocher et al. 2008), and phylogenetic constraints, whereby related taxa are nested based on their common evolutionary history, are also evident (Cattin et al. 2004)." "Compartments in food webs are subgroups of taxa in which many strong interactions occur within the subgroups and few weak interactions occur between the subgroups. Theoretically, compartments increase the stability in networks, such as food webs."

Food webs are also complex in the way that they change in scale, seasonally, and geographically. The components of food webs, including organisms and mineral nutrients, cross the thresholds of ecosystem boundaries. This has led to the concept or area of study known as cross-boundary subsidy. "This leads to anomalies, such as food web calculations determining that an ecosystem can support one half of a top carnivore, without specifying which end." Nonetheless, real differences in structure and function have been identified when comparing different kinds of ecological food webs, such as terrestrial vs. aquatic food webs.

History of food webs

Victor Summerhayes and Charles Elton's 1923 food web of Bear Island (Arrows point to an organism being consumed by another organism).

Food webs serve as a framework to help ecologists organize the complex network of interactions among species observed in nature and around the world. One of the earliest descriptions of a food chain was described by a medieval Afro-Arab scholar named Al-Jahiz: "All animals, in short, cannot exist without food, neither can the hunting animal escape being hunted in his turn." The earliest graphical depiction of a food web was by Lorenzo Camerano in 1880, followed independently by those of Pierce and colleagues in 1912 and Victor Shelford in 1913. Two food webs about herring were produced by Victor Summerhayes and Charles Elton and Alister Hardy in 1923 and 1924. Charles Elton subsequently pioneered the concept of food cycles, food chains, and food size in his classical 1927 book "Animal Ecology"; Elton's 'food cycle' was replaced by 'food web' in a subsequent ecological text. After Charles Elton's use of food webs in his 1927 synthesis, they became a central concept in the field of ecology. Elton organized species into functional groups, which formed the basis for the trophic system of classification in Raymond Lindeman's classic and landmark paper in 1942 on trophic dynamics. The notion of a food web has a historical foothold in the writings of Charles Darwin and his terminology, including an "entangled bank", "web of life", "web of complex relations", and in reference to the decomposition actions of earthworms he talked about "the continued movement of the particles of earth". Even earlier, in 1768 John Bruckner described nature as "one continued web of life".

Interest in food webs increased after Robert Paine's experimental and descriptive study of intertidal shores suggesting that food web complexity was key to maintaining species diversity and ecological stability. Many theoretical ecologists, including Sir Robert May and Stuart Pimm, were prompted by this discovery and others to examine the mathematical properties of food webs.
Trophic cascade

From Wikipedia, the free encyclopedia

Trophic cascades are powerful indirect interactions that can control entire ecosystems, occurring when a trophic level in a food web is suppressed. For example, a top-down cascade will occur if predators are effective enough in predation to reduce the abundance, or alter the behavior, of their prey, thereby releasing the next lower trophic level from predation (or herbivory if the intermediate trophic level is a herbivore).

The trophic cascade is an ecological concept which has stimulated new research in many areas of ecology. For example, it can be important for understanding the knock-on effects of removing top predators from food webs, as humans have done in many places through hunting and fishing.

A top-down cascade is a trophic cascade where the top consumer/predator controls the primary consumer population. In turn, the primary producer population thrives. The removal of the top predator can alter the food web dynamics. In this case, the primary consumers would overpopulate and exploit the primary producers. Eventually there would not be enough primary producers to sustain the consumer population. Top-down food web stability depends on competition and predation in the higher trophic levels. Invasive species can also alter this cascade by removing or becoming a top predator. This interaction may not always be negative. Studies have shown that certain invasive species have begun to shift cascades; and as a consequence, ecosystem degradation has been repaired.

For example, if the abundance of large piscivorous fish is increased in a lake, the abundance of their prey, smaller fish that eat zooplankton, should decrease. The resulting increase in zooplankton should, in turn, cause the biomass of its prey, phytoplankton, to decrease.

In a bottom-up cascade, the population of primary producers will always control the increase/decrease of the energy in the higher trophic levels. Primary producers are plants, phytoplankton and zooplankton that require photosynthesis. Although light is important, primary producer populations are altered by the amount of nutrients in the system. This food web relies on the availability and limitation of resources. All populations will experience growth if there is initially a large amount of nutrients.

In a subsidy cascade, species populations at one trophic level can be supplemented by external food. For example, native animals can forage on resources that don't originate in their same habitat, such a native predators eating livestock. This may increase their local abundances thereby affecting other species in the ecosystem and causing an ecological cascade. For example, Luskin et al (2017) found that native animals living in protected primary rainforest in Malaysia found food subsidies in neighboring oil palm plantations. This subsidy allowed native animal populations to increase, which then triggered powerful secondary ‘cascading’ effects on forest tree community. Specifically, crop-raiding wild boar (Sus scrofa) built thousands of nests from the forest understory vegetation and this caused a 62% decline in forest tree sapling density over a 24-year study period. Such cross-boundary subsidy cascades may be widespread in both terrestrial and marine ecosystems and present significant conservation challenges.

These trophic interactions shape patterns of biodiversity globally. Humans and climate change have affected these cascades drastically. One example can be seen with sea otters (Enhydra lutris) on the Pacific coast of the United States of America. Over time, human interactions caused a removal of sea otters. One of their main prey, the pacific purple sea urchin (Strongylocentrotus purpuratus) eventually began to overpopulate. The overpopulation caused increased predation of giant kelp (Macrocystis pyrifera). As a result, there was extreme deterioration of the kelp forests along the California coast. This is why it is important for countries to regulate marine and terrestrial ecosystems.

Predator-induced interactions could heavily influence the flux of atmospheric carbon if managed on a global scale. For example, a study was conducted to determine the cost of potential stored carbon in living kelp biomass in sea otter (Enhydra lutris) enhanced ecosystems. The study valued the potential storage between $205 million and $408 million dollars (US) on the European Carbon Exchange (2012).

Origins and theory

Aldo Leopold is generally credited with first describing the mechanism of a trophic cascade, based on his observations of overgrazing of mountain slopes by deer after human extermination of wolves. Nelson Hairston, Frederick E. Smith and Lawrence B. Slobodkin are generally credited with introducing the concept into scientific discourse, although they did not use the term either. Hairston, Smith and Slobodkin argued that predators reduce the abundance of herbivores, allowing plants to flourish. This is often referred to as the green world hypothesis. The green world hypothesis is credited with bringing attention to the role of top-down forces (e.g. predation) and indirect effects in shaping ecological communities. The prevailing view of communities prior to Hairston, Smith and Slobodkin was trophodynamics, which attempted to explain the structure of communities using only bottom-up forces (e.g. resource limitation). Smith may have been inspired by the experiments of a Czech ecologist, Hrbáček, whom he met on a United States State Department cultural exchange. Hrbáček had shown that fish in artificial ponds reduced the abundance of zooplankton, leading to an increase in the abundance of phytoplankton.

Hairston, Smith and Slobodkin feuded that the ecological communities acted as food chains with three trophic levels. Subsequent models expanded the argument to food chains with more than or fewer than three trophic levels. Lauri Oksanen argued that the top trophic level in a food chain increases the abundance of producers in food chains with an odd number of trophic levels (such as in Hairston, Smith and Slobodkin's three trophic level model), but decreases the abundance of the producers in food chains with an even number of trophic levels. Additionally, he argued that the number of trophic levels in a food chain increases as the productivity of the ecosystem increases.

Criticisms

Although the existence of trophic cascades is not controversial, ecologists have long debated how ubiquitous they are. Hairston, Smith and Slobodkin argued that terrestrial ecosystems, as a rule, behave as a three trophic level trophic cascade, which provoked immediate controversy. Some of the criticisms, both of Hairston, Smith and Slobodkin's model and of Oksanen's later model, were:

  • Plants possess numerous defenses against herbivory, and these defenses also contribute to reducing the impact of herbivores on plant populations.
  • Herbivore populations may be limited by factors other than food or predation, such as nesting sites or available territory.
  • For trophic cascades to be ubiquitous, communities must generally act as food chains, with discrete trophic levels. Most communities, however, have complex food webs. In real food webs, consumers often feed at multiple trophic levels (omnivory), organisms often change their diet as they grow larger, cannibalism occurs, and consumers are subsidized by inputs of resources from outside the local community, all of which blur the distinctions between trophic levels.

Antagonistically, this principle is sometimes called the "trophic trickle".

Classic examples

Healthy Pacific kelp forests, like this one at San Clemente Island of California's Channel Islands, have been shown to flourish when sea otters are present. When otters are absent, sea urchin populations can irrupt and severely degrade the kelp forest ecosystem.

Although Hairston, Smith and Slobodkin formulated their argument in terms of terrestrial food chains, the earliest empirical demonstrations of trophic cascades came from marine and, especially, aquatic ecosystems. Some of the most famous examples are:

  • In North American lakes, piscivorous fish can dramatically reduce populations of zooplanktivorous fish; zooplanktivorous fish can dramatically alter freshwater zooplankton communities, and zooplankton grazing can in turn have large impacts on phytoplankton communities. Removal of piscivorous fish can change lake water from clear to green by allowing phytoplankton to flourish.
  • In the Eel River, in Northern California, fish (steelhead and roach) consume fish larvae and predatory insects. These smaller predators prey on midge larvae, which feed on algae. Removal of the larger fish increases the abundance of algae.
  • In Pacific kelp forests, sea otters feed on sea urchins. In areas where sea otters have been hunted to extinction, sea urchins increase in abundance and kelp populations are reduced.
  • A classic example of a terrestrial trophic cascade is the reintroduction of gray wolves (Canis lupus) to Yellowstone National Park, which reduced the number, and changed the behavior, of elk (Cervus canadensis). This in turn released several plant species from grazing pressure and subsequently led to the transformation of riparian ecosystems. This example of a trophic cascade is vividly shown and explained in the viral video "How Wolves Change Rivers".

Terrestrial trophic cascades

The fact that the earliest documented trophic cascades all occurred in lakes and streams led a scientist to speculate that fundamental differences between aquatic and terrestrial food webs made trophic cascades primarily an aquatic phenomenon. Trophic cascades were restricted to communities with relatively low species diversity, in which a small number of species could have overwhelming influence and the food web could operate as a linear food chain. Additionally, well documented trophic cascades at that point in time all occurred in food chains with algae as the primary producer. Trophic cascades, Strong argued, may only occur in communities with fast-growing producers which lack defenses against herbivory.

Subsequent research has documented trophic cascades in terrestrial ecosystems, including:

Critics pointed out that published terrestrial trophic cascades generally involved smaller subsets of the food web (often only a single plant species). This was quite different from aquatic trophic cascades, in which the biomass of producers as a whole were reduced when predators were removed. Additionally, most terrestrial trophic cascades did not demonstrate reduced plant biomass when predators were removed, but only increased plant damage from herbivores. It was unclear if such damage would actually result in reduced plant biomass or abundance. In 2002 a meta-analysis found trophic cascades to be generally weaker in terrestrial ecosystems, meaning that changes in predator biomass resulted in smaller changes in plant biomass. In contrast, a study published in 2009 demonstrated that multiple species of trees with highly varying autecologies are in fact heavily impacted by the loss of an apex predator. Another study, published in 2011, demonstrated that the loss of large terrestrial predators also significantly degrades the integrity of river and stream systems, impacting their morphology, hydrology, and associated biological communities.

The critics' model is challenged by studies accumulating since the reintroduction of gray wolves (Canis lupus) to Yellowstone National Park. The gray wolf, after being extirpated in the 1920s and absent for 70 years, was reintroduced to the park in 1995 and 1996. Since then a three-tiered trophic cascade has been reestablished involving wolves, elk (Cervus elaphus), and woody browse species such as aspen (Populus tremuloides), cottonwoods (Populus spp.), and willows (Salix spp.). Mechanisms likely include actual wolf predation of elk, which reduces their numbers, and the threat of predation, which alters elk behavior and feeding habits, resulting in these plant species being released from intensive browsing pressure. Subsequently, their survival and recruitment rates have significantly increased in some places within Yellowstone's northern range. This effect is particularly noted among the range's riparian plant communities, with upland communities only recently beginning to show similar signs of recovery.

Examples of this phenomenon include:

  • A 2-3 fold increase in deciduous woody vegetation cover, mostly of willow, in the Soda Butte Creek area between 1995 and 1999.
  • Heights of the tallest willows in the Gallatin River valley increasing from 75 cm to 200 cm between 1998 and 2002.
  • Heights of the tallest willows in the Blacktail Creek area increased from less than 50 cm to more than 250 cm between 1997 and 2003. Additionally, canopy cover over streams increased significantly, from only 5% to a range of 14-73%.
  • In the northern range, tall deciduous woody vegetation cover increased by 170% between 1991 and 2006.
  • In the Lamar and Soda Butte Valleys the number of young cottonwood trees that had been successfully recruited went from 0 to 156 between 2001 and 2010.

Trophic cascades also impact the biodiversity of ecosystems, and when examined from that perspective wolves appear to be having multiple, positive cascading impacts on the biodiversity of Yellowstone National Park. These impacts include:

This diagram illustrates trophic cascade caused by removal of the top predator. When the top predator is removed the population of deer is able to grow unchecked and this causes over-consumption of the primary producers.
  • Scavengers, such as ravens (Corvus corax), bald eagles (Haliaeetus leucocephalus), and even grizzly bears (Ursus arctos horribilis), are likely subsidized by the carcasses of wolf kills.
  • In the northern range, the relative abundance of six out of seven native songbirds which utilize willow was found to be greater in areas of willow recovery as opposed to those where willows remained suppressed.
  • Bison (Bison bison) numbers in the northern range have been steadily increasing as elk numbers have declined, presumably due to a decrease in interspecific competition between the two species.
  • Importantly, the number of beaver (Castor canadensis) colonies in the park has increased from one in 1996 to twelve in 2009. The recovery is likely due to the increase in willow availability, as they have been feeding almost exclusively on it. As keystone species, the resurgence of beaver is a critical event for the region. The presence of beavers has been shown to positively impact streambank erosion, sediment retention, water tables, nutrient cycling, and both the diversity and abundance of plant and animal life among riparian communities.

There are a number of other examples of trophic cascades involving large terrestrial mammals, including:

  • In both Zion National Park and Yosemite National Park, the increase in human visitation during the first half of the 20th century was found to correspond to the decline of native cougar (Puma concolor) populations in at least part of their range. Soon after, native populations of mule deer (Odocoileus hemionus) erupted, subjecting resident communities of cottonwoods (Populus fremontii) in Zion and California black oak (Quercus kelloggii) in Yosemite to intensified browsing. This halted successful recruitment of these species except in refugia inaccessible to the deer. In Zion the suppression of cottonwoods increased stream erosion and decreased the diversity and abundance of amphibians, reptiles, butterflies, and wildflowers. In parts of the park where cougars were still common these negative impacts were not expressed and riparian communities were significantly healthier.
  • In sub-Saharan Africa, the decline of lion (Panthera leo) and leopard (Panthera pardus) populations has led to a rising population of olive baboon (Papio anubis). This case of mesopredator release negatively impacted already declining ungulate populations and is one of the reasons for increased conflict between baboons and humans, as the primates raid crops and spread intestinal parasites.
  • In the Australian states of New South Wales and South Australia, the presence or absence of dingoes (Canis lupus dingo) was found to be inversely related to the abundance of invasive red foxes (Vulpes vulpes). In other words, the foxes were most common where the dingoes were least common. Subsequently, populations of an endangered prey species, the dusky hopping mouse (Notomys fuscus) were also less abundant where dingoes were absent due to the foxes, which consume the mice, no longer being held in check by the top predator.

Marine trophic cascades

In addition to the classic examples listed above, more recent examples of trophic cascades in marine ecosystems have been identified:

  • An example of a cascade in a complex, open-ocean ecosystem occurred in the northwest Atlantic during the 1980s and 1990s. The removal of Atlantic cod (Gadus morhua) and other ground fishes by sustained overfishing resulted in increases in the abundance of the prey species for these ground fishes, particularly smaller forage fishes and invertebrates such as the northern snow crab (Chionoecetes opilio) and northern shrimp (Pandalus borealis). The increased abundance of these prey species altered the community of zooplankton that serve as food for smaller fishes and invertebrates as an indirect effect.
  • A similar cascade, also involving the Atlantic cod, occurred in the Baltic Sea at the end of the 1980s. After a decline in Atlantic cod, the abundance of its main prey, the sprat (Sprattus sprattus), increased and the Baltic Sea ecosystem shifted from being dominated by cod into being dominated by sprat. The next level of trophic cascade was a decrease in the abundance of Pseudocalanus acuspes, a copepod which the sprat prey on.
  • On Caribbean coral reefs, several species of angelfishes and parrotfishes eat species of sponges that lack chemical defenses. Removal of these sponge-eating fish species from reefs by fish-trapping and netting has resulted in a shift in the sponge community toward fast-growing sponge species that lack chemical defenses. These fast-growing sponge species are superior competitors for space, and overgrow and smother reef-building corals to a greater extent on overfished reefs.

Holistic management (agriculture)

From Wikipedia, the free encyclopedia

Holistic Management (from ὅλος holos, a Greek word meaning all, whole, entire, total) in agriculture is an approach to managing resources that was originally developed by Allan Savory. Holistic Management is a registered trademark of Holistic Management International.

Definition

Holistic planned grazing is similar to rotational grazing but differs in that it more explicitly recognizes and provides a framework for adapting to the four basic ecosystem processes: the water cycle, the mineral cycle including the carbon cycle, energy flow, and community dynamics (the relationship between organisms in an ecosystem), giving equal importance to livestock production and social welfare. Holistic management has been likened to "a permaculture approach to rangeland management".

Framework

The Holistic Management decision-making framework uses six key steps to guide the management of resources:

  1. Define in its entirety what you are managing. No area should be treated as a single-product system. By defining the whole, people are better able to manage. This includes identifying the available resources, including money, that the manager has at his disposal.
  2. Define what you want now and for the future. Set the objectives, goals and actions needed to produce the quality of life sought, and what the life-nurturing environment must be like to sustain that quality of life far into the future.
  3. Watch for the earliest indicators of ecosystem health. Identify the ecosystem services that have deep impacts for people in both urban and rural environments, and find a way to easily monitor them. One of the best examples of an early indicator of a poorly functioning environment is patches of bare ground. An indicator of a better functioning environment is newly sprouting diversity of plants and a return or increase of wildlife.
  4. Don't limit the management tools you use. The eight tools for managing natural resources are money/labor, human creativity, grazing, animal impact, fire, rest, living organisms and science/technology. To be successful you need to use all these tools to the best of your ability.
  5. Test your decisions with questions that are designed to help ensure all your decisions are socially, environmentally and financially sound for both the short and long term.
  6. Monitor proactively, before your managed system becomes more imbalanced. This way the manager can take adaptive corrective action quickly, before the ecosystem services are lost. Always assume your plan is less than perfect and use a feedback loop that includes monitoring for the earliest signs of failure, adjusting and re-planning as needed. In other words use a "canary in a coal mine" approach.

Four principles

Savory stated four key principles of Holistic Management® planned grazing, which he intended to take advantage of the symbiotic relationship between large herds of grazing animals and the grasslands that support them:

  1. Nature functions as a holistic community with a mutualistic relationship between people, animals and the land. If you remove or change the behavior of any keystone species like the large grazing herds, you have an unexpected and wide-ranging negative impact on other areas of the environment.
  2. It is absolutely crucial that any agricultural planning system must be flexible enough to adapt to nature’s complexity, since all environments are different and have constantly changing local conditions.
  3. Animal husbandry using domestic species can be used as a substitute for lost keystone species. Thus when managed properly in a way that mimics nature, agriculture can heal the land and even benefit wildlife, while at the same time benefiting people.
  4. Time and timing is the most important factor when planning land use. Not only is it crucial to understand how long to use the land for agriculture and how long to rest, it is equally important to understand exactly when and where the land is ready for that use and rest.

Beginnings

The idea of holistic planned grazing was developed in the 1960s by Allan Savory, a wildlife biologist in his native Southern Rhodesia. Setting out to understand desertification in the context of the larger environmental movement, and influenced by the work of André Voisin, he hypothesized that the spread of deserts, the loss of wildlife, and the resulting human impoverishment were related to the reduction of the natural herds of large grazing animals and, even more, the changed behavior of the few remaining herds. Savory hypothesized further that livestock could be substituted for natural herds to provide important ecosystem services like nutrient cycling. However, while livestock managers had found that rotational grazing systems can work for livestock management purposes, scientific experiments demonstrated it does not necessarily improve ecological issues such as desertification. As Savory saw it, a more comprehensive framework for the management of grassland systems — an adaptive, holistic management plan — was needed. For that reason Holistic Management has been used as a Whole Farm/Ranch Planning tool. In 1984, he founded the Center for Holistic Resource Management which became Holistic Management International. 

Development

In many regions, pastoralism and communal land use are blamed for environmental degradation caused by overgrazing. After years of research and experience, Savory came to understand this assertion was often wrong, and that sometimes removing animals actually made matters worse. This concept is a variation of the trophic cascade, where humans are seen as the top level predator and the cascade follows from there.

Savory developed a management system that he claimed would improve grazing systems. Holistic planned grazing is one of a number of newer grazing management systems that aim to more closely simulate the behavior of natural herds of wildlife and have been shown to improve riparian habitats and water quality over systems that often led to land degradation, and be an effective tool to improve range condition for both livestock and wildlife.

Uses

While originally developed as a tool for range land use and restoring desertified land, the Holistic Management system can be applied to other areas with multiple complex socioeconomic and environmental factors. One such example is integrated water resources management, which promotes sector integration in development and management of water resources to ensure that water is allocated fairly between different users, maximizing economic and social welfare without compromising the sustainability of vital ecosystems. Another example is mine reclamation. A fourth use of Holistic Management® is in certain forms of no till crop production, intercropping, and permaculture. Holistic management has been acknowledged by the United States Department of Agriculture. The most comprehensive use of Holistic Management is as a Whole Farm/Ranch Planning tool which has been used successfully by farmers and ranchers. For that reason, the USDA invested six years of Beginning Farmer/Rancher Development funding to use it to train beginning women farmers and ranchers. 

Criticism

There are several claims that evidence for Holistic Management is not based in science. A paper by Richard Teague et al. claims that the different criticisms had examined rotational systems in general and not holistic planned grazing.

In 2013 the Savory Institute published a response to some of their critics. The same month Savory was a guest speaker with TED and gave a presentation titled "How to Fight Desertification and Reverse Climate Change". RealClimate.org published a piece saying that Savory's claims that his technique can bring atmospheric carbon "back to pre-industrial levels" are "simply not reasonable."

In his Ted Talk, Savory has claimed that holistic grazing could reduce carbon dioxide levels to pre-industrial levels in a span of 40 years, solving the problems caused by climate change. According to Skeptical science, "it is not possible to increase productivity, increase numbers of cattle and store carbon using any grazing strategy, never-mind Holistic Management [...] Long term studies on the effect of grazing on soil carbon storage have been done before, and the results are not promising.[...] Because of the complex nature of carbon storage in soils, increasing global temperature, risk of desertification and methane emissions from livestock, it is unlikely that Holistic Management, or any management technique, can reverse climate change."

According to a 2016 study published by the University of Uppsala, the actual rate at which improved grazing management could contribute to carbon sequestration is seven times lower than the claims made by Savory. The study concludes that holistic management cannot reverse climate change. A study by the Food and Climate Research Network in 2017 has concluded that Savory's claims about carbon sequestration are "unrealistic" and very different from those issued by peer-reviewed studies.

Awards

Savory received the 2003 Banksia International Award and in 2010 the Africa Centre for Holistic Management in Zimbabwe, Operation Hope (a "proof of concept" project using holistic management) was named the winner of the 2010 Buckminster Fuller Challenge for "recognizing initiatives which take a comprehensive, anticipatory, design approach to radically advance human well being and the health of our planet's ecosystems". In addition, numerous Holistic Management practitioners have received awards for their environmental stewardship through using Holistic Management practices.

Regenerative agriculture

From Wikipedia, the free encyclopedia
 
Biodiversity

Regenerative agriculture is a conservation and rehabilitation approach to food and farming systems. It focuses on topsoil regeneration, increasing biodiversity, improving the water cycle, enhancing ecosystem services, supporting biosequestration, increasing resilience to climate change, and strengthening the health and vitality of farm soil. Practices include recycling as much farm waste as possible and adding composted material from sources outside the farm.

Regenerative agriculture on small farms and gardens is often based on philosophies like permaculture, agroecology, agroforestry, restoration ecology, keyline design, and holistic management. Large farms tend to be less philosophy driven and often use "no-till" and/or "reduced till" practices.

On a regenerative farm, yield should increase over time. As the topsoil deepens, production may increase and fewer external compost inputs are required. Actual output is dependent on the nutritional value of the composting materials and the structure and content of the soil.

Hoverfly at work

Roots

Rodale Institute, Test Garden

Regenerative agriculture is based on various agricultural and ecological practices, with a particular emphasis on minimal soil disturbance and the practice of composting. Maynard Murray had similar ideas, using sea minerals. Her work led to innovations in no-till practices, such as slash and mulch in tropical regions. Sheet mulching is a regenerative agriculture practice that smothers weeds and adds nutrients to the soil below.

Field Hamois Belgium Luc Viatour

In the early 1980s, the Rodale Institute began using the term ‘regenerative agriculture’. Rodale Publishing formed the Regenerative Agriculture Association, which began publishing regenerative agriculture books in 1987 and 1988.

By marching forward under the banner of sustainability we are, in effect, continuing to hamper ourselves by not accepting a challenging enough goal. I am not against the word sustainable, rather I favor regenerative agriculture.

However, the institute stopped using the term in the late 1980s, and it only appeared sporadically (in 2005 and 2008), until they released a white paper in 2014, titled "Regenerative Organic Agriculture and Climate Change". The paper's summary states, “we could sequester more than 100% of current annual CO2 emissions with a switch to common and inexpensive organic management practices, which we term 'regenerative organic agriculture.'” The paper described agricultural practices, like crop rotation, compost application, and reduced tillage, that are similar to organic agriculture methods.

Newly-planted soybean plants are emerging from the residue left behind from a prior wheat harvest. This demonstrates crop rotation and no-till planting.

Storm Cunningham documented the beginning of what he called "restorative agriculture" in his first book, The Restoration Economy. Cunningham defined restorative agriculture as, a technique that rebuilds the quantity and quality of topsoil, while also restoring local biodiversity (especially native pollinators) and watershed function. Restorative agriculture was one of the eight sectors of restorative development industries/disciplines in The Restoration Economy.

2010s onward

Charles Massy published a book framing regenerative agriculture as a savior for the earth.

Allan Savory gave a TED talk on fighting desertification and reversing climate change in 2013. He also launched The Savory Institute, which educates ranchers on methods of holistic land management.

Abe Collins created LandStream to monitor ecosystem performance in regenerative agriculture farms.

Eric Toensmeier had a book published on the subject in 2016.

Principles

Principles include:

  • Increase soil fertility.
  • Work with whole systems (holistically), not isolated parts, to make changes to specific parts.
  • Improve whole agro-ecosystems (soil, water, and biodiversity).
  • Connect the farm to its larger agro-ecosystem and region.
  • Make holistic decisions that express the value of farm contributors.
  • Each person and farm is significant.
  • Make sure all stakeholders have equitable and reciprocal relationships.
  • Payment can be financial, spiritual, social, or environmental capital ("multi-capital"). Relationships can be "non-linear" (not reciprocal): if you do not get paid, in the future you can be given other "capital" by unrelated parties.
  • Continually grow and evolve individuals, farms, and communities.
  • Continuously evolve the agro-ecology.
  • Agriculture influences the world.

Practices

Practices include but are not limited to:

Criticism

Some claims made by proponents of regenerative agriculture have been criticized as exaggerated and unsupported by evidence by some members of the scientific community.

One of the famous proponents of regenerative agriculture, Allan Savory has claimed in his TED talk that holistic grazing could reduce carbon dioxide levels to pre-industrial levels in a span of 40 years. According to Skeptical Science, "it is not possible to increase productivity, increase numbers of cattle and store carbon using any grazing strategy, never-mind Holistic Management [...] Long term studies on the effect of grazing on soil carbon storage have been done before, and the results are not promising.[...] Because of the complex nature of carbon storage in soils, increasing global temperature, risk of desertification and methane emissions from livestock, it is unlikely that Holistic Management, or any management technique, can reverse climate change."

According to a 2016 study published by the University of Uppsala, the actual rate at which improved grazing management could contribute to carbon sequestration is seven times lower than the claims made by Savory. The study concludes that holistic management cannot reverse climate change. A study by the Food and Climate Research Network in 2017 has concluded that Savory's claims about carbon sequestration are "unrealistic" and very different from those issued by peer-reviewed studies.

Entropy (information theory)

From Wikipedia, the free encyclopedia https://en.wikipedia.org/wiki/Entropy_(information_theory) In info...