Search This Blog

Wednesday, March 31, 2021

Meteorology

From Wikipedia, the free encyclopedia

Meteorology is a branch of the atmospheric sciences which includes atmospheric chemistry and atmospheric physics, with a major focus on weather forecasting. The study of meteorology dates back millennia, though significant progress in meteorology did not occur until the 18th century. The 19th century saw modest progress in the field after weather observation networks were formed across broad regions. Prior attempts at prediction of weather depended on historical data. It was not until after the elucidation of the laws of physics and more particularly, the development of the computer, allowing for the automated solution of a great many equations that model the weather, in the latter half of the 20th century that significant breakthroughs in weather forecasting were achieved. An important domain of weather forecasting is marine weather forecasting as it relates to maritime and coastal safety, in which weather effects also include atmospheric interactions with large bodies of water.

Meteorological phenomena are observable weather events that are explained by the science of meteorology. Meteorological phenomena are described and quantified by the variables of Earth's atmosphere: temperature, air pressure, water vapour, mass flow, and the variations and interactions of those variables, and how they change over time. Different spatial scales are used to describe and predict weather on local, regional, and global levels.

Meteorology, climatology, atmospheric physics, and atmospheric chemistry are sub-disciplines of the atmospheric sciences. Meteorology and hydrology compose the interdisciplinary field of hydrometeorology. The interactions between Earth's atmosphere and its oceans are part of a coupled ocean-atmosphere system. Meteorology has application in many diverse fields such as the military, energy production, transport, agriculture, and construction.

The word meteorology is from the Ancient Greek μετέωρος metéōros (meteor) and -λογία -logia (-(o)logy), meaning "the study of things high in the air."

History

The ability to predict rains and floods based on annual cycles was evidently used by humans at least from the time of agricultural settlement if not earlier. Early approaches to predicting weather were based on astrology and were practiced by priests. Cuneiform inscriptions on Babylonian tablets included associations between thunder and rain. The Chaldeans differentiated the 22° and 46° halos.

Ancient Indian Upanishads contain mentions of clouds and seasons. The Samaveda mentions sacrifices to be performed when certain phenomena were noticed. Varāhamihira's classical work Brihatsamhita, written about 500 AD, provides evidence of weather observation.

In 350 BC, Aristotle wrote Meteorology. Aristotle is considered the founder of meteorology. One of the most impressive achievements described in the Meteorology is the description of what is now known as the hydrologic cycle.

The book De Mundo (composed before 250 BC or between 350 and 200 BC) noted:

If the flashing body is set on fire and rushes violently to the Earth it is called a thunderbolt; if it is only half of fire, but violent also and massive, it is called a meteor; if it is entirely free from fire, it is called a smoking bolt. They are all called 'swooping bolts' because they swoop down upon the Earth. Lightning is sometimes smoky, and is then called 'smoldering lightning"; sometimes it darts quickly along, and is then said to be vivid. At other times, it travels in crooked lines, and is called forked lightning. When it swoops down upon some object it is called 'swooping lightning'.

The Greek scientist Theophrastus compiled a book on weather forecasting, called the Book of Signs. The work of Theophrastus remained a dominant influence in the study of weather and in weather forecasting for nearly 2,000 years. In 25 AD, Pomponius Mela, a geographer for the Roman Empire, formalized the climatic zone system. According to Toufic Fahd, around the 9th century, Al-Dinawari wrote the Kitab al-Nabat (Book of Plants), in which he deals with the application of meteorology to agriculture during the Arab Agricultural Revolution. He describes the meteorological character of the sky, the planets and constellations, the sun and moon, the lunar phases indicating seasons and rain, the anwa (heavenly bodies of rain), and atmospheric phenomena such as winds, thunder, lightning, snow, floods, valleys, rivers, lakes.

Early attempts at predicting weather were often related to prophecy and divining, and were sometimes based on astrological ideas. Admiral FitzRoy tried to separate scientific approaches from prophetic ones.

Research of visual atmospheric phenomena

Twilight at Baker Beach

Ptolemy wrote on the atmospheric refraction of light in the context of astronomical observations. In 1021, Alhazen showed that atmospheric refraction is also responsible for twilight; he estimated that twilight begins when the sun is 19 degrees below the horizon, and also used a geometric determination based on this to estimate the maximum possible height of the Earth's atmosphere as 52,000 passim (about 49 miles, or 79 km).

St. Albert the Great was the first to propose that each drop of falling rain had the form of a small sphere, and that this form meant that the rainbow was produced by light interacting with each raindrop. Roger Bacon was the first to calculate the angular size of the rainbow. He stated that a rainbow summit can not appear higher than 42 degrees above the horizon. In the late 13th century and early 14th century, Kamāl al-Dīn al-Fārisī and Theodoric of Freiberg were the first to give the correct explanations for the primary rainbow phenomenon. Theoderic went further and also explained the secondary rainbow. In 1716, Edmund Halley suggested that aurorae are caused by "magnetic effluvia" moving along the Earth's magnetic field lines.

Instruments and classification scales

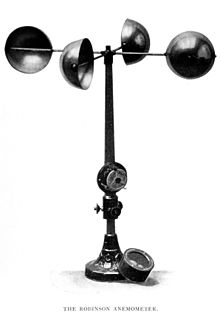
A hemispherical cup anemometer

In 1441, King Sejong's son, Prince Munjong of Korea, invented the first standardized rain gauge. These were sent throughout the Joseon dynasty of Korea as an official tool to assess land taxes based upon a farmer's potential harvest. In 1450, Leone Battista Alberti developed a swinging-plate anemometer, and was known as the first anemometer. In 1607, Galileo Galilei constructed a thermoscope. In 1611, Johannes Kepler wrote the first scientific treatise on snow crystals: "Strena Seu de Nive Sexangula (A New Year's Gift of Hexagonal Snow)." In 1643, Evangelista Torricelli invented the mercury barometer. In 1662, Sir Christopher Wren invented the mechanical, self-emptying, tipping bucket rain gauge. In 1714, Gabriel Fahrenheit created a reliable scale for measuring temperature with a mercury-type thermometer. In 1742, Anders Celsius, a Swedish astronomer, proposed the "centigrade" temperature scale, the predecessor of the current Celsius scale. In 1783, the first hair hygrometer was demonstrated by Horace-Bénédict de Saussure. In 1802–1803, Luke Howard wrote On the Modification of Clouds, in which he assigns cloud types Latin names. In 1806, Francis Beaufort introduced his system for classifying wind speeds. Near the end of the 19th century the first cloud atlases were published, including the International Cloud Atlas, which has remained in print ever since. The April 1960 launch of the first successful weather satellite, TIROS-1, marked the beginning of the age where weather information became available globally.

Atmospheric composition research

In 1648, Blaise Pascal rediscovered that atmospheric pressure decreases with height, and deduced that there is a vacuum above the atmosphere. In 1738, Daniel Bernoulli published Hydrodynamics, initiating the Kinetic theory of gases and established the basic laws for the theory of gases. In 1761, Joseph Black discovered that ice absorbs heat without changing its temperature when melting. In 1772, Black's student Daniel Rutherford discovered nitrogen, which he called phlogisticated air, and together they developed the phlogiston theory. In 1777, Antoine Lavoisier discovered oxygen and developed an explanation for combustion. In 1783, in Lavoisier's essay "Reflexions sur le phlogistique," he deprecates the phlogiston theory and proposes a caloric theory. In 1804, Sir John Leslie observed that a matte black surface radiates heat more effectively than a polished surface, suggesting the importance of black-body radiation. In 1808, John Dalton defended caloric theory in A New System of Chemistry and described how it combines with matter, especially gases; he proposed that the heat capacity of gases varies inversely with atomic weight. In 1824, Sadi Carnot analyzed the efficiency of steam engines using caloric theory; he developed the notion of a reversible process and, in postulating that no such thing exists in nature, laid the foundation for the second law of thermodynamics.

Research into cyclones and air flow

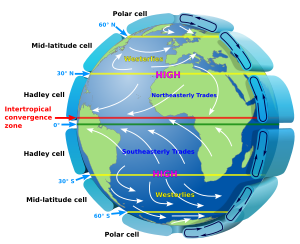
General circulation of the Earth's atmosphere: The westerlies and trade winds are part of the Earth's atmospheric circulation.

In 1494, Christopher Columbus experienced a tropical cyclone, which led to the first written European account of a hurricane. In 1686, Edmund Halley presented a systematic study of the trade winds and monsoons and identified solar heating as the cause of atmospheric motions. In 1735, an ideal explanation of global circulation through study of the trade winds was written by George Hadley. In 1743, when Benjamin Franklin was prevented from seeing a lunar eclipse by a hurricane, he decided that cyclones move in a contrary manner to the winds at their periphery. Understanding the kinematics of how exactly the rotation of the Earth affects airflow was partial at first. Gaspard-Gustave Coriolis published a paper in 1835 on the energy yield of machines with rotating parts, such as waterwheels. In 1856, William Ferrel proposed the existence of a circulation cell in the mid-latitudes, and the air within deflected by the Coriolis force resulting in the prevailing westerly winds. Late in the 19th century, the motion of air masses along isobars was understood to be the result of the large-scale interaction of the pressure gradient force and the deflecting force. By 1912, this deflecting force was named the Coriolis effect. Just after World War I, a group of meteorologists in Norway led by Vilhelm Bjerknes developed the Norwegian cyclone model that explains the generation, intensification and ultimate decay (the life cycle) of mid-latitude cyclones, and introduced the idea of fronts, that is, sharply defined boundaries between air masses. The group included Carl-Gustaf Rossby (who was the first to explain the large scale atmospheric flow in terms of fluid dynamics), Tor Bergeron (who first determined how rain forms) and Jacob Bjerknes.

Observation networks and weather forecasting

Cloud classification by altitude of occurrence
 
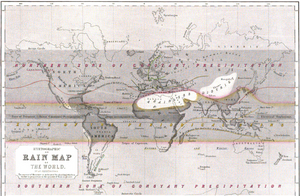
This "Hyetographic or Rain Map of the World " was first published 1848 by Alexander Keith Johnston.
 
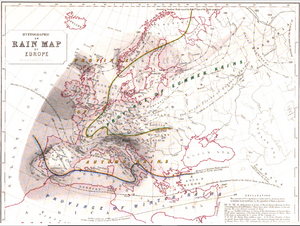
This "Hyetographic or Rain Map of Europe" was also published in 1848 as part of "The Physical Atlas".

In the late 16th century and first half of the 17th century a range of meteorological instruments were invented – the thermometer, barometer, hydrometer, as well as wind and rain gauges. In the 1650s natural philosophers started using these instruments to systematically record weather observations. Scientific academies established weather diaries and organised observational networks. In 1654, Ferdinando II de Medici established the first weather observing network, that consisted of meteorological stations in Florence, Cutigliano, Vallombrosa, Bologna, Parma, Milan, Innsbruck, Osnabrück, Paris and Warsaw. The collected data were sent to Florence at regular time intervals. In the 1660s Robert Hooke of the Royal Society of London sponsored networks of weather observers. Hippocrates' treatise Airs, Waters, and Places had linked weather to disease. Thus early meteorologists attempted to correlate weather patterns with epidemic outbreaks, and the climate with public health.

During the Age of Enlightenment meteorology tried to rationalise traditional weather lore, including astrological meteorology. But there were also attempts to establish a theoretical understanding of weather phenomena. Edmond Halley and George Hadley tried to explain trade winds. They reasoned that the rising mass of heated equator air is replaced by an inflow of cooler air from high latitudes. A flow of warm air at high altitude from equator to poles in turn established an early picture of circulation. Frustration with the lack of discipline among weather observers, and the poor quality of the instruments, led the early modern nation states to organise large observation networks. Thus by the end of the 18th century, meteorologists had access to large quantities of reliable weather data. In 1832, an electromagnetic telegraph was created by Baron Schilling. The arrival of the electrical telegraph in 1837 afforded, for the first time, a practical method for quickly gathering surface weather observations from a wide area.

This data could be used to produce maps of the state of the atmosphere for a region near the Earth's surface and to study how these states evolved through time. To make frequent weather forecasts based on these data required a reliable network of observations, but it was not until 1849 that the Smithsonian Institution began to establish an observation network across the United States under the leadership of Joseph Henry. Similar observation networks were established in Europe at this time. The Reverend William Clement Ley was key in understanding of cirrus clouds and early understandings of Jet Streams. Charles Kenneth Mackinnon Douglas, known as 'CKM' Douglas read Ley's papers after his death and carried on the early study of weather systems. Nineteenth century researchers in meteorology were drawn from military or medical backgrounds, rather than trained as dedicated scientists. In 1854, the United Kingdom government appointed Robert FitzRoy to the new office of Meteorological Statist to the Board of Trade with the task of gathering weather observations at sea. FitzRoy's office became the United Kingdom Meteorological Office in 1854, the second oldest national meteorological service in the world (the Central Institution for Meteorology and Geodynamics (ZAMG) in Austria was founded in 1851 and is the oldest weather service in the world). The first daily weather forecasts made by FitzRoy's Office were published in The Times newspaper in 1860. The following year a system was introduced of hoisting storm warning cones at principal ports when a gale was expected.

Over the next 50 years, many countries established national meteorological services. The India Meteorological Department (1875) was established to follow tropical cyclone and monsoon. The Finnish Meteorological Central Office (1881) was formed from part of Magnetic Observatory of Helsinki University. Japan's Tokyo Meteorological Observatory, the forerunner of the Japan Meteorological Agency, began constructing surface weather maps in 1883. The United States Weather Bureau (1890) was established under the United States Department of Agriculture. The Australian Bureau of Meteorology (1906) was established by a Meteorology Act to unify existing state meteorological services.

Numerical weather prediction

A meteorologist at the console of the IBM 7090 in the Joint Numerical Weather Prediction Unit. c. 1965

In 1904, Norwegian scientist Vilhelm Bjerknes first argued in his paper Weather Forecasting as a Problem in Mechanics and Physics that it should be possible to forecast weather from calculations based upon natural laws.

It was not until later in the 20th century that advances in the understanding of atmospheric physics led to the foundation of modern numerical weather prediction. In 1922, Lewis Fry Richardson published "Weather Prediction By Numerical Process," after finding notes and derivations he worked on as an ambulance driver in World War I. He described how small terms in the prognostic fluid dynamics equations that govern atmospheric flow could be neglected, and a numerical calculation scheme that could be devised to allow predictions. Richardson envisioned a large auditorium of thousands of people performing the calculations. However, the sheer number of calculations required was too large to complete without electronic computers, and the size of the grid and time steps used in the calculations led to unrealistic results. Though numerical analysis later found that this was due to numerical instability.

Starting in the 1950s, numerical forecasts with computers became feasible. The first weather forecasts derived this way used barotropic (single-vertical-level) models, and could successfully predict the large-scale movement of midlatitude Rossby waves, that is, the pattern of atmospheric lows and highs. In 1959, the UK Meteorological Office received its first computer, a Ferranti Mercury.

In the 1960s, the chaotic nature of the atmosphere was first observed and mathematically described by Edward Lorenz, founding the field of chaos theory. These advances have led to the current use of ensemble forecasting in most major forecasting centers, to take into account uncertainty arising from the chaotic nature of the atmosphere. Mathematical models used to predict the long term weather of the Earth (climate models), have been developed that have a resolution today that are as coarse as the older weather prediction models. These climate models are used to investigate long-term climate shifts, such as what effects might be caused by human emission of greenhouse gases.

Meteorologists

Meteorologists are scientists who study and work in the field of meteorology. The American Meteorological Society publishes and continually updates an authoritative electronic Meteorology Glossary. Meteorologists work in government agencies, private consulting and research services, industrial enterprises, utilities, radio and television stations, and in education. In the United States, meteorologists held about 10,000 jobs in 2018.

Although weather forecasts and warnings are the best known products of meteorologists for the public, weather presenters on radio and television are not necessarily professional meteorologists. They are most often reporters with little formal meteorological training, using unregulated titles such as weather specialist or weatherman. The American Meteorological Society and National Weather Association issue "Seals of Approval" to weather broadcasters who meet certain requirements but this is not mandatory to be hired by the medias.

Equipment

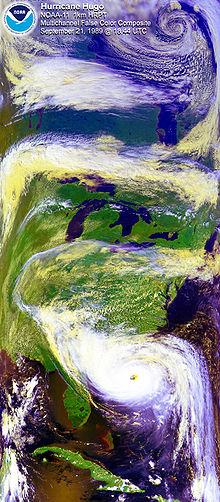
Satellite image of Hurricane Hugo with a polar low visible at the top of the image

Each science has its own unique sets of laboratory equipment. In the atmosphere, there are many things or qualities of the atmosphere that can be measured. Rain, which can be observed, or seen anywhere and anytime was one of the first atmospheric qualities measured historically. Also, two other accurately measured qualities are wind and humidity. Neither of these can be seen but can be felt. The devices to measure these three sprang up in the mid-15th century and were respectively the rain gauge, the anemometer, and the hygrometer. Many attempts had been made prior to the 15th century to construct adequate equipment to measure the many atmospheric variables. Many were faulty in some way or were simply not reliable. Even Aristotle noted this in some of his work as the difficulty to measure the air.

Sets of surface measurements are important data to meteorologists. They give a snapshot of a variety of weather conditions at one single location and are usually at a weather station, a ship or a weather buoy. The measurements taken at a weather station can include any number of atmospheric observables. Usually, temperature, pressure, wind measurements, and humidity are the variables that are measured by a thermometer, barometer, anemometer, and hygrometer, respectively. Professional stations may also include air quality sensors (carbon monoxide, carbon dioxide, methane, ozone, dust, and smoke), ceilometer (cloud ceiling), falling precipitation sensor, flood sensor, lightning sensor, microphone (explosions, sonic booms, thunder), pyranometer/pyrheliometer/spectroradiometer (IR/Vis/UV photodiodes), rain gauge/snow gauge, scintillation counter (background radiation, fallout, radon), seismometer (earthquakes and tremors), transmissometer (visibility), and a GPS clock for data logging. Upper air data are of crucial importance for weather forecasting. The most widely used technique is launches of radiosondes. Supplementing the radiosondes a network of aircraft collection is organized by the World Meteorological Organization.

Remote sensing, as used in meteorology, is the concept of collecting data from remote weather events and subsequently producing weather information. The common types of remote sensing are Radar, Lidar, and satellites (or photogrammetry). Each collects data about the atmosphere from a remote location and, usually, stores the data where the instrument is located. Radar and Lidar are not passive because both use EM radiation to illuminate a specific portion of the atmosphere. Weather satellites along with more general-purpose Earth-observing satellites circling the earth at various altitudes have become an indispensable tool for studying a wide range of phenomena from forest fires to El Niño.

Spatial scales

The study of the atmosphere can be divided into distinct areas that depend on both time and spatial scales. At one extreme of this scale is climatology. In the timescales of hours to days, meteorology separates into micro-, meso-, and synoptic scale meteorology. Respectively, the geospatial size of each of these three scales relates directly with the appropriate timescale.

Other subclassifications are used to describe the unique, local, or broad effects within those subclasses.

Typical Scales of Atmospheric Motion Systems
Type of motion Horizontal scale (meter)
Molecular mean free path 10−7
Minute turbulent eddies 10−2 – 10−1
Small eddies 10−1 – 1
Dust devils 1–10
Gusts 10 – 102
Tornadoes 102
Thunderclouds 103
Fronts, squall lines 104 – 105
Hurricanes 105
Synoptic Cyclones 106
Planetary waves 107
Atmospheric tides 107
Mean zonal wind 107

Microscale

Microscale meteorology is the study of atmospheric phenomena on a scale of about 1 kilometre (0.62 mi) or less. Individual thunderstorms, clouds, and local turbulence caused by buildings and other obstacles (such as individual hills) are modeled on this scale.

Mesoscale

Mesoscale meteorology is the study of atmospheric phenomena that has horizontal scales ranging from 1 km to 1000 km and a vertical scale that starts at the Earth's surface and includes the atmospheric boundary layer, troposphere, tropopause, and the lower section of the stratosphere. Mesoscale timescales last from less than a day to multiple weeks. The events typically of interest are thunderstorms, squall lines, fronts, precipitation bands in tropical and extratropical cyclones, and topographically generated weather systems such as mountain waves and sea and land breezes.

Synoptic scale

NOAA: Synoptic scale weather analysis.

Synoptic scale meteorology predicts atmospheric changes at scales up to 1000 km and 105 sec (28 days), in time and space. At the synoptic scale, the Coriolis acceleration acting on moving air masses (outside of the tropics) plays a dominant role in predictions. The phenomena typically described by synoptic meteorology include events such as extratropical cyclones, baroclinic troughs and ridges, frontal zones, and to some extent jet streams. All of these are typically given on weather maps for a specific time. The minimum horizontal scale of synoptic phenomena is limited to the spacing between surface observation stations.

Global scale

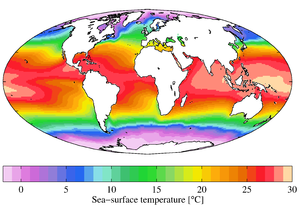
Annual mean sea surface temperatures.

Global scale meteorology is the study of weather patterns related to the transport of heat from the tropics to the poles. Very large scale oscillations are of importance at this scale. These oscillations have time periods typically on the order of months, such as the Madden–Julian oscillation, or years, such as the El Niño–Southern Oscillation and the Pacific decadal oscillation. Global scale meteorology pushes into the range of climatology. The traditional definition of climate is pushed into larger timescales and with the understanding of the longer time scale global oscillations, their effect on climate and weather disturbances can be included in the synoptic and mesoscale timescales predictions.

Numerical Weather Prediction is a main focus in understanding air–sea interaction, tropical meteorology, atmospheric predictability, and tropospheric/stratospheric processes. The Naval Research Laboratory in Monterey, California, developed a global atmospheric model called Navy Operational Global Atmospheric Prediction System (NOGAPS). NOGAPS is run operationally at Fleet Numerical Meteorology and Oceanography Center for the United States Military. Many other global atmospheric models are run by national meteorological agencies.

Some meteorological principles

Boundary layer meteorology

Boundary layer meteorology is the study of processes in the air layer directly above Earth's surface, known as the atmospheric boundary layer (ABL). The effects of the surface – heating, cooling, and friction – cause turbulent mixing within the air layer. Significant movement of heat, matter, or momentum on time scales of less than a day are caused by turbulent motions. Boundary layer meteorology includes the study of all types of surface–atmosphere boundary, including ocean, lake, urban land and non-urban land for the study of meteorology.

Dynamic meteorology

Dynamic meteorology generally focuses on the fluid dynamics of the atmosphere. The idea of air parcel is used to define the smallest element of the atmosphere, while ignoring the discrete molecular and chemical nature of the atmosphere. An air parcel is defined as a point in the fluid continuum of the atmosphere. The fundamental laws of fluid dynamics, thermodynamics, and motion are used to study the atmosphere. The physical quantities that characterize the state of the atmosphere are temperature, density, pressure, etc. These variables have unique values in the continuum.

Applications

Weather forecasting

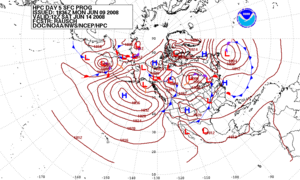
Forecast of surface pressures five days into the future for the north Pacific, North America, and north Atlantic Ocean

Weather forecasting is the application of science and technology to predict the state of the atmosphere at a future time and given location. Humans have attempted to predict the weather informally for millennia and formally since at least the 19th century.er forecasts are made by collecting quantitative data about the current state of the atmosphere and using scientific understanding of atmospheric processes to project how the atmosphere will evolve.

Once an all-human endeavor based mainly upon changes in barometric pressure, current weather conditions, and sky condition, forecast models are now used to determine future conditions. Human input is still required to pick the best possible forecast model to base the forecast upon, which involves pattern recognition skills, teleconnections, knowledge of model performance, and knowledge of model biases. The chaotic nature of the atmosphere, the massive computational power required to solve the equations that describe the atmosphere, error involved in measuring the initial conditions, and an incomplete understanding of atmospheric processes mean that forecasts become less accurate as the difference in current time and the time for which the forecast is being made (the range of the forecast) increases. The use of ensembles and model consensus help narrow the error and pick the most likely outcome.

There are a variety of end uses to weather forecasts. Weather warnings are important forecasts because they are used to protect life and property. Forecasts based on temperature and precipitation are important to agriculture, and therefore to commodity traders within stock markets. Temperature forecasts are used by utility companies to estimate demand over coming days. On an everyday basis, people use weather forecasts to determine what to wear. Since outdoor activities are severely curtailed by heavy rain, snow, and wind chill, forecasts can be used to plan activities around these events, and to plan ahead and survive them.

Aviation meteorology

Aviation meteorology deals with the impact of weather on air traffic management. It is important for air crews to understand the implications of weather on their flight plan as well as their aircraft, as noted by the Aeronautical Information Manual:

The effects of ice on aircraft are cumulative—thrust is reduced, drag increases, lift lessens, and weight increases. The results are an increase in stall speed and a deterioration of aircraft performance. In extreme cases, 2 to 3 inches of ice can form on the leading edge of the airfoil in less than 5 minutes. It takes but 1/2 inch of ice to reduce the lifting power of some aircraft by 50 percent and increases the frictional drag by an equal percentage.

Agricultural meteorology

Meteorologists, soil scientists, agricultural hydrologists, and agronomists are people concerned with studying the effects of weather and climate on plant distribution, crop yield, water-use efficiency, phenology of plant and animal development, and the energy balance of managed and natural ecosystems. Conversely, they are interested in the role of vegetation on climate and weather.

Hydrometeorology

Hydrometeorology is the branch of meteorology that deals with the hydrologic cycle, the water budget, and the rainfall statistics of storms. A hydrometeorologist prepares and issues forecasts of accumulating (quantitative) precipitation, heavy rain, heavy snow, and highlights areas with the potential for flash flooding. Typically the range of knowledge that is required overlaps with climatology, mesoscale and synoptic meteorology, and other geosciences.

The multidisciplinary nature of the branch can result in technical challenges, since tools and solutions from each of the individual disciplines involved may behave slightly differently, be optimized for different hard- and software platforms and use different data formats. There are some initiatives – such as the DRIHM project – that are trying to address this issue.

Nuclear meteorology

Nuclear meteorology investigates the distribution of radioactive aerosols and gases in the atmosphere.

Maritime meteorology

Maritime meteorology deals with air and wave forecasts for ships operating at sea. Organizations such as the Ocean Prediction Center, Honolulu National Weather Service forecast office, United Kingdom Met Office, and JMA prepare high seas forecasts for the world's oceans.

Military meteorology

Military meteorology is the research and application of meteorology for military purposes. In the United States, the United States Navy's Commander, Naval Meteorology and Oceanography Command oversees meteorological efforts for the Navy and Marine Corps while the United States Air Force's Air Force Weather Agency is responsible for the Air Force and Army.

Environmental meteorology

Environmental meteorology mainly analyzes industrial pollution dispersion physically and chemically based on meteorological parameters such as temperature, humidity, wind, and various weather conditions.
Renewable energy

Meteorology applications in renewable energy includes basic research, "exploration," and potential mapping of wind power and solar radiation for wind and solar energy.

Space weather

From Wikipedia, the free encyclopedia
 
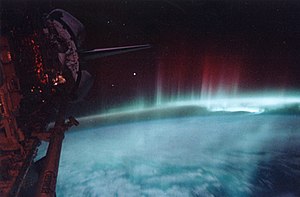
Aurora australis observed from Space Shuttle Discovery, May 1991

Space weather is a branch of space physics and aeronomy, or heliophysics, concerned with the time varying conditions within the Solar System, including the solar wind, emphasizing the space surrounding the Earth, including conditions in the magnetosphere, ionosphere, thermosphere, and exosphere. Space weather is distinct from but conceptually related to the terrestrial weather of the atmosphere of Earth (troposphere and stratosphere). The term space weather was first used in the 1950s and came into common usage in the 1990s.

History

For many centuries, the effects of space weather were noticed but not understood. Displays of auroral light have long been observed at high latitudes.

Genesis

In 1724, George Graham reported that the needle of a magnetic compass was regularly deflected from magnetic north over the course of each day. This effect was eventually attributed to overhead electric currents flowing in the ionosphere and magnetosphere by Balfour Stewart in 1882, and confirmed by Arthur Schuster in 1889 from analysis of magnetic observatory data.

In 1852, astronomer and British Major General Edward Sabine showed that the probability of the occurrence of magnetic storms on Earth was correlated with the number of sunspots, demonstrating a novel solar–terrestrial interaction. In 1859, a great magnetic storm caused brilliant auroral displays and disrupted global telegraph operations. Richard Christopher Carrington correctly connected the storm with a solar flare that he had observed the day before in the vicinity of a large sunspot group, demonstrating that specific solar events could affect the Earth.

Kristian Birkeland explained the physics of aurora by creating artificial aurora in his laboratory, and predicted the solar wind.

The introduction of radio revealed that periods of extreme static or noise occurred. Severe radar jamming during a large solar event in 1942 led to the discovery of solar radio bursts (radio waves which cover a broad frequency range created by a solar flare), another aspect of space weather.

Twentieth century

In the 20th century the interest in space weather expanded as military and commercial systems came to depend on systems affected by space weather. Communications satellites are a vital part of global commerce. Weather satellite systems provide information about terrestrial weather. The signals from satellites of the Global Positioning System (GPS) are used in a wide variety of applications. Space weather phenomena can interfere with or damage these satellites or interfere with the radio signals with which they operate. Space weather phenomena can cause damaging surges in long distance transmission lines and expose passengers and crew of aircraft travel to radiation, especially on polar routes.

The International Geophysical Year (IGY) increased research into space weather. Ground-based data obtained during IGY demonstrated that the aurora occurred in an auroral oval, a permanent region of luminescence 15 to 25 degrees in latitude from the magnetic poles and 5 to 20 degrees wide. In 1958, the Explorer I satellite discovered the Van Allen belts, regions of radiation particles trapped by the Earth's magnetic field. In January 1959, the Soviet satellite Luna 1 first directly observed the solar wind and measured its strength. A smaller International Heliophysical Year (IHY) occurred in 2007–2008.

In 1969, INJUN-5 (a.k.a. Explorer 40) made the first direct observation of the electric field impressed on the Earth's high latitude ionosphere by the solar wind. In the early 1970s, Triad data demonstrated that permanent electric currents flowed between the auroral oval and the magnetosphere.

The term space weather came into usage in the late 1950s as the space age began and satellites began to measure the space environment. The term regained popularity in the 1990s along with the belief that space's impact on human systems demanded a more coordinated research and application framework.

US National Space Weather Program

The purpose of the US National Space Weather Program is to focus research on the needs of the affected commercial and military communities, to connect the research and user communities, to create coordination between operational data centers and to better define user community needs.

The concept was turned into an action plan in 2000, an implementation plan in 2002, an assessment in 2006 and a revised strategic plan in 2010. A revised action plan was scheduled to be released in 2011 followed by a revised implementation plan in 2012.

One part of the National Space Weather Program is to show users that space weather affects their business. Private companies now acknowledge space weather "is a real risk for today's businesses".

Phenomena

Within the Solar System, space weather is influenced by the solar wind and the interplanetary magnetic field (IMF) carried by the solar wind plasma. A variety of physical phenomena are associated with space weather, including geomagnetic storms and substorms, energization of the Van Allen radiation belts, ionospheric disturbances and scintillation of satellite-to-ground radio signals and long-range radar signals, aurora, and geomagnetically induced currents at Earth's surface. Coronal mass ejections (CMEs), their associated shock waves and coronal clouds are also important drivers of space weather as they can compress the magnetosphere and trigger geomagnetic storms. Solar energetic particles (SEP) accelerated by coronal mass ejections or solar flares can trigger solar particle events (SPEs), a critical driver of human impact space weather as they can damage electronics onboard spacecraft (e.g. Galaxy 15 failure), and threaten the lives of astronauts as well as increase radiation hazards to high-altitude, high-latitude aviation.

Effects

Spacecraft electronics

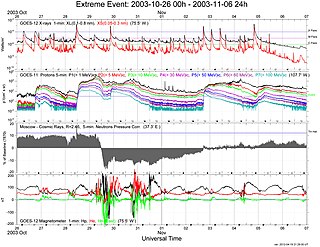
GOES-11 and GOES-12 monitored space weather conditions during the October 2003 solar activity.

Some spacecraft failures can be directly attributed to space weather; many more are thought to have a space weather component. For example, 46 of the 70 failures reported in 2003 occurred during the October 2003 geomagnetic storm. The two most common adverse space weather effects on spacecraft are radiation damage and spacecraft charging.

Radiation (high energy particles) passes through the skin of the spacecraft and into the electronic components. In most cases the radiation causes an erroneous signal or changes one bit in memory of a spacecraft's electronics (single event upsets). In a few cases, the radiation destroys a section of the electronics (single-event latchup).

Spacecraft charging is the accumulation of an electrostatic charge on a non-conducting material on the spacecraft's surface by low energy particles. If enough charge is built up, a discharge (spark) occurs. This can cause an erroneous signal to be detected and acted on by the spacecraft computer. A recent study indicates that spacecraft charging is the predominant space weather effect on spacecraft in geosynchronous orbit.

Spacecraft orbit changes

The orbits of spacecraft in low Earth orbit (LEO) decay to lower and lower altitudes due to the resistance from the friction between the spacecraft's surface (i.e. , drag) and the outer layer of the Earth's atmosphere (a.k.a. the thermosphere and exosphere). Eventually, a LEO spacecraft falls out of orbit and towards the Earth's surface. Many spacecraft launched in the past couple of decades have the ability to fire a small rocket to manage their orbits. The rocket can increase altitude to extend lifetime, to direct the reentry towards a particular (marine) site, or route the satellite to avoid collision with other spacecraft. Such maneuvers require precise information about the orbit. A geomagnetic storm can cause an orbit change over a couple of days that otherwise would occur over a year or more. The geomagnetic storm adds heat to the thermosphere, causing the thermosphere to expand and rise, increasing the drag on spacecraft. The 2009 satellite collision between the Iridium 33 and Cosmos 2251 demonstrated the importance of having precise knowledge of all objects in orbit. Iridium 33 had the capability to maneuver out of the path of Cosmos 2251 and could have evaded the crash, if a credible collision prediction had been available.

Humans in space

The exposure of a human body to ionizing radiation has the same harmful effects whether the source of the radiation is a medical X-ray machine, a nuclear power plant or radiation in space. The degree of the harmful effect depends on the length of exposure and the radiation's energy density. The ever-present radiation belts extend down to the altitude of crewed spacecraft such as the International Space Station (ISS) and the Space Shuttle, but the amount of exposure is within the acceptable lifetime exposure limit under normal conditions. During a major space weather event that includes an SEP burst, the flux can increase by orders of magnitude. Areas within ISS provide shielding that can keep the total dose within safe limits. For the Space Shuttle, such an event would have required immediate mission termination.

Ground systems

Spacecraft signals

The ionosphere bends radio waves in the same manner that water in a swimming pool bends visible light. When the medium through which such waves travel is disturbed, the light image or radio information is distorted and can become unrecognizable. The degree of distortion (scintillation) of a radio wave by the ionosphere depends on the signal frequency. Radio signals in the VHF band (30 to 300 MHz) can be distorted beyond recognition by a disturbed ionosphere. Radio signals in the UHF band (300 MHz to 3 GHz) transit a disturbed ionosphere, but a receiver may not be able to keep locked to the carrier frequency. GPS uses signals at 1575.42 MHz (L1) and 1227.6 MHz (L2) that can be distorted by a disturbed ionosphere. Space weather events that corrupt GPS signals can significantly impact society. For example, the Wide Area Augmentation System (WAAS) operated by the US Federal Aviation Administration (FAA) is used as a navigation tool for North American commercial aviation. It is disabled by every major space weather event. Outages can range from minutes to days. Major space weather events can push the disturbed polar ionosphere 10° to 30° of latitude toward the equator and can cause large ionospheric gradients (changes in density over distance of hundreds of km) at mid and low latitude. Both of these factors can distort GPS signals.

Long-distance radio signals

Radio wave in the HF band (3 to 30 MHz) (also known as the shortwave band) are reflected by the ionosphere. Since the ground also reflects HF waves, a signal can be transmitted around the curvature of the Earth beyond the line of sight. During the 20th century, HF communications was the only method for a ship or aircraft far from land or a base station to communicate. The advent of systems such as Iridium brought other methods of communications, but HF remains critical for vessels that do not carry the newer equipment and as a critical backup system for others. Space weather events can create irregularities in the ionosphere that scatter HF signals instead of reflecting them, preventing HF communications. At auroral and polar latitudes, small space weather events that occur frequently disrupt HF communications. At mid-latitudes, HF communications are disrupted by solar radio bursts, by X-rays from solar flares (which enhance and disturb the ionospheric D-layer) and by TEC enhancements and irregularities during major geomagnetic storms.

Transpolar airline routes are particularly sensitive to space weather, in part because Federal Aviation Regulations require reliable communication over the entire flight. Diverting such a flight is estimated to cost about $100,000.

All passengers in commercial aircraft flying above 26,000 feet (7,900 m) will typically experience some exposure in this aviation radiation environment.

Humans in commercial aviation

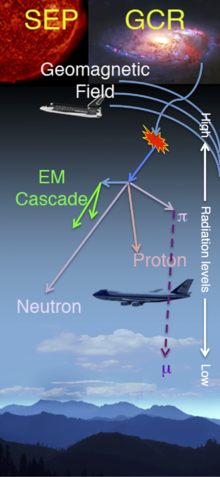
The magnetosphere guides cosmic ray and solar energetic particles to polar latitudes, while high energy charged particles enter the mesosphere, stratosphere, and troposphere. These energetic particles at the top of the atmosphere shatter atmospheric atoms and molecules, creating harmful lower energy particles that penetrate deep into the atmosphere and create measurable radiation. All aircraft flying above 8 km (26,200 feet) altitude are exposed to these particles. The dose exposure is greater in polar regions than at mid-latitude and equatorial regions. Many commercial aircraft fly over the polar region. When a space weather event causes radiation exposure to exceed the safe level set by aviation authorities, the aircraft's flight path is diverted.

While the most significant, but highly unlikely, health consequences to atmospheric radiation exposure include death from cancer due to long-term exposure, many lifestyle-degrading and career-impacting cancer forms can also occur. A cancer diagnosis can have significant career impact for a commercial pilot. A cancer diagnosis can ground a pilot temporarily or permanently. International guidelines from the International Commission on Radiological Protection (ICRP) have been developed to mitigate this statistical risk. The ICRP recommends effective dose limits of a 5-year average of 20 mSv per year with no more than 50 mSv in a single year for non-pregnant, occupationally exposed persons, and 1 mSv per year for the general public. Radiation dose limits are not engineering limits. In the U.S., they are treated as an upper limit of acceptability and not a regulatory limit.

Measurements of the radiation environment at commercial aircraft altitudes above 8 km (26,000 ft) have historically been done by instruments that record the data on board where the data are then processed later on the ground. However, a system of real-time radiation measurements on-board aircraft has been developed through the NASA Automated Radiation Measurements for Aerospace Safety (ARMAS) program. ARMAS has flown hundreds of flights since 2013, mostly on research aircraft, and sent the data to the ground through Iridium satellite links. The eventual goal of these types of measurements is to data assimilate them into physics-based global radiation models, e.g., NASA's Nowcast of Atmospheric Ionizing Radiation System (NAIRAS), so as to provide the weather of the radiation environment rather than the climatology.

Ground-induced electric fields

Magnetic storm activity can induce geoelectric fields in the Earth's conducting lithosphere. Corresponding voltage differentials can find their way into electric power grids through ground connections, driving uncontrolled electric currents that interfere with grid operation, damage transformers, trip protective relays and sometimes cause blackouts. This complicated chain of causes and effects was demonstrated during the magnetic storm of March 1989, which caused the complete collapse of the Hydro-Québec electric-power grid in Canada, temporarily leaving nine million people without electricity. The possible occurrence of an even more intense storm led to operational standards intended to mitigate induction-hazard risks, while reinsurance companies commissioned revised risk assessments.

Geophysical exploration

Air- and ship-borne magnetic surveys can be affected by rapid magnetic field variations during geomagnetic storms. Such storms cause data interpretation problems because the space-weather-related magnetic field changes are similar in magnitude to those of the sub-surface crustal magnetic field in the survey area. Accurate geomagnetic storm warnings, including an assessment of storm magnitude and duration allows for an economic use of survey equipment.

Geophysics and hydrocarbon production

For economic and other reasons, oil and gas production often involves horizontal drilling of well paths many kilometers from a single wellhead. Accuracy requirements are strict, due to target size – reservoirs may only be a few tens to hundreds of meters across – and safety, because of the proximity of other boreholes. The most accurate gyroscopic method is expensive, since it can stop drilling for hours. An alternative is to use a magnetic survey, which enables measurement while drilling (MWD). Near real-time magnetic data can be used to correct drilling direction. Magnetic data and space weather forecasts can help to clarify unknown sources of drilling error.

Terrestrial weather

The amount of energy entering the troposphere and stratosphere from space weather phenomena is trivial compared to the solar insolation in the visible and infra-red portions of the solar electromagnetic spectrum. Although some linkage between the 11-year sunspot cycle and the Earth's climate has been claimed, this has never been verified. For example, the Maunder minimum, a 70-year period almost devoid of sunspots, has often been suggested to be correlated to a cooler climate, but these correlations have disappeared after deeper studies. The suggested link from changes in cosmic ray flux cause changes in the amount of cloud formation. did not survive scientific tests. Another suggestion, that variations in the EUV flux subtly influence existing drivers of the climate and tip the balance between El Niño/La Niña events. collapsed when new research showed this was not possible. As such, a linkage between space weather and the climate has not been demonstrated.

Observation

Observation of space weather is done both for scientific research and for applications. Scientific observation has evolved with the state of knowledge, while application-related observation expanded with the ability to exploit such data.

Ground-based

Space weather is monitored at ground level by observing changes in the Earth's magnetic field over periods of seconds to days, by observing the surface of the Sun and by observing radio noise created in the Sun's atmosphere.

The Sunspot Number (SSN) is the number of sunspots on the Sun's photosphere in visible light on the side of the Sun visible to an Earth observer. The number and total area of sunspots are related to the brightness of the Sun in the extreme ultraviolet (EUV) and X-ray portions of the solar spectrum and to solar activity such as solar flares and coronal mass ejections (CMEs).

10.7 cm radio flux (F10.7) is a measurement of RF emissions from the Sun and is approximately correlated with the solar EUV flux. Since this RF emission is easily obtained from the ground and EUV flux is not, this value has been measured and disseminated continuously since 1947. The world standard measurements are made by the Dominion Radio Astrophysical Observatory at Penticton, B.C., Canada and reported once a day at local noon in solar flux units (10−22W·m−2·Hz−1). F10.7 is archived by the National Geophysical Data Center.

Fundamental space weather monitoring data are provided by ground-based magnetometers and magnetic observatories. Magnetic storms were first discovered by ground-based measurement of occasional magnetic disturbance. Ground magnetometer data provide real-time situational awareness for post-event analysis. Magnetic observatories have been in continuous operations for decades to centuries, providing data to inform studies of long-term changes in space climatology.

Dst index is an estimate of the magnetic field change at the Earth's magnetic equator due to a ring of electric current at and just earthward of the geosynchronous orbit. The index is based on data from four ground-based magnetic observatories between 21° and 33° magnetic latitude during a one-hour period. Stations closer to the magnetic equator are not used due to ionospheric effects. The Dst index is compiled and archived by the World Data Center for Geomagnetism, Kyoto.

Kp/ap Index: 'a' is an index created from the geomagnetic disturbance at one mid-latitude (40° to 50° latitude) geomagnetic observatory during a 3-hour period. 'K' is the quasi-logarithmic counterpart of the 'a' index. Kp and ap are the average of K and a over 13 geomagnetic observatories to represent planetary-wide geomagnetic disturbances. The Kp/ap index indicates both geomagnetic storms and substorms (auroral disturbance). Kp/ap is available from 1932 onward.

AE index is compiled from geomagnetic disturbances at 12 geomagnetic observatories in and near the auroral zones and is recorded at 1-minute intervals. The public AE index is available with a lag of two to three days that limits its utility for space weather applications. The AE index indicates the intensity of geomagnetic substorms except during a major geomagnetic storm when the auroral zones expand equatorward from the observatories.

Radio noise bursts are reported by the Radio Solar Telescope Network to the U.S. Air Force and to NOAA. The radio bursts are associated with solar flare plasma that interacts with the ambient solar atmosphere.

The Sun's photosphere is observed continuously for activity that can be the precursors to solar flares and CMEs. The Global Oscillation Network Group (GONG) project monitors both the surface and the interior of the Sun by using helioseismology, the study of sound waves propagating through the Sun and observed as ripples on the solar surface. GONG can detect sunspot groups on the far side of the Sun. This ability has recently been verified by visual observations from the STEREO spacecraft.

Neutron monitors on the ground indirectly monitor cosmic rays from the Sun and galactic sources. When cosmic rays interact with the atmosphere, atomic interactions occur that cause a shower of lower energy particles to descend into the atmosphere and to ground level. The presence of cosmic rays in the near-Earth space environment can be detected by monitoring high energy neutrons at ground level. Small fluxes of cosmic rays are present continuously. Large fluxes are produced by the Sun during events related to energetic solar flares.

Total Electron Content (TEC) is a measure of the ionosphere over a given location. TEC is the number of electrons in a column one meter square from the base of the ionosphere (approximately 90 km altitude) to the top of the ionosphere (approximately 1000 km altitude). Many TEC measurements are made by monitoring the two frequencies transmitted by GPS spacecraft. Presently GPS TEC is monitored and distributed in real time from more than 360 stations maintained by agencies in many countries.

Geoeffectiveness is a measure of how strongly space weather magnetic fields, such as coronal mass ejections, couple with the Earth's magnetic field. This is determined by the direction of the magnetic field held within the plasma that originates from the Sun. New techniques measuring Faraday Rotation in radio waves are in development to measure field direction.

Satellite-based

A host of research spacecraft have explored space weather. The Orbiting Geophysical Observatory series were among the first spacecraft with the mission of analyzing the space environment. Recent spacecraft include the NASA-ESA Solar-Terrestrial Relations Observatory (STEREO) pair of spacecraft launched in 2006 into solar orbit and the Van Allen Probes, launched in 2012 into a highly elliptical Earth-orbit. The two STEREO spacecraft drift away from the Earth by about 22° per year, one leading and the other trailing the Earth in its orbit. Together they compile information about the solar surface and atmosphere in three dimensions. The Van Allen probes record detailed information about the radiation belts, geomagnetic storms and the relationship between the two.

Some spacecraft with other primary missions have carried auxiliary instruments for solar observation. Among the earliest such spacecraft were the Applications Technology Satellite (ATS) series at GEO that were precursors to the modern Geostationary Operational Environmental Satellite (GOES) weather satellite and many communication satellites. The ATS spacecraft carried environmental particle sensors as auxiliary payloads and had their navigational magnetic field sensor used for sensing the environment.

Many of the early instruments were research spacecraft that were re-purposed for space weather applications. One of the first of these was the IMP-8 (Interplanetary Monitoring Platform). It orbited the Earth at 35 Earth radii and observed the solar wind for two-thirds of its 12-day orbits from 1973 to 2006. Since the solar wind carries disturbances that affect the magnetosphere and ionosphere, IMP-8 demonstrated the utility of continuous solar wind monitoring. IMP-8 was followed by ISEE-3, which was placed near the L1 Sun-Earth Lagrangian point, 235 Earth radii above the surface (about 1.5 million km, or 924,000 miles) and continuously monitored the solar wind from 1978 to 1982. The next spacecraft to monitor the solar wind at the L1 point was WIND from 1994 to 1998. After April 1998, the WIND spacecraft orbit was changed to circle the Earth and occasionally pass the L1 point. The NASA Advanced Composition Explorer (ACE) has monitored the solar wind at the L1 point from 1997 to present.

In addition to monitoring the solar wind, monitoring the Sun is important to space weather. Because the solar EUV cannot be monitored from the ground, the joint NASA-ESA Solar and Heliospheric Observatory (SOHO) spacecraft was launched and has provided solar EUV images beginning in 1995. SOHO is a main source of near-real time solar data for both research and space weather prediction and inspired the STEREO mission. The Yohkoh spacecraft at LEO observed the Sun from 1991 to 2001 in the X-ray portion of the solar spectrum and was useful for both research and space weather prediction. Data from Yohkoh inspired the Solar X-ray Imager on GOES.

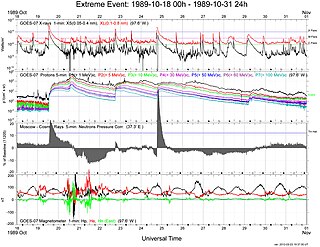
GOES-7 monitors space weather conditions during the October 1989 solar activity resulted in a Forbush Decrease, Ground Level Enhancements, and many satellite anomalies.

Spacecraft with instruments whose primary purpose is to provide data for space weather predictions and applications include the Geostationary Operational Environmental Satellite (GOES) series of spacecraft, the POES series, the DMSP series, and the Meteosat series. The GOES spacecraft have carried an X-ray sensor (XRS) which measures the flux from the whole solar disk in two bands – 0.05 to 0.4 nm and 0.1 to 0.8 nm – since 1974, an X-ray imager (SXI) since 2004, a magnetometer which measures the distortions of the Earth's magnetic field due to space weather, a whole disk EUV sensor since 2004, and particle sensors (EPS/HEPAD) which measure ions and electrons in the energy range of 50 keV to 500 MeV. Starting sometime after 2015, the GOES-R generation of GOES spacecraft will replace the SXI with a solar EUV image (SUVI) similar to the one on SOHO and STEREO and the particle sensor will be augmented with a component to extend the energy range down to 30 eV.

The Deep Space Climate Observatory (DSCOVR) satellite is a NOAA Earth observation and space weather satellite that launched in February 2015. Among its features is advance warning of coronal mass ejections.

Models

Space weather models are simulations of the space weather environment. Models use sets of mathematical equations to describe physical processes.

These models take a limited data set and attempt to describe all or part of the space weather environment in or to predict how weather evolves over time. Early models were heuristic; i.e., they did not directly employ physics. These models take less resources than their more sophisticated descendants.

Later models use physics to account for as many phenomena as possible. No model can yet reliably predict the environment from the surface of the Sun to the bottom of the Earth's ionosphere. Space weather models differ from meteorological models in that the amount of input is vastly smaller.

A significant portion of space weather model research and development in the past two decades has been done as part of the Geospace Environmental Model (GEM) program of the National Science Foundation. The two major modeling centers are the Center for Space Environment Modeling (CSEM) and the Center for Integrated Space weather Modeling (CISM). The Community Coordinated Modeling Center (CCMC) at the NASA Goddard Space Flight Center is a facility for coordinating the development and testing of research models, for improving and preparing models for use in space weather prediction and application.

Modeling techniques include (a) magnetohydrodynamics, in which the environment is treated as a fluid, (b) particle in cell, in which non-fluid interactions are handled within a cell and then cells are connected to describe the environment, (c) first principles, in which physical processes are in balance (or equilibrium) with one another, (d) semi-static modeling, in which a statistical or empirical relationship is described, or a combination of multiple methods.

Commercial space weather development

During the first decade of the 21st Century, a commercial sector emerged that engaged in space weather, serving agency, academia, commercial and consumer sectors. Space weather providers are typically smaller companies, or small divisions within a larger company, that provide space weather data, models, derivative products and service distribution.

The commercial sector includes scientific and engineering researchers as well as users. Activities are primarily directed toward the impacts of space weather upon technology. These include, for example:

  • Atmospheric drag on LEO satellites caused by energy inputs into the thermosphere from solar UV, FUV, Lyman-alpha, EUV, XUV, X-ray, and gamma ray photons as well as by charged particle precipitation and Joule heating at high latitudes;
  • Surface and internal charging from increased energetic particle fluxes, leading to effects such as discharges, single event upsets and latch-up, on LEO to GEO satellites;
  • Disrupted GPS signals caused by ionospheric scintillation leading to increased uncertainty in navigation systems such as aviation's Wide Area Augmentation System (WAAS);
  • Lost HF, UHF and L-band radio communications due to ionosphere scintillation, solar flares and geomagnetic storms;
  • Increased radiation to human tissue and avionics from galactic cosmic rays SEP, especially during large solar flares, and possibly bremsstrahlung gamma-rays produced by precipitating radiation belt energetic electrons at altitudes above 8 km;
  • Increased inaccuracy in surveying and oil/gas exploration that uses the Earth's main magnetic field when it is disturbed by geomagnetic storms;
  • Loss of power transmission from GIC surges in the electrical power grid and transformer shutdowns during large geomagnetic storms.

Many of these disturbances result in societal impacts that account for a significant part of the national GDP.

The concept of incentivizing commercial space weather was first suggested by the idea of a Space Weather Economic Innovation Zone discussed by the American Commercial Space Weather Association (ACSWA) in 2015. The establishment of this economic innovation zone would encourage expanded economic activity developing applications to manage the risks space weather and would encourage broader research activities related to space weather by universities. It could encourage U.S. business investment in space weather services and products. It promoted the support of U.S. business innovation in space weather services and products by requiring U.S. government purchases of U.S. built commercial hardware, software, and associated products and services where no suitable government capability pre-exists. It also promoted U.S. built commercial hardware, software, and associated products and services sales to international partners. designate U.S. built commercial hardware, services, and products as “Space Weather Economic Innovation Zone” activities; Finally, it recommended that U.S. built commercial hardware, services, and products be tracked as Space Weather Economic Innovation Zone contributions within agency reports. In 2015 the U.S. Congress bill HR1561 provided groundwork where social and environmental impacts from a Space Weather Economic Innovation Zone could be far-reaching. In 2016, the Space Weather Research and Forecasting Act (S. 2817) was introduced to build on that legacy. Later, in 2017-2018 the HR3086 Bill took these concepts, included the breadth of material from parallel agency studies as part of the OSTP-sponsored Space Weather Action Program (SWAP), and with bicameral and bipartisan support the 116th Congress (2019) is considering passage of the Space Weather Coordination Act (S141, 115th Congress).

American Commercial Space Weather Association

On April 29, 2010, the commercial space weather community created the American Commercial Space Weather Association (ACSWA) an industry association. ACSWA promotes space weather risk mitigation for national infrastructure, economic strength and national security. It seeks to:

  • provide quality space weather data and services to help mitigate risks to technology;
  • provide advisory services to government agencies;
  • provide guidance on the best task division between commercial providers and government agencies;
  • represent the interests of commercial providers;
  • represent commercial capabilities in the national and international arena;
  • develop best-practices.

A summary of the broad technical capabilities in space weather that are available from the association can be found on their web site http://www.acswa.us.

Notable events

  • On December 21, 1806, Alexander von Humboldt observed that his compass had become erratic during a bright auroral event.
  • The Solar storm of 1859 (Carrington Event) caused widespread disruption of telegraph service.
  • The Aurora of November 17, 1882 disrupted telegraph service.
  • The May 1921 geomagnetic storm, one of the largest geomagnetic storms disrupted telegraph service and damaged electrical equipment worldwide.
  • The Solar storm of August 1972, a large SEP event occurred. If astronauts had been in space at the time, the dose could have been life-threatening.
  • The March 1989 geomagnetic storm included multiple space weather effects: SEP, CME, Forbush decrease, ground level enhancement, geomagnetic storm, etc..
  • The 2000 Bastille Day event coincided with exceptionally bright aurora.
  • April 21, 2002, the Nozomi Mars Probe was hit by a large SEP event that caused large-scale failure. The mission, which was already about 3 years behind schedule, was abandoned in December 2003.

Van Allen radiation belt

From Wikipedia, the free encyclopedia
 
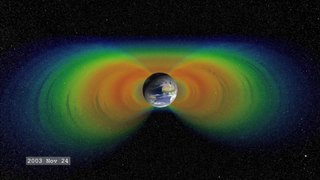
This CGI video illustrates changes in the shape and intensity of a cross section of the Van Allen belts.
 
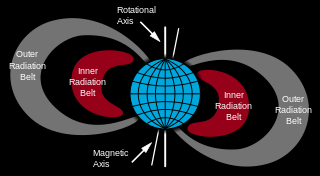
A cross section of Van Allen radiation belts

A Van Allen radiation belt is a zone of energetic charged particles, most of which originate from the solar wind, that are captured by and held around a planet by that planet's magnetic field. Earth has two such belts, and sometimes others may be temporarily created. The belts are named after James Van Allen, who is credited with their discovery. Earth's two main belts extend from an altitude of about 640 to 58,000 km (400 to 36,040 mi) above the surface, in which region radiation levels vary. Most of the particles that form the belts are thought to come from solar wind and other particles by cosmic rays. By trapping the solar wind, the magnetic field deflects those energetic particles and protects the atmosphere from destruction.

The belts are in the inner region of Earth's magnetosphere. The belts trap energetic electrons and protons. Other nuclei, such as alpha particles, are less prevalent. The belts endanger satellites, which must have their sensitive components protected with adequate shielding if they spend significant time near that zone. In 2013, NASA reported that the Van Allen Probes had discovered a transient, third radiation belt, which was observed for four weeks until it was destroyed by a powerful, interplanetary shock wave from the Sun.

Discovery

Kristian Birkeland, Carl Størmer, Nicholas Christofilos, and Enrico Medi had investigated the possibility of trapped charged particles before the Space Age. Explorer 1 and Explorer 3 confirmed the existence of the belt in early 1958 under James Van Allen at the University of Iowa. The trapped radiation was first mapped by Explorer 4, Pioneer 3, and Luna 1.

The term Van Allen belts refers specifically to the radiation belts surrounding Earth; however, similar radiation belts have been discovered around other planets. The Sun does not support long-term radiation belts, as it lacks a stable, global, dipole field. The Earth's atmosphere limits the belts' particles to regions above 200–1,000 km, (124–620 miles) while the belts do not extend past 8 Earth radii RE. The belts are confined to a volume which extends about 65° on either side of the celestial equator.

Research

Jupiter's variable radiation belts

The NASA Van Allen Probes mission aims at understanding (to the point of predictability) how populations of relativistic electrons and ions in space form or change in response to changes in solar activity and the solar wind. NASA Institute for Advanced Concepts–funded studies have proposed magnetic scoops to collect antimatter that naturally occurs in the Van Allen belts of Earth, although only about 10 micrograms of antiprotons are estimated to exist in the entire belt.

The Van Allen Probes mission successfully launched on August 30, 2012. The primary mission was scheduled to last two years with expendables expected to last four. The probes were deactivated in 2019 after running out of fuel and are expected to deorbit during the 2030s. NASA's Goddard Space Flight Center manages the Living With a Star program — of which the Van Allen Probes are a project, along with Solar Dynamics Observatory (SDO). The Applied Physics Laboratory is responsible for the implementation and instrument management for the Van Allen Probes.

Radiation belts exist around other planets and moons in the solar system that have magnetic fields powerful enough to sustain them. To date, most of these radiation belts have been poorly mapped. The Voyager Program (namely Voyager 2) only nominally confirmed the existence of similar belts around Uranus and Neptune.

Geomagnetic storms can cause electron density to increase or decrease relatively quickly (i.e., approximately one day or less). Longer-timescale processes determine the overall configuration of the belts. After electron injection increases electron density, electron density is often observed to decay exponentially. Those decay time constants are called "lifetimes." Measurements from the Van Allen Probe B's Magnetic Electron Ion Spectrometer (MagEIS) show long electron lifetimes (i.e., longer than 100 days) in the inner belt; short electron lifetimes of around one or two days are observed in the "slot" between the belts; and energy-dependent electron lifetimes of roughly five to 20 days are found in the outer belt.

Inner belt

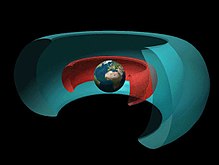
Cutaway drawing of two radiation belts around Earth: the inner belt (red) dominated by protons and the outer one (blue) by electrons. Image Credit: NASA

The inner Van Allen Belt extends typically from an altitude of 0.2 to 2 Earth radii (L values of 1 to 3) or 1,000 km (620 mi) to 12,000 km (7,500 mi) above the Earth. In certain cases, when solar activity is stronger or in geographical areas such as the South Atlantic Anomaly, the inner boundary may decline to roughly 200 km above the Earth's surface. The inner belt contains high concentrations of electrons in the range of hundreds of keV and energetic protons with energies exceeding 100 MeV — trapped by the relatively strong magnetic fields in the region (as compared to the outer belt).

It is believed that proton energies exceeding 50 MeV in the lower belts at lower altitudes are the result of the beta decay of neutrons created by cosmic ray collisions with nuclei of the upper atmosphere. The source of lower energy protons is believed to be proton diffusion, due to changes in the magnetic field during geomagnetic storms.

Due to the slight offset of the belts from Earth's geometric center, the inner Van Allen belt makes its closest approach to the surface at the South Atlantic Anomaly.

In March 2014, a pattern resembling "zebra stripes" was observed in the radiation belts by the Radiation Belt Storm Probes Ion Composition Experiment (RBSPICE) onboard Van Allen Probes. The initial theory proposed in 2014 was that — due to the tilt in Earth's magnetic field axis — the planet's rotation generated an oscillating, weak electric field that permeates through the entire inner radiation belt. A 2016 study instead concluded that the zebra stripes were an imprint of ionospheric winds on radiation belts.

Outer belt

Laboratory simulation of the Van Allen belt's influence on the Solar Wind; these aurora-like Birkeland currents were created by the scientist Kristian Birkeland in his terrella, a magnetized anode globe in an evacuated chamber

The outer belt consists mainly of high-energy (0.1–10 MeV) electrons trapped by the Earth's magnetosphere. It is more variable than the inner belt, as it is more easily influenced by solar activity. It is almost toroidal in shape, beginning at an altitude of 3 Earth radii and extending to 10 Earth radii (RE) — 13,000 to 60,000 kilometres (8,100 to 37,300 mi) above the Earth's surface. Its greatest intensity is usually around 4 to 5 RE. The outer electron radiation belt is mostly produced by the inward radial diffusion and local acceleration due to transfer of energy from whistler-mode plasma waves to radiation belt electrons. Radiation belt electrons are also constantly removed by collisions with Earth's atmosphere, losses to the magnetopause, and their outward radial diffusion. The gyroradii of energetic protons would be large enough to bring them into contact with the Earth's atmosphere. Within this belt, the electrons have a high flux and at the outer edge (close to the magnetopause), where geomagnetic field lines open into the geomagnetic "tail", the flux of energetic electrons can drop to the low interplanetary levels within about 100 km (62 mi) — a decrease by a factor of 1,000.

In 2014, it was discovered that the inner edge of the outer belt is characterized by a very sharp transition, below which highly relativistic electrons (> 5MeV) cannot penetrate. The reason for this shield-like behavior is not well understood.

The trapped particle population of the outer belt is varied, containing electrons and various ions. Most of the ions are in the form of energetic protons, but a certain percentage are alpha particles and O+ oxygen ions — similar to those in the ionosphere but much more energetic. This mixture of ions suggests that ring current particles probably originate from more than one source.

The outer belt is larger than the inner belt, and its particle population fluctuates widely. Energetic (radiation) particle fluxes can increase and decrease dramatically in response to geomagnetic storms, which are themselves triggered by magnetic field and plasma disturbances produced by the Sun. The increases are due to storm-related injections and acceleration of particles from the tail of the magnetosphere.

On February 28, 2013, a third radiation belt — consisting of high-energy ultrarelativistic charged particles — was reported to be discovered. In a news conference by NASA's Van Allen Probe team, it was stated that this third belt is a product of coronal mass ejection from the Sun. It has been represented as a separate creation which splits the Outer Belt, like a knife, on its outer side, and exists separately as a storage container of particles for a month's time, before merging once again with the Outer Belt.

The unusual stability of this third, transient belt has been explained as due to a 'trapping' by the Earth's magnetic field of ultrarelativistic particles as they are lost from the second, traditional outer belt. While the outer zone, which forms and disappears over a day, is highly variable due to interactions with the atmosphere, the ultrarelativistic particles of the third belt are thought not to scatter into the atmosphere, as they are too energetic to interact with atmospheric waves at low latitudes. This absence of scattering and the trapping allows them to persist for a long time, finally only being destroyed by an unusual event, such as the shock wave from the Sun.

Flux values

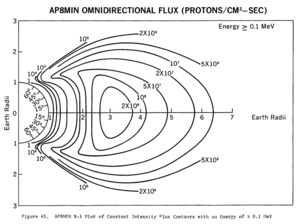
In the belts, at a given point, the flux of particles of a given energy decreases sharply with energy.

At the magnetic equator, electrons of energies exceeding 5000 keV (resp. 5 MeV) have omnidirectional fluxes ranging from 1.2×10⁶ (resp. 3.7×10⁴) up to 9.4×10⁹ (resp. 2×10⁷) particles per square centimeter per second.

The proton belts contain protons with kinetic energies ranging from about 100 keV, which can penetrate 0.6 µm of lead, to over 400 MeV, which can penetrate 143 mm of lead.

Most published flux values for the inner and outer belts may not show the maximum probable flux densities that are possible in the belts. There is a reason for this discrepancy: the flux density and the location of the peak flux is variable, depending primarily on solar activity, and the number of spacecraft with instruments observing the belt in real time has been limited. The Earth has not experienced a solar storm of Carrington event intensity and duration, while spacecraft with the proper instruments have been available to observe the event.

Radiation levels in the belts would be dangerous to humans if they were exposed for an extended period of time. The Apollo missions minimised hazards for astronauts by sending spacecraft at high speeds through the thinner areas of the upper belts, bypassing inner belts completely, except for the Apollo 14 mission where the spacecraft traveled through the heart of the trapped radiation belts.

Antimatter confinement

In 2011, a study confirmed earlier speculation that the Van Allen belt could confine antiparticles. The Payload for Antimatter Matter Exploration and Light-nuclei Astrophysics (PAMELA) experiment detected levels of antiprotons orders of magnitude higher than are expected from normal particle decays while passing through the South Atlantic Anomaly. This suggests the Van Allen belts confine a significant flux of antiprotons produced by the interaction of the Earth's upper atmosphere with cosmic rays. The energy of the antiprotons has been measured in the range from 60 to 750 MeV.

Research funded by the NASA Institute for Advanced Concepts concluded that harnessing these antiprotons for spacecraft propulsion would be feasible. Researchers believed that this approach would have advantages over antiproton generation at CERN, because collecting the particles in situ eliminates transportation losses and costs. Jupiter and Saturn are also possible sources, but the Earth belt is the most productive. Jupiter is less productive than might be expected due to magnetic shielding from cosmic rays of much of its atmosphere. In 2019, CMS announced that the construction of a device that would be capable of collecting these particles has already begun. NASA will use this device to collect these particles and transport them to institutes all around the world for further examination. These so-called "antimatter-containers" could be used for industrial purpose as well in the future.

Implications for space travel

Orbit size comparison of GPS, GLONASS, Galileo, BeiDou-2, and Iridium constellations, the International Space Station, the Hubble Space Telescope, and geostationary orbit (and its graveyard orbit), with the Van Allen radiation belts and the Earth to scale. The Moon's orbit is around 9 times as large as geostationary orbit. (In the SVG file, hover over an orbit or its label to highlight it; click to load its article.)

Spacecraft travelling beyond low Earth orbit enter the zone of radiation of the Van Allen belts. Beyond the belts, they face additional hazards from cosmic rays and solar particle events. A region between the inner and outer Van Allen belts lies at 2 to 4 Earth radii and is sometimes referred to as the "safe zone.”

Solar cells, integrated circuits, and sensors can be damaged by radiation. Geomagnetic storms occasionally damage electronic components on spacecraft. Miniaturization and digitization of electronics and logic circuits have made satellites more vulnerable to radiation, as the total electric charge in these circuits is now small enough so as to be comparable with the charge of incoming ions. Electronics on satellites must be hardened against radiation to operate reliably. The Hubble Space Telescope, among other satellites, often has its sensors turned off when passing through regions of intense radiation. A satellite shielded by 3 mm of aluminium in an elliptic orbit (200 by 20,000 miles (320 by 32,190 km)) passing the radiation belts will receive about 2,500 rem (25 Sv) per year. (For comparison, a full-body dose of 5 Sv is deadly.) Almost all radiation will be received while passing the inner belt.

The Apollo missions marked the first event where humans traveled through the Van Allen belts, which was one of several radiation hazards known by mission planners. The astronauts had low exposure in the Van Allen belts due to the short period of time spent flying through them. Apollo flight trajectories bypassed the inner belts completely, passing through the thinner areas of the outer belts.

Astronauts' overall exposure was actually dominated by solar particles once outside Earth's magnetic field. The total radiation received by the astronauts varied from mission-to-mission but was measured to be between 0.16 and 1.14 rads (1.6 and 11.4 mGy), much less than the standard of 5 rem (50 mSv) per year set by the United States Atomic Energy Commission for people who work with radioactivity.

Causes

It is generally understood that the inner and outer Van Allen belts result from different processes. The inner belt — consisting mainly of energetic protons — is the product of the decay of so-called "albedo" neutrons, which are themselves the result of cosmic ray collisions in the upper atmosphere. The outer belt consists mainly of electrons. They are injected from the geomagnetic tail following geomagnetic storms, and are subsequently energized through wave-particle interactions.

In the inner belt, particles that originate from the Sun are trapped in the Earth's magnetic field. Particles spiral along the magnetic lines of flux as they move "longitudinally" along those lines. As particles move toward the poles, the magnetic field line density increases, and their "longitudinal" velocity is slowed and can be reversed — reflecting the particles and causing them to bounce back and forth between the Earth's poles. In addition to the spiral about and motion along the flux lines, the electrons move slowly in an eastward direction, while the ions move westward.

A gap between the inner and outer Van Allen belts — sometimes called safe zone or safe slot — is caused by the Very Low Frequency (VLF) waves, which scatter particles in pitch angle, which results in the gain of particles to the atmosphere. Solar outbursts can pump particles into the gap, but they drain again in a matter of days. The radio waves were originally thought to be generated by turbulence in the radiation belts, but recent work by James L. Green of the Goddard Space Flight Center — comparing maps of lightning activity collected by the Microlab 1 spacecraft with data on radio waves in the radiation-belt gap from the IMAGE spacecraft — suggests that they are actually generated by lightning within Earth's atmosphere. The generated radio waves strike the ionosphere at the correct angle to pass through only at high latitudes, where the lower ends of the gap approach the upper atmosphere. These results are still under scientific debate.

Proposed removal

Draining the charged particles from the Van Allen belts would open up new orbits for satellites and make travel safer for astronauts.

High Voltage Orbiting Long Tether, or HiVOLT, is a concept proposed by Russian physicist V. V. Danilov and further refined by Robert P. Hoyt and Robert L. Forward for draining and removing the radiation fields of the Van Allen radiation belts that surround the Earth.

Another proposal for draining the Van Allen belts involves beaming very-low-frequency (VLF) radio waves from the ground into the Van Allen belts.

Draining radiation belts around other planets has also been proposed, for example, before exploring Europa, which orbits within Jupiter's radiation belt.

As of 2014, it remains uncertain if there are any negative unintended consequences to removing these radiation belts.

Representation of a Lie group

From Wikipedia, the free encyclopedia https://en.wikipedia.org/wiki/Representation_of_a_Lie_group...