Search This Blog

Wednesday, March 4, 2015

Atmosphere of Earth


From Wikipedia, the free encyclopedia


Blue light is scattered more than other wavelengths by the gases in the atmosphere, giving Earth a blue halo when seen from space onboard ISS at a height of 402–424 km.


Composition of Earth's atmosphere by volume. The lower pie represents the trace gases that together compose about 0.038% of the atmosphere (0.043% with CO2 at 2014 concentration). The numbers are from a variety of years (mainly 1987, with CO2 and methane from 2009) and do not represent any single source.

The atmosphere of Earth is a layer of gases surrounding the planet Earth that is retained by Earth's gravity. The atmosphere protects life on Earth by absorbing ultraviolet solar radiation, warming the surface through heat retention (greenhouse effect), and reducing temperature extremes between day and night (the diurnal temperature variation).

The common name given to the atmospheric gases used in breathing and photosynthesis is air. By volume, dry air contains 78.09% nitrogen, 20.95% oxygen,[1] 0.93% argon, 0.039% carbon dioxide, and small amounts of other gases. Air also contains a variable amount of water vapor, on average around 1% at sea level, and 0.4% over the entire atmosphere. Although air content and atmospheric pressure vary at different layers, air suitable for the survival of terrestrial plants and terrestrial animals currently is only known to be found in Earth's troposphere and artificial atmospheres.

The atmosphere has a mass of about 5.15×10¹⁸ kg,[2] three quarters of which is within about 11 km (6.8 mi; 36,000 ft) of the surface. The atmosphere becomes thinner and thinner with increasing altitude, with no definite boundary between the atmosphere and outer space. The Kármán line, at 100 km (62 mi), or 1.57% of Earth's radius, is often used as the border between the atmosphere and outer space. Atmospheric effects become noticeable during atmospheric reentry of spacecraft at an altitude of around 120 km (75 mi). Several layers can be distinguished in the atmosphere, based on characteristics such as temperature and composition.

The study of Earth's atmosphere and its processes is called atmospheric science (aerology). Early pioneers in the field include Léon Teisserenc de Bort and Richard Assmann.[3]

Composition

Mean atmospheric water vapor

Air is mainly composed of nitrogen, oxygen, and argon, which together constitute the major gases of the atmosphere. Water vapor accounts for roughly 0.25% of the atmosphere by mass. The concentration of water vapor (a greenhouse gas) varies significantly from around 10 ppmv in the coldest portions of the atmosphere to as much as 5% by volume in hot, humid air masses, and concentrations of other atmospheric gases are typically provided for dry air without any water vapor.[4] The remaining gases are often referred to as trace gases,[5] among which are the greenhouse gases such as carbon dioxide, methane, nitrous oxide, and ozone. Filtered air includes trace amounts of many other chemical compounds. Many substances of natural origin may be present in locally and seasonally variable small amounts as aerosols in an unfiltered air sample, including dust of mineral and organic composition, pollen and spores, sea spray, and volcanic ash. Various industrial pollutants also may be present as gases or aerosols, such as chlorine (elemental or in compounds), fluorine compounds and elemental mercury vapor. Sulfur compounds such as hydrogen sulfide and sulfur dioxide (SO2) may be derived from natural sources or from industrial air pollution.

Major constituents of dry air, by volume[6]
Gas Volume(A)
Name Formula in ppmv(B) in %
Nitrogen N2 780,840 78.084
Oxygen O2 209,460 20.946
Argon Ar 9,340 0.9340
Carbon dioxide CO2 397 0.0397
Neon Ne 18.18 0.001818
Helium He 5.24 0.000524
Methane CH4 1.79 0.000179
Not included in above dry atmosphere:
Water vapor(C) H2O 10–50,000(D) 0.001%–5%(D)
notes:
(A) volume fraction is equal to mole fraction for ideal gas only,
    also see volume (thermodynamics)
(B) ppmv: parts per million by volume
(C) Water vapor is about 0.25% by mass over full atmosphere
(D) Water vapor strongly varies locally[4]

Structure of the atmosphere

Principal layers

In general, air pressure and density decrease with altitude in the atmosphere. However, temperature has a more complicated profile with altitude, and may remain relatively constant or even increase with altitude in some regions (see the temperature section, below). Because the general pattern of the temperature/altitude profile is constant and recognizable through means such as balloon soundings, the temperature behavior provides a useful metric to distinguish between atmospheric layers. In this way, Earth's atmosphere can be divided (called atmospheric stratification) into five main layers. Excluding the exosphere, Earth has four primary layers, which are the troposphere, stratosphere, mesosphere, and thermosphere.[7] From highest to lowest, the five main layers are:
  • Exosphere: 700 to 10,000 km (440 to 6,200 miles)
  • Thermosphere: 80 to 700 km (50 to 440 miles)[8]
  • Mesosphere: 50 to 80 km (31 to 50 miles)
  • Stratosphere: 12 to 50 km (7 to 31 miles)
  • Troposphere: 0 to 12 km (0 to 7 miles)[9]
Earth's atmosphere Lower 4 layers of the atmosphere in 3 dimensions as seen diagonally from above the exobase. Layers drawn to scale, objects within the layers are not to scale. Aurorae shown here at the bottom of the thermosphere can actually form at any altitude in this atmospheric layer
Earth's atmosphere Lower 4 layers of the atmosphere in 3 dimensions as seen diagonally from above the exobase.  Layers drawn to scale, objects within the layers are not to scale. Aurorae shown here at the bottom of the thermosphere can actually form at any altitude in this atmospheric layer

Exosphere

The exosphere is the outermost layer of Earth's atmosphere (i.e. the upper limit of the atmosphere). It extends from the exobase, which is located at the top of the thermosphere at an altitude of about 700 km above sea level, to about 10,000 km (6,200 mi; 33,000,000 ft). The exosphere merges with the emptiness of outer space, where there is no atmosphere.

This layer is mainly composed of extremely low densities of hydrogen, helium and several heavier molecules including nitrogen, oxygen and carbon dioxide closer to the exobase. The atoms and molecules are so far apart that they can travel hundreds of kilometers without colliding with one another. Thus, the exosphere no longer behaves like a gas, and the particles constantly escape into space.
These free-moving particles follow ballistic trajectories and may migrate in and out of the magnetosphere or the solar wind.

The exosphere is located too far above Earth for any meteorological phenomena to be possible. However, the aurora borealis and aurora australis sometimes occur in the lower part of the exosphere, where they overlap into the thermosphere. The exosphere contains most of the satellites orbiting Earth.

Thermosphere

The thermosphere is the second-highest layer of Earth's atmosphere. It extends from the mesopause (which separates it from the mesosphere) at an altitude of about 80 km (50 mi; 260,000 ft) up to the thermopause at an altitude range of 500–1000 km (310–620 mi; 1,600,000–3,300,000 ft). The height of the thermopause varies considerably due to changes in solar activity.[8] Because the thermopause lies at the lower boundary of the exosphere, it is also referred to as the exobase. The lower part of the thermosphere, from 80 to 550 kilometres (50 to 342 mi) above Earth's surface, contains the ionosphere.
This atmospheric layer undergoes a gradual increase in temperature with height. Unlike the stratosphere, wherein a temperature inversion is due to the absorption of radiation by ozone, the inversion in the thermosphere occurs due to the extremely low density of its molecules. The temperature of this layer can rise as high as 1500 °C (2700 °F), though the gas molecules are so far apart that its temperature in the usual sense is not very meaningful. The air is so rarefied that an individual molecule (of oxygen, for example) travels an average of 1 kilometre (0.62 mi; 3300 ft) between collisions with other molecules.[10] Even though the thermosphere has a very high proportion of molecules with immense amounts of energy, the thermosphere would still feel extremely cold to a human in direct contact because the total energy of its relatively few number of molecules is incapable of transferring an adequate amount of energy to the skin of a human. In other words, a person would not feel warm because of the thermosphere's extremely low pressure.

This layer is completely cloudless and free of water vapor. However non-hydrometeorological phenomena such as the aurora borealis and aurora australis are occasionally seen in the thermosphere. The International Space Station orbits in this layer, between 320 and 380 km (200 and 240 mi).

Mesosphere

The mesosphere is the third highest layer of Earth's atmosphere, occupying the region above the stratosphere and below the thermosphere. It extends from the stratopause at an altitude of about 50 km (31 mi; 160,000 ft) to the mesopause at 80–85 km (50–53 mi; 260,000–280,000 ft) above sea level.
Temperatures drop with increasing altitude to the mesopause that marks the top of this middle layer of the atmosphere. It is the coldest place on Earth and has an average temperature around −85 °C (−120 °F; 190 K).[11][12]

Just below the mesopause, the air is so cold that even the very scarce water vapor at this altitude can be sublimated into polar-mesospheric noctilucent clouds. These are highest clouds in the atmosphere and may be visible to the naked eye if sunlight reflects off them about an hour or two after sunset or a similar length of time before sunrise. They are most readily visible when the Sun is around 4 to 16 degrees below the horizon. A type of lightning referred to as either sprites or ELVES, occasionally form far above tropospheric thunderclouds. The mesosphere is also the layer where most meteors burn up upon atmospheric entrance. It is too high above Earth to be accessible to jet-powered aircraft, and too low to support satellites and orbital or sub-orbital spacecraft. The mesosphere is mainly accessed by rocket-powered aircraft and unmanned sounding rockets.

Stratosphere

The stratosphere is the second-lowest layer of Earth's atmosphere. It lies above the troposphere and is separated from it by the tropopause. This layer extends from the top of the troposphere at roughly 12 km (7.5 mi; 39,000 ft) above Earth's surface to the stratopause at an altitude of about 50 to 55 km (31 to 34 mi; 164,000 to 180,000 ft).
The atmospheric pressure at the top of the stratosphere is roughly 1/1000 the pressure at sea level. It contains the ozone layer, which is the part of Earth's atmosphere that contains relatively high concentrations of that gas. The stratosphere defines a layer in which temperatures rise with increasing altitude. This rise in temperature is caused by the absorption of ultraviolet radiation (UV) radiation from the Sun by the ozone layer, which restricts turbulence and mixing. Although the temperature may be −60 °C (−76 °F; 210 K) at the tropopause, the top of the stratosphere is much warmer, and may be near 0 °C.[13]

The stratospheric temperature profile creates very stable atmospheric conditions, so the stratosphere lacks the weather-producing air turbulence that is so prevalent in the troposphere. Consequently, the stratosphere is almost completely free of clouds and other forms of weather. However, polar stratospheric or nacreous clouds are occasionally seen in the lower part of this layer of the atmosphere where the air is coldest. This is the highest layer that can be accessed by jet-powered aircraft.

Troposphere

The troposphere is the lowest layer of Earth's atmosphere. It extends from Earth's surface to an average height of about 12 km, although this altitude actually varies from about 9 km (30,000 ft) at the poles to 17 km (56,000 ft) at the equator,[9] with some variation due to weather. The troposphere is bounded above by the tropopause, a boundary marked by stable temperatures.
Although variations do occur, the temperature usually declines with increasing altitude in the troposphere because the troposphere is mostly heated through energy transfer from the surface. Thus, the lowest part of the troposphere (i.e. Earth's surface) is typically the warmest section of the troposphere. This promotes vertical mixing (hence the origin of its name in the Greek word τρόπος, tropos, meaning "turn"). The troposphere contains roughly 80% of the mass of Earth's atmosphere.[14] The troposphere is denser than all its overlying atmospheric layers because a larger atmospheric weight sits on top of the troposphere and causes it to be most severely compressed. Fifty percent of the total mass of the atmosphere is located in the lower 5.6 km (18,000 ft) of the troposphere. It is primarily composed of nitrogen (78%) and oxygen (21%) with only small concentrations of other trace gases.

Nearly all atmospheric water vapor or moisture is found in the troposphere, so it is the layer where most of Earth's weather takes place. It has basically all the weather-associated cloud genus types generated by active wind circulation, although very tall cumulonimbus thunder clouds can penetrate the tropopause from below and rise into the lower part of the stratosphere. Most conventional aviation activity takes place in the troposphere, and it is the only layer that can be accessed by propeller-driven aircraft.

Space Shuttle Endeavour orbiting in the thermosphere. Because of the angle of the photo, it appears to straddle the stratosphere and mesosphere that actually lie more than 250 km below. The orange layer is the troposphere, which gives way to the whitish stratosphere and then the blue mesosphere.[15]

Other layers

Within the five principal layers that are largely determined by temperature, several secondary layers may be distinguished by other properties:
  • The ozone layer is contained within the stratosphere. In this layer ozone concentrations are about 2 to 8 parts per million, which is much higher than in the lower atmosphere but still very small compared to the main components of the atmosphere. It is mainly located in the lower portion of the stratosphere from about 15–35 km (9.3–21.7 mi; 49,000–115,000 ft), though the thickness varies seasonally and geographically. About 90% of the ozone in Earth's atmosphere is contained in the stratosphere.
  • The ionosphere is a region of the atmosphere that is ionized by solar radiation. It is responsible for auroras. During daytime hours, it stretches from 50 to 1,000 km (31 to 621 mi; 160,000 to 3,280,000 ft) and includes the mesosphere, thermosphere, and parts of the exosphere. However, ionization in the mesosphere largely ceases during the night, so auroras are normally seen only in the thermosphere and lower exosphere. The ionosphere forms the inner edge of the magnetosphere. It has practical importance because it influences, for example, radio propagation on Earth.
  • The homosphere and heterosphere are defined by whether the atmospheric gases are well mixed. The surfaced-based homosphere includes the troposphere, stratosphere, mesosphere, and the lowest part of the thermosphere, where the chemical composition of the atmosphere does not depend on molecular weight because the gases are mixed by turbulence.[16] This relatively homogeneous layer ends at the turbopause found at about 100 km (62 mi; 330,000 ft), which places it about 20 km (12 mi; 66,000 ft) above the mesopause.
Above this altitude lies the heterosphere, which includes the exosphere and most of the thermosphere. Here, the chemical composition varies with altitude. This is because the distance that particles can move without colliding with one another is large compared with the size of motions that cause mixing. This allows the gases to stratify by molecular weight, with the heavier ones, such as oxygen and nitrogen, present only near the bottom of the heterosphere. The upper part of the heterosphere is composed almost completely of hydrogen, the lightest element.
  • The planetary boundary layer is the part of the troposphere that is closest to Earth's surface and is directly affected by it, mainly through turbulent diffusion. During the day the planetary boundary layer usually is well-mixed, whereas at night it becomes stably stratified with weak or intermittent mixing. The depth of the planetary boundary layer ranges from as little as about 100 meters on clear, calm nights to 3000 m or more during the afternoon in dry regions.
The average temperature of the atmosphere at Earth's surface is 14 °C (57 °F; 287 K)[17] or 15 °C (59 °F; 288 K),[18] depending on the reference.[19][20][21]

Physical properties


Comparison of the 1962 US Standard Atmosphere graph of geometric altitude against air density, pressure, the speed of sound and temperature with approximate altitudes of various objects.[22]

Pressure and thickness

The average atmospheric pressure at sea level is defined by the International Standard Atmosphere as 101325 pascals (760.00 Torr; 14.6959 psi; 760.00 mmHg). This is sometimes referred to as a unit of standard atmospheres (atm). Total atmospheric mass is 5.1480×10¹⁸ kg (1.135×10¹⁹ lb),[23] about 2.5% less than would be inferred from the average sea level pressure and Earth's area of 51007.2 megahectares, this portion being displaced by Earth's mountainous terrain. Atmospheric pressure is the total weight of the air above unit area at the point where the pressure is measured. Thus air pressure varies with location and weather.
If the entire mass of the atmosphere had a uniform density from sea level, it would terminate abruptly at an altitude of 8.50 km (27,900 ft). It actually decreases exponentially with altitude, dropping by half every 5.6 km (18,000 ft) or by a factor of 1/e every 7.64 km (25,100 ft), the average scale height of the atmosphere below 70 km (43 mi; 230,000 ft). However, the atmosphere is more accurately modeled with a customized equation for each layer that takes gradients of temperature, molecular composition, solar radiation and gravity into account.

In summary, the mass of Earth's atmosphere is distributed approximately as follows:[24]
  • 50% is below 5.6 km (18,000 ft).
  • 90% is below 16 km (52,000 ft).
  • 99.99997% is below 100 km (62 mi; 330,000 ft), the Kármán line. By international convention, this marks the beginning of space where human travelers are considered astronauts.
By comparison, the summit of Mt. Everest is at 8,848 m (29,029 ft); commercial airliners typically cruise between 10 km (33,000 ft) and 13 km (43,000 ft) where the thinner air improves fuel economy; weather balloons reach 30.4 km (100,000 ft) and above; and the highest X-15 flight in 1963 reached 108.0 km (354,300 ft).

Even above the Kármán line, significant atmospheric effects such as auroras still occur. Meteors begin to glow in this region though the larger ones may not burn up until they penetrate more deeply. The various layers of Earth's ionosphere, important to HF radio propagation, begin below 100 km and extend beyond 500 km. By comparison, the International Space Station and Space Shuttle typically orbit at 350–400 km, within the F-layer of the ionosphere where they encounter enough atmospheric drag to require reboosts every few months. Depending on solar activity, satellites can experience noticeable atmospheric drag at altitudes as high as 700–800 km.

Temperature and speed of sound

These images show temperature trends in two thick layers of the atmosphere as measured by a series of satellite-based instruments between January 1979 and December 2005. The measurements were taken by Microwave Sounding Units and Advanced Microwave Sounding Units flying on a series of National Oceanic and Atmospheric Administration (NOAA) weather satellites. The instruments record microwaves emitted from oxygen molecules in the atmosphere. Source:[25]

The division of the atmosphere into layers mostly by reference to temperature is discussed above. Temperature decreases with altitude starting at sea level, but variations in this trend begin above 11 km, where the temperature stabilizes through a large vertical distance through the rest of the troposphere. In the stratosphere, starting above about 20 km, the temperature increases with height, due to heating within the ozone layer caused by capture of significant ultraviolet radiation from the Sun by the dioxygen and ozone gas in this region. Still another region of increasing temperature with altitude occurs at very high altitudes, in the aptly-named thermosphere above 90 km.

Because in an ideal gas of constant composition the speed of sound depends only on temperature and not on the gas pressure or density, the speed of sound in the atmosphere with altitude takes on the form of the complicated temperature profile (see illustration to the right), and does not mirror altitudinal changes in density or pressure.

Density and mass


Temperature and mass density against altitude from the NRLMSISE-00 standard atmosphere model (the eight dotted lines in each "decade" are at the eight cubes 8, 27, 64, ..., 729)

The density of air at sea level is about 1.2 kg/m3 (1.2 g/L). Density is not measured directly but is calculated from measurements of temperature, pressure and humidity using the equation of state for air (a form of the ideal gas law). Atmospheric density decreases as the altitude increases. This variation can be approximately modeled using the barometric formula. More sophisticated models are used to predict orbital decay of satellites.

The average mass of the atmosphere is about 5 quadrillion (5×10¹⁵) tonnes or 1/1,200,000 the mass of Earth. According to the American National Center for Atmospheric Research, "The total mean mass of the atmosphere is 5.1480×10¹⁸ kg with an annual range due to water vapor of 1.2 or 1.5×10¹⁵ kg depending on whether surface pressure or water vapor data are used; somewhat smaller than the previous estimate. The mean mass of water vapor is estimated as 1.27×10¹⁶ kg and the dry air mass as 5.1352 ±0.0003×10¹⁸ kg."

Optical properties

Solar radiation (or sunlight) is the energy Earth receives from the Sun. Earth also emits radiation back into space, but at longer wavelengths that we cannot see. Part of the incoming and emitted radiation is absorbed or reflected by the atmosphere.

Scattering

When light passes through Earth's atmosphere, photons interact with it through scattering. If the light does not interact with the atmosphere, it is called direct radiation and is what you see if you were to look directly at the Sun. Indirect radiation is light that has been scattered in the atmosphere. For example, on an overcast day when you cannot see your shadow there is no direct radiation reaching you, it has all been scattered. As another example, due to a phenomenon called Rayleigh scattering, shorter (blue) wavelengths scatter more easily than longer (red) wavelengths. This is why the sky looks blue; you are seeing scattered blue light. This is also why sunsets are red. Because the Sun is close to the horizon, the Sun's rays pass through more atmosphere than normal to reach your eye. Much of the blue light has been scattered out, leaving the red light in a sunset.

Absorption

Different molecules absorb different wavelengths of radiation. For example, O2 and O3 absorb almost all wavelengths shorter than 300 nanometers. Water (H2O) absorbs many wavelengths above 700 nm. When a molecule absorbs a photon, it increases the energy of the molecule. This heats the atmosphere, but the atmosphere also cools by emitting radiation, as discussed below.

Rough plot of Earth's atmospheric transmittance (or opacity) to various wavelengths of electromagnetic radiation, including visible light.

The combined absorption spectra of the gases in the atmosphere leave "windows" of low opacity, allowing the transmission of only certain bands of light. The optical window runs from around 300 nm (ultraviolet-C) up into the range humans can see, the visible spectrum (commonly called light), at roughly 400–700 nm and continues to the infrared to around 1100 nm. There are also infrared and radio windows that transmit some infrared and radio waves at longer wavelengths. For example, the radio window runs from about one centimeter to about eleven-meter waves.

Emission

Emission is the opposite of absorption, it is when an object emits radiation. Objects tend to emit amounts and wavelengths of radiation depending on their "black body" emission curves, therefore hotter objects tend to emit more radiation, with shorter wavelengths. Colder objects emit less radiation, with longer wavelengths. For example, the Sun is approximately 6,000 K (5,730 °C; 10,340 °F), its radiation peaks near 500 nm, and is visible to the human eye. Earth is approximately 290 K (17 °C; 62 °F), so its radiation peaks near 10,000 nm, and is much too long to be visible to humans.
Because of its temperature, the atmosphere emits infrared radiation. For example, on clear nights Earth's surface cools down faster than on cloudy nights. This is because clouds (H2O) are strong absorbers and emitters of infrared radiation. This is also why it becomes colder at night at higher elevations.

The greenhouse effect is directly related to this absorption and emission effect. Some gases in the atmosphere absorb and emit infrared radiation, but do not interact with sunlight in the visible spectrum. Common examples of these are CO2 and H2O.

Refractive index

The refractive index of air is close to, but just greater than 1. Systematic variations in refractive index can lead to the bending of light rays over long optical paths. One example is that, under some circumstances, observers onboard ships can see other vessels just over the horizon because light is refracted in the same direction as the curvature of Earth's surface.

The refractive index of air depends on temperature, giving rise to refraction effects when the temperature gradient is large. An example of such effects is the mirage.

Circulation

An idealised view of three large circulation cells.

Atmospheric circulation is the large-scale movement of air through the troposphere, and the means (with ocean circulation) by which heat is distributed around Earth. The large-scale structure of the atmospheric circulation varies from year to year, but the basic structure remains fairly constant because it is determined by Earth's rotation rate and the difference in solar radiation between the equator and poles.

Evolution of Earth's atmosphere

Earliest atmosphere

The first atmosphere would have consisted of gases in the solar nebula, primarily hydrogen. In addition, there would probably have been simple hydrides such as those now found in the gas giants (Jupiter and Saturn), notably water vapor, methane and ammonia. As the solar nebula dissipated, these gases would have escaped, partly driven off by the solar wind.[26]

Second atmosphere

The next atmosphere, consisting largely of nitrogen plus carbon dioxide and inert gases, was produced by outgassing from volcanism, supplemented by gases produced during the late heavy bombardment of Earth by huge asteroids.[26] A major part of carbon dioxide emissions were soon dissolved in water and built up carbonate sediments.

Water-related sediments have been found dating from as early as 3.8 billion years ago.[27] About 3.4 billion years ago, nitrogen was the major part of the then stable "second atmosphere". An influence of life has to be taken into account rather soon in the history of the atmosphere, because hints of early life forms are to be found as early as 3.5 billion years ago.[28] How Earth at that time managed a climate warm enough for liquid water and life, if the early Sun put out 30% lower solar radiance than today, is a puzzle known as the "faint young Sun paradox".

The geological record however shows a continually relatively warm surface during the complete early temperature record of Earth with the exception of one cold glacial phase about 2.4 billion years ago. In the late Archean eon an oxygen-containing atmosphere began to develop, apparently produced by photosynthesizing cyanobacteria (see Great Oxygenation Event), which have been found as stromatolite fossils from 2.7 billion years ago. The early basic carbon isotopy (isotope ratio proportions) is very much in line with what is found today, suggesting that the fundamental features of the carbon cycle were established as early as 4 billion years ago.

Earth’s dynamic oxygenation evolution is recorded in ancient sediments from the Republic of Gabon from between about 2,150 and 2,080 million years ago. These fluctuations in oxygenation were likely driven by the Lomagundi carbon isotope excursion.[29]

Third atmosphere


Oxygen content of the atmosphere over the last billion years. This diagram in more detail

The constant re-arrangement of continents by plate tectonics influences the long-term evolution of the atmosphere by transferring carbon dioxide to and from large continental carbonate stores. Free oxygen did not exist in the atmosphere until about 2.4 billion years ago during the Great Oxygenation Event and its appearance is indicated by the end of the banded iron formations. Before this time, any oxygen produced by photosynthesis was consumed by oxidation of reduced materials, notably iron. Molecules of free oxygen did not start to accumulate in the atmosphere until the rate of production of oxygen began to exceed the availability of reducing materials. This point signifies a shift from a reducing atmosphere to an oxidizing atmosphere. O2 showed major variations until reaching a steady state of more than 15% by the end of the Precambrian.[30] The following time span from 541 million years ago to the present day is the Phanerozoic eon, during the earliest period of which, the Cambrian, oxygen-requiring metazoan life forms began to appear.

The amount of oxygen in the atmosphere has fluctuated over the last 600 million years, reaching a peak of about 30% around 280 million years ago, significantly higher than today's 21%. Two main processes govern changes in the atmosphere: Plants use carbon dioxide from the atmosphere, releasing oxygen. Breakdown of pyrite and volcanic eruptions release sulfur into the atmosphere, which oxidizes and hence reduces the amount of oxygen in the atmosphere. However, volcanic eruptions also release carbon dioxide, which plants can convert to oxygen.[citation needed] The exact cause of the variation of the amount of oxygen in the atmosphere is not known. Periods with much oxygen in the atmosphere are associated with rapid development of animals. Today's atmosphere contains 21% oxygen, which is high enough for this rapid development of animals.[31]
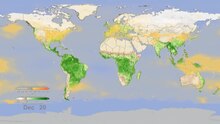
This animation shows the buildup of tropospheric CO2 in the Northern Hemisphere with a maximum around May. The maximum in the vegetation cycle follows, occurring in the late summer. Following the peak in vegetation, the drawdown of atmospheric CO2 due to photosynthesis is apparent, particularly over the boreal forests.

Currently, anthropogenic greenhouse gases are accumulating in the atmosphere, which is the main cause of global warming.[32]

Air pollution

Air pollution is the introduction into the atmosphere of chemicals, particulate matter, or biological materials that cause harm or discomfort to organisms.[33] Stratospheric ozone depletion is believed to be caused by air pollution (chiefly from chlorofluorocarbons).

Images from space

Blue light is scattered more than other wavelengths by the gases in the atmosphere, giving Earth a blue halo when seen from space. 
The geomagnetic storms cause beautiful displays of aurora across the atmosphere. 
Limb view, of Earth's atmosphere. Colors roughly denote the layers of the atmosphere. 
This image shows the moon at centre, with the limb of Earth near the bottom transitioning into the orange-colored troposphere. The troposphere ends abruptly at the tropopause, which appears in the image as the sharp boundary between the orange- and blue-colored atmosphere. The silvery-blue noctilucent clouds extend far above Earth's troposphere. 
Earth's atmosphere backlit by the Sun in an eclipse observed from deep space onboard Apollo 12 in 1969. 

Color


From Wikipedia, the free encyclopedia


Colored pencils

Color (American English) or colour (British English) (see spelling differences) is the visual perceptual property corresponding in humans to the categories called red, blue, yellow, and others. Color derives from the spectrum of light (distribution of light power versus wavelength) interacting in the eye with the spectral sensitivities of the light receptors. Color categories and physical specifications of color are also associated with objects or materials based on their physical properties such as light absorption, reflection, or emission spectra. By defining a color space, colors can be identified numerically by their coordinates.

Because perception of color stems from the varying spectral sensitivity of different types of cone cells in the retina to different parts of the spectrum, colors may be defined and quantified by the degree to which they stimulate these cells. These physical or physiological quantifications of color, however, do not fully explain the psychophysical perception of color appearance.

The science of color is sometimes called chromatics, colorimetry, or simply color science. It includes the perception of color by the human eye and brain, the origin of color in materials, color theory in art, and the physics of electromagnetic radiation in the visible range (that is, what we commonly refer to simply as light).

Physics of color


Continuous optical spectrum rendered into the sRGB color space.
The colors of the visible light spectrum[1]
color wavelength interval frequency interval
red ~ 700–635 nm ~ 430–480 THz
orange ~ 635–590 nm ~ 480–510 THz
yellow ~ 590–560 nm ~ 510–540 THz
green ~ 560–520 nm ~ 540–580 THz
cyan ~ 520–490 nm ~ 580–610 THz
blue ~ 490–450 nm ~ 610–670 THz
violet ~ 450–400 nm ~ 670–750 THz
Color, wavelength, frequency and energy of light
Color λ
(nm)
ν
(THz)
νb
(μm−1)
E
(eV)
E
(kJ mol−1)
Infrared >1000 <300 p=""> <1 .00="" p=""> <1 .24="" p=""> <120 p="">
Red 700 428 1.43 1.77 171
Orange 620 484 1.61 2.00 193
Yellow 580 517 1.72 2.14 206
Green 530 566 1.89 2.34 226
Blue 470 638 2.13 2.64 254
Violet 420 714 2.38 2.95 285
Near ultraviolet 300 1000 3.33 4.15 400
Far ultraviolet <200 p=""> >1500 >5.00 >6.20 >598

Electromagnetic radiation is characterized by its wavelength (or frequency) and its intensity. When the wavelength is within the visible spectrum (the range of wavelengths humans can perceive, approximately from 390 nm to 700 nm), it is known as "visible light".

Most light sources emit light at many different wavelengths; a source's spectrum is a distribution giving its intensity at each wavelength. Although the spectrum of light arriving at the eye from a given direction determines the color sensation in that direction, there are many more possible spectral combinations than color sensations. In fact, one may formally define a color as a class of spectra that give rise to the same color sensation, although such classes would vary widely among different species, and to a lesser extent among individuals within the same species. In each such class the members are called metamers of the color in question.

Spectral colors

The familiar colors of the rainbow in the spectrum – named using the Latin word for appearance or apparition by Isaac Newton in 1671 – include all those colors that can be produced by visible light of a single wavelength only, the pure spectral or monochromatic colors. The table at right shows approximate frequencies (in terahertz) and wavelengths (in nanometers) for various pure spectral colors. The wavelengths listed are as measured in air or vacuum (see refractive index).

The color table should not be interpreted as a definitive list – the pure spectral colors form a continuous spectrum, and how it is divided into distinct colors linguistically is a matter of culture and historical contingency (although people everywhere have been shown to perceive colors in the same way[2]). A common list identifies six main bands: red, orange, yellow, green, blue, and violet. Newton's conception included a seventh color, indigo, between blue and violet. It is possible that what Newton referred to as blue is nearer to what today we call cyan, and that indigo was simply the dark blue of the indigo dye that was being imported at the time.[3]

The intensity of a spectral color, relative to the context in which it is viewed, may alter its perception considerably; for example, a low-intensity orange-yellow is brown, and a low-intensity yellow-green is olive-green.

Color of objects

The color of an object depends on both the physics of the object in its environment and the characteristics of the perceiving eye and brain. Physically, objects can be said to have the color of the light leaving their surfaces, which normally depends on the spectrum of the incident illumination and the reflectance properties of the surface, as well as potentially on the angles of illumination and viewing. Some objects not only reflect light, but also transmit light or emit light themselves, which also contribute to the color. A viewer's perception of the object's color depends not only on the spectrum of the light leaving its surface, but also on a host of contextual cues, so that color differences between objects can be discerned mostly independent of the lighting spectrum, viewing angle, etc. This effect is known as color constancy.

The upper disk and the lower disk have exactly the same objective color, and are in identical gray surroundings; based on context differences, humans perceive the squares as having different reflectances, and may interpret the colors as different color categories; see checker shadow illusion.

Some generalizations of the physics can be drawn, neglecting perceptual effects for now:
  • Light arriving at an opaque surface is either reflected "specularly" (that is, in the manner of a mirror), scattered (that is, reflected with diffuse scattering), or absorbed – or some combination of these.
  • Opaque objects that do not reflect specularly (which tend to have rough surfaces) have their color determined by which wavelengths of light they scatter strongly (with the light that is not scattered being absorbed). If objects scatter all wavelengths with roughly equal strength, they appear white. If they absorb all wavelengths, they appear black.
  • Opaque objects that specularly reflect light of different wavelengths with different efficiencies look like mirrors tinted with colors determined by those differences. An object that reflects some fraction of impinging light and absorbs the rest may look black but also be faintly reflective; examples are black objects coated with layers of enamel or lacquer.
  • Objects that transmit light are either translucent (scattering the transmitted light) or transparent (not scattering the transmitted light). If they also absorb (or reflect) light of various wavelengths differentially, they appear tinted with a color determined by the nature of that absorption (or that reflectance).
  • Objects may emit light that they generate from having excited electrons, rather than merely reflecting or transmitting light. The electrons may be excited due to elevated temperature (incandescence), as a result of chemical reactions (chemoluminescence), after absorbing light of other frequencies ("fluorescence" or "phosphorescence") or from electrical contacts as in light emitting diodes, or other light sources.
To summarize, the color of an object is a complex result of its surface properties, its transmission properties, and its emission properties, all of which contribute to the mix of wavelengths in the light leaving the surface of the object. The perceived color is then further conditioned by the nature of the ambient illumination, and by the color properties of other objects nearby, and via other characteristics of the perceiving eye and brain.

Perception


This image (when viewed in full size, 1000 pixels wide) contains 1 million pixels, each of a different color. The human eye can distinguish about 10 million different colors.[4]

Development of theories of color vision

Although Aristotle and other ancient scientists had already written on the nature of light and color vision, it was not until Newton that light was identified as the source of the color sensation. In 1810, Goethe published his comprehensive Theory of Colors in which he ascribed physiological effects to color that are now understood as psychological.
In 1801 Thomas Young proposed his trichromatic theory, based on the observation that any color could be matched with a combination of three lights. This theory was later refined by James Clerk Maxwell and Hermann von Helmholtz. As Helmholtz puts it, "the principles of Newton's law of mixture were experimentally confirmed by Maxwell in 1856. Young's theory of color sensations, like so much else that this marvelous investigator achieved in advance of his time, remained unnoticed until Maxwell directed attention to it."[5]

At the same time as Helmholtz, Ewald Hering developed the opponent process theory of color, noting that color blindness and afterimages typically come in opponent pairs (red-green, blue-orange, yellow-violet, and black-white). Ultimately these two theories were synthesized in 1957 by Hurvich and Jameson, who showed that retinal processing corresponds to the trichromatic theory, while processing at the level of the lateral geniculate nucleus corresponds to the opponent theory.[6]

In 1931, an international group of experts known as the Commission internationale de l'éclairage (CIE) developed a mathematical color model, which mapped out the space of observable colors and assigned a set of three numbers to each.

Color in the eye

Main article: Color vision

Normalized typical human cone cell responses (S, M, and L types) to monochromatic spectral stimuli

The ability of the human eye to distinguish colors is based upon the varying sensitivity of different cells in the retina to light of different wavelengths. Humans being trichromatic, the retina contains three types of color receptor cells, or cones. One type, relatively distinct from the other two, is most responsive to light that we perceive as blue or blue-violet, with wavelengths around 450 nm; cones of this type are sometimes called short-wavelength cones, S cones, or blue cones. The other two types are closely related genetically and chemically: middle-wavelength cones, M cones, or green cones are most sensitive to light perceived as green, with wavelengths around 540 nm, while the long-wavelength cones, L cones, or red cones, are most sensitive to light we perceive as greenish yellow, with wavelengths around 570  nm.

Light, no matter how complex its composition of wavelengths, is reduced to three color components by the eye. For each location in the visual field, the three types of cones yield three signals based on the extent to which each is stimulated. These amounts of stimulation are sometimes called tristimulus values.

The response curve as a function of wavelength varies for each type of cone. Because the curves overlap, some tristimulus values do not occur for any incoming light combination. For example, it is not possible to stimulate only the mid-wavelength (so-called "green") cones; the other cones will inevitably be stimulated to some degree at the same time. The set of all possible tristimulus values determines the human color space. It has been estimated that humans can distinguish roughly 10 million different colors.[4]

The other type of light-sensitive cell in the eye, the rod, has a different response curve. In normal situations, when light is bright enough to strongly stimulate the cones, rods play virtually no role in vision at all.[7] On the other hand, in dim light, the cones are understimulated leaving only the signal from the rods, resulting in a colorless response. (Furthermore, the rods are barely sensitive to light in the "red" range.) In certain conditions of intermediate illumination, the rod response and a weak cone response can together result in color discriminations not accounted for by cone responses alone.
These effects, combined, are summarized also in the Kruithof curve, that describes the change of color perception and pleasingness of light as function of temperature and intensity.

Color in the brain

The visual dorsal stream (green) and ventral stream (purple) are shown. The ventral stream is responsible for color perception.

While the mechanisms of color vision at the level of the retina are well-described in terms of tristimulus values, color processing after that point is organized differently. A dominant theory of color vision proposes that color information is transmitted out of the eye by three opponent processes, or opponent channels, each constructed from the raw output of the cones: a red–green channel, a blue–yellow channel, and a black–white "luminance" channel. This theory has been supported by neurobiology, and accounts for the structure of our subjective color experience. Specifically, it explains why we cannot perceive a "reddish green" or "yellowish blue", and it predicts the color wheel: it is the collection of colors for which at least one of the two color channels measures a value at one of its extremes.

The exact nature of color perception beyond the processing already described, and indeed the status of color as a feature of the perceived world or rather as a feature of our perception of the world – a type of qualia – is a matter of complex and continuing philosophical dispute.

Nonstandard color perception

Color deficiency

If one or more types of a person's color-sensing cones are missing or less responsive than normal to incoming light, that person can distinguish fewer colors and is said to be color deficient or color blind (though this latter term can be misleading; almost all color deficient individuals can distinguish at least some colors). Some kinds of color deficiency are caused by anomalies in the number or nature of cones in the retina. Others (like central or cortical achromatopsia) are caused by neural anomalies in those parts of the brain where visual processing takes place.

Tetrachromacy

While most humans are trichromatic (having three types of color receptors), many animals, known as tetrachromats, have four types. These include some species of spiders, most marsupials, birds, reptiles, and many species of fish. Other species are sensitive to only two axes of color or do not perceive color at all; these are called dichromats and monochromats respectively. A distinction is made between retinal tetrachromacy (having four pigments in cone cells in the retina, compared to three in trichromats) and functional tetrachromacy (having the ability to make enhanced color discriminations based on that retinal difference). As many as half of all women are retinal tetrachromats.[8]:p.256 The phenomenon arises when an individual receives two slightly different copies of the gene for either the medium- or long-wavelength cones, which are carried on the x-chromosome. To have two different genes, a person must have two x-chromosomes, which is why the phenomenon only occurs in women.[8] For some of these retinal tetrachromats, color discriminations are enhanced, making them functional tetrachromats.[8]

Synesthesia

In certain forms of synesthesia\ideasthesia, perceiving letters and numbers (grapheme–color synesthesia) or hearing musical sounds (music–color synesthesia) will lead to the unusual additional experiences of seeing colors. Behavioral and functional neuroimaging experiments have demonstrated that these color experiences lead to changes in behavioral tasks and lead to increased activation of brain regions involved in color perception, thus demonstrating their reality, and similarity to real color percepts, albeit evoked through a non-standard route.

Afterimages

After exposure to strong light in their sensitivity range, photoreceptors of a given type become desensitized. For a few seconds after the light ceases, they will continue to signal less strongly than they otherwise would. Colors observed during that period will appear to lack the color component detected by the desensitized photoreceptors. This effect is responsible for the phenomenon of afterimages, in which the eye may continue to see a bright figure after looking away from it, but in a complementary color.

Afterimage effects have also been utilized by artists, including Vincent van Gogh.

Color constancy

When an artist uses a limited color palette, the eye tends to compensate by seeing any gray or neutral color as the color which is missing from the color wheel. For example, in a limited palette consisting of red, yellow, black, and white, a mixture of yellow and black will appear as a variety of green, a mixture of red and black will appear as a variety of purple, and pure gray will appear bluish.[9]
The trichromatic theory is strictly true when the visual system is in a fixed state of adaptation. In reality, the visual system is constantly adapting to changes in the environment and compares the various colors in a scene to reduce the effects of the illumination. If a scene is illuminated with one light, and then with another, as long as the difference between the light sources stays within a reasonable range, the colors in the scene appear relatively constant to us. This was studied by Edwin Land in the 1970s and led to his retinex theory of color constancy.

It should be noted, that both phenomena are readily explained and mathematically modeled with modern theories of chromatic adaptation and color appearance (e.g. CIECAM02, iCAM).[10] There is no need to dismiss the trichromatic theory of vision, but rather it can be enhanced with an understanding of how the visual system adapts to changes in the viewing environment.

Color naming

Colors vary in several different ways, including hue (shades of red, orange, yellow, green, blue, and violet), saturation, brightness, and gloss. Some color words are derived from the name of an object of that color, such as "orange" or "salmon", while others are abstract, like "red".
In the 1969 study Basic Color Terms: Their Universality and Evolution, Brent Berlin and Paul Kay describe a pattern in naming "basic" colors (like "red" but not "red-orange" or "dark red" or "blood red", which are "shades" of red). All languages that have two "basic" color names distinguish dark/cool colors from bright/warm colors. The next colors to be distinguished are usually red and then yellow or green. All languages with six "basic" colors include black, white, red, green, blue, and yellow. The pattern holds up to a set of twelve: black, gray, white, pink, red, orange, yellow, green, blue, purple, brown, and azure (distinct from blue in Russian and Italian, but not English).

Associations

Individual colors have a variety of cultural associations such as national colors (in general described in individual color articles and color symbolism). The field of color psychology attempts to identify the effects of color on human emotion and activity. Chromotherapy is a form of alternative medicine attributed to various Eastern traditions. Colors have different associations in different countries and cultures.[11]

Different colors have been demonstrated to have effects on cognition. For example, researchers at the University of Linz in Austria demonstrated that the color red significantly decreases cognitive functioning in men.[12]

Spectral colors and color reproduction


The CIE 1931 color space chromaticity diagram. The outer curved boundary is the spectral (or monochromatic) locus, with wavelengths shown in nanometers. The colors depicted depend on the color space of the device on which you are viewing the image, and therefore may not be a strictly accurate representation of the color at a particular position, and especially not for monochromatic colors.

Most light sources are mixtures of various wavelengths of light. Many such sources can still effectively produce a spectral color, as the eye cannot distinguish them from single-wavelength sources. For example, most computer displays reproduce the spectral color orange as a combination of red and green light; it appears orange because the red and green are mixed in the right proportions to allow the eye's cones to respond the way they do to the spectral color orange.

A useful concept in understanding the perceived color of a non-monochromatic light source is the dominant wavelength, which identifies the single wavelength of light that produces a sensation most similar to the light source. Dominant wavelength is roughly akin to hue.

There are many color perceptions that by definition cannot be pure spectral colors due to desaturation or because they are purples (mixtures of red and violet light, from opposite ends of the spectrum). Some examples of necessarily non-spectral colors are the achromatic colors (black, gray, and white) and colors such as pink, tan, and magenta.

Two different light spectra that have the same effect on the three color receptors in the human eye will be perceived as the same color. They are metamers of that color. This is exemplified by the white light emitted by fluorescent lamps, which typically has a spectrum of a few narrow bands, while daylight has a continuous spectrum. The human eye cannot tell the difference between such light spectra just by looking into the light source, although reflected colors from objects can look different. (This is often exploited; for example, to make fruit or tomatoes look more intensely red.)

Similarly, most human color perceptions can be generated by a mixture of three colors called primaries. This is used to reproduce color scenes in photography, printing, television, and other media. There are a number of methods or color spaces for specifying a color in terms of three particular primary colors. Each method has its advantages and disadvantages depending on the particular application.

No mixture of colors, however, can produce a response truly identical to that of a spectral color, although one can get close, especially for the longer wavelengths, where the CIE 1931 color space chromaticity diagram has a nearly straight edge. For example, mixing green light (530 nm) and blue light (460 nm) produces cyan light that is slightly desaturated, because response of the red color receptor would be greater to the green and blue light in the mixture than it would be to a pure cyan light at 485 nm that has the same intensity as the mixture of blue and green.

Because of this, and because the primaries in color printing systems generally are not pure themselves, the colors reproduced are never perfectly saturated spectral colors, and so spectral colors cannot be matched exactly. However, natural scenes rarely contain fully saturated colors, thus such scenes can usually be approximated well by these systems. The range of colors that can be reproduced with a given color reproduction system is called the gamut. The CIE chromaticity diagram can be used to describe the gamut.

Another problem with color reproduction systems is connected with the acquisition devices, like cameras or scanners. The characteristics of the color sensors in the devices are often very far from the characteristics of the receptors in the human eye. In effect, acquisition of colors can be relatively poor if they have special, often very "jagged", spectra caused for example by unusual lighting of the photographed scene. A color reproduction system "tuned" to a human with normal color vision may give very inaccurate results for other observers.

The different color response of different devices can be problematic if not properly managed. For color information stored and transferred in digital form, color management techniques, such as those based on ICC profiles, can help to avoid distortions of the reproduced colors. Color management does not circumvent the gamut limitations of particular output devices, but can assist in finding good mapping of input colors into the gamut that can be reproduced.

Additive coloring


Additive color mixing: adding red to green yields yellow; adding all three primary colors together yields white.

Additive color is light created by mixing together light of two or more different colors. Red, green, and blue are the additive primary colors normally used in additive color systems such as projectors and computer terminals.

Subtractive coloring


Subtractive color mixing: adding magenta to yellow yields red; adding all three primary colors together yields black

Subtractive coloring uses dyes, inks, and pigments to absorb some wavelengths of light and not others. The color that a surface displays comes from the parts of the visible spectrum that are not absorbed and therefore remain visible. Without pigments or dye, fabric fibers, paint base and paper are usually made of particles that scatter white light (all colors) well in all directions. When a pigment or ink is added, wavelengths are absorbed or "subtracted" from white light, so light of another color reaches the eye.

If the light is not a pure white source (the case of nearly all forms of artificial lighting), the resulting spectrum will appear a slightly different color. Red paint, viewed under blue light, may appear black. Red paint is red because it scatters only the red components of the spectrum. If red paint is illuminated by blue light, it will be absorbed by the red paint, creating the appearance of a black object.

Structural color

Structural colors are colors caused by interference effects rather than by pigments. Color effects are produced when a material is scored with fine parallel lines, formed of one or more parallel thin layers, or otherwise composed of microstructures on the scale of the color's wavelength. If the microstructures are spaced randomly, light of shorter wavelengths will be scattered preferentially to produce Tyndall effect colors: the blue of the sky (Rayleigh scattering, caused by structures much smaller than the wavelength of light, in this case air molecules), the luster of opals, and the blue of human irises. If the microstructures are aligned in arrays, for example the array of pits in a CD, they behave as a diffraction grating: the grating reflects different wavelengths in different directions due to interference phenomena, separating mixed "white" light into light of different wavelengths. If the structure is one or more thin layers then it will reflect some wavelengths and transmit others, depending on the layers' thickness.
Structural color is studied in the field of thin-film optics. A layman's term that describes particularly the most ordered or the most changeable structural colors is iridescence. Structural color is responsible for the blues and greens of the feathers of many birds (the blue jay, for example), as well as certain butterfly wings and beetle shells. Variations in the pattern's spacing often give rise to an iridescent effect, as seen in peacock feathers, soap bubbles, films of oil, and mother of pearl, because the reflected color depends upon the viewing angle. Numerous scientists have carried out research in butterfly wings and beetle shells, including Isaac Newton and Robert Hooke. Since 1942, electron micrography has been used, advancing the development of products that exploit structural color, such as "photonic" cosmetics.[13]

Mentions of color in social media

According to Pantone, the top three colors in social media for 2012 were red (186 million mentions; accredited to Taylor Swift's Red album, NASA's landing on Mars, and red carpet coverage), blue (125 million mentions; accredited to the United States presidential election, 2012, Mars rover Curiosity finding blue rocks, and blue sports teams), and Green (102 million mentions; accredited to "environmental friendliness", Green Bay Packers, and green eyed girls).[14]

Additional terms

  • Color Wheel: an illustrative organization of color hues in a circle that shows relationships.
  • Colorfulness, chroma, purity, or saturation: how "intense" or "concentrated" a color is. Technical definitions distinguish between colorfulness, chroma, and saturation as distinct perceptual attributes and include purity as a physical quantity. These terms, and others related to light and color are internationally agreed upon and published in the CIE Lighting Vocabulary.[15] More readily available texts on colorimetry also define and explain these terms.[10][16]
  • Dichromatism: a phenomenon where the hue is dependent on concentration and/or thickness of the absorbing substance.
  • Hue: the color's direction from white, for example in a color wheel or chromaticity diagram.
  • Shade: a color made darker by adding black.
  • Tint: a color made lighter by adding white.
  • Value, brightness, lightness, or luminosity: how light or dark a color is.

Brezhnev Doctrine

From Wikipedia, the free encyclopedia Eastern Bloc : the USSR and its satelli...