Search This Blog

Monday, December 2, 2019

Geomagnetic storm

From Wikipedia, the free encyclopedia
Artist's depiction of solar wind particles interacting with Earth's magnetosphere. Sizes are not to scale.
A geomagnetic storm (commonly referred to as a solar storm) is a temporary disturbance of the Earth's magnetosphere caused by a solar wind shock wave and/or cloud of magnetic field that interacts with the Earth's magnetic field

The disturbance that drives the magnetic storm may be a solar coronal mass ejection (CME) or a co-rotating interaction region (CIR), a high-speed stream of solar wind originating from a coronal hole. The frequency of geomagnetic storms increases and decreases with the sunspot cycle. During solar maximum, geomagnetic storms occur more often, with the majority driven by CMEs. During solar minimum, storms are mainly driven by CIRs (though CIR storms are more frequent at solar maximum than at minimum). 

The increase in the solar wind pressure initially compresses the magnetosphere. The solar wind's magnetic field interacts with the Earth's magnetic field and transfers an increased energy into the magnetosphere. Both interactions cause an increase in plasma movement through the magnetosphere (driven by increased electric fields inside the magnetosphere) and an increase in electric current in the magnetosphere and ionosphere. During the main phase of a geomagnetic storm, electric current in the magnetosphere creates a magnetic force that pushes out the boundary between the magnetosphere and the solar wind. 

Several space weather phenomena tend to be associated with or are caused by a geomagnetic storm. These include solar energetic particle (SEP) events, geomagnetically induced currents (GIC), ionospheric disturbances that cause radio and radar scintillation, disruption of navigation by magnetic compass and auroral displays at much lower latitudes than normal. 

The largest recorded geomagnetic storm, the Carrington Event in September 1859, took down parts of the recently created US telegraph network, starting fires and shocking some telegraph operators. In 1989, a geomagnetic storm energized ground induced currents that disrupted electric power distribution throughout most of Quebec and caused aurorae as far south as Texas.

Definition

A geomagnetic storm is defined by changes in the Dst (disturbance – storm time) index. The Dst index estimates the globally averaged change of the horizontal component of the Earth's magnetic field at the magnetic equator based on measurements from a few magnetometer stations. Dst is computed once per hour and reported in near-real-time. During quiet times, Dst is between +20 and −20 nano-Tesla (nT). 

A geomagnetic storm has three phases: initial, main and recovery. The initial phase is characterized by Dst (or its one-minute component SYM-H) increasing by 20 to 50 nT in tens of minutes. The initial phase is also referred to as a storm sudden commencement (SSC). However, not all geomagnetic storms have an initial phase and not all sudden increases in Dst or SYM-H are followed by a geomagnetic storm. The main phase of a geomagnetic storm is defined by Dst decreasing to less than −50 nT. The selection of −50 nT to define a storm is somewhat arbitrary. The minimum value during a storm will be between −50 and approximately −600 nT. The duration of the main phase is typically 2–8 hours. The recovery phase is when Dst changes from its minimum value to its quiet time value. The recovery phase may last as short as 8 hours or as long as 7 days. 

The size of a geomagnetic storm is classified as moderate (−50 nT > minimum of Dst > −100 nT), intense (−100 nT > minimum Dst > −250 nT) or super-storm (minimum of Dst < −250 nT).[7]

History of Theory

In 1931, Sydney Chapman and Vincenzo C. A. Ferraro wrote an article, A New Theory of Magnetic Storms, that sought to explain the phenomenon.[8] They argued that whenever the Sun emits a solar flare it also emits a plasma cloud, now known as a coronal mass ejection. They postulated that this plasma travels at a velocity such that it reaches Earth within 113 days, though we now know this journey takes 1 to 5 days. They wrote that the cloud then compresses the Earth's magnetic field and thus increases this field at the Earth's surface.[9] Chapman and Ferraro's work drew on that of, among others, Kristian Birkeland, who had used recently discovered cathode ray tubes to show that the rays were deflected towards the poles of a magnetic sphere. He theorised that a similar phenomenon was responsible for auroras, explaining why they are more frequent in polar regions.

Occurrences

The first scientific observation of the effects of a geomagnetic storm occurred early in the 19th century: From May 1806 until June 1807, Alexander von Humboldt recorded the bearing of a magnetic compass in Berlin. On 21 December 1806, he noticed that his compass had become erratic during a bright auroral event.[10]
On September 1–2, 1859, the largest recorded geomagnetic storm occurred. From August 28 until September 2, 1859, numerous sunspots and solar flares were observed on the Sun, with the largest flare on September 1. This is referred to as the Solar storm of 1859 or the Carrington Event. It can be assumed that a massive coronal mass ejection (CME) was launched from the Sun and reached the Earth within eighteen hours—a trip that normally takes three to four days. The horizontal field was reduced by 1600 nT as recorded by the Colaba Observatory. It is estimated that Dst would have been approximately −1760 nT.[11] Telegraph wires in both the United States and Europe experienced induced voltage increases (emf), in some cases even delivering shocks to telegraph operators and igniting fires. Aurorae were seen as far south as Hawaii, Mexico, Cuba and Italy—phenomena that are usually only visible in polar regions. Ice cores show evidence that events of similar intensity recur at an average rate of approximately once per 500 years.
Since 1859, less severe storms have occurred, notably the aurora of November 17, 1882 and the May 1921 geomagnetic storm, both with disruption of telegraph service and initiation of fires, and 1960, when widespread radio disruption was reported.[12]
GOES-7 monitors the space weather conditions during the Great Geomagnetic storm of March 1989, the Moscow neutron monitor recorded the passage of a CME as a drop in levels known as a Forbush decrease.[13]
In early August 1972, a series of flares and solar storms peaks with a flare estimated around X20 producing the fastest CME transit ever recorded and a severe geomagnetic and proton storm that disrupted terrestrial electrical and communications networks, as well as satellites (at least one made permanently inoperative), and unintentionally detonated numerous U.S. Navy magnetic-influence sea mines in North Vietnam.[14]
The March 1989 geomagnetic storm caused the collapse of the Hydro-Québec power grid in seconds as equipment protection relays tripped in a cascading sequence.[2][15] Six million people were left without power for nine hours. The storm caused auroras as far south as Texas.[3] The storm causing this event was the result of a coronal mass ejected from the Sun on March 9, 1989.[16] The minimum of Dst was −589 nT.
On July 14, 2000, an X5 class flare erupted (known as the Bastille Day event) and a coronal mass was launched directly at the Earth. A geomagnetic super storm occurred on July 15–17; the minimum of the Dst index was −301 nT. Despite the storm's strength, no power distribution failures were reported.[17] The Bastille Day event was observed by Voyager 1 and Voyager 2,[18] thus it is the farthest out in the Solar System that a solar storm has been observed.
Seventeen major flares erupted on the Sun between 19 October and 5 November 2003, including perhaps the most intense flare ever measured on the GOES XRS sensor—a huge X28 flare,[19] resulting in an extreme radio blackout, on 4 November. These flares were associated with CME events that caused three geomagnetic storms between 29 October and 2 November, during which the second and third storms were initiated before the previous storm period had fully recovered. The minimum Dst values were −151, −353 and −383 nT. Another storm in this sequence occurred on 4–5 November with a minimum Dst of −69 nT. The last geomagnetic storm was weaker than the preceding storms, because the active region on the Sun had rotated beyond the meridian where the central portion CME created during the flare event passed to the side of the Earth. The whole sequence became known as the Halloween Solar Storm.[20] The Wide Area Augmentation System (WAAS) operated by the Federal Aviation Administration (FAA) was offline for approximately 30 hours due to the storm.[21] The Japanese ADEOS-2 satellite was severely damaged and the operation of many other satellites were interrupted due to the storm.[22]

Interactions with planetary processes


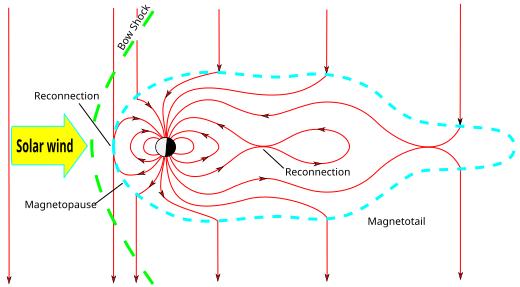
Magnetosphere in the near-Earth space environment.
The solar wind also carries with it the Sun's magnetic field. This field will have either a North or South orientation. If the solar wind has energetic bursts, contracting and expanding the magnetosphere, or if the solar wind takes a southward polarization, geomagnetic storms can be expected. The southward field causes magnetic reconnection of the dayside magnetopause, rapidly injecting magnetic and particle energy into the Earth's magnetosphere.
During a geomagnetic storm, the ionosphere's F2 layer becomes unstable, fragments, and may even disappear. In the northern and southern pole regions of the Earth, auroras are observable.

Instruments

Magnetometers monitor the auroral zone as well as the equatorial region. Two types of radar, coherent scatter and incoherent scatter, are used to probe the auroral ionosphere. By bouncing signals off ionospheric irregularities, which move with the field lines, one can trace their motion and infer magnetospheric convection.
Spacecraft instruments include:
  • Magnetometers, usually of the flux gate type. Usually these are at the end of booms, to keep them away from magnetic interference by the spacecraft and its electric circuits.[23]
  • Electric sensors at the ends of opposing booms are used to measure potential differences between separated points, to derive electric fields associated with convection. The method works best at high plasma densities in low Earth orbit; far from Earth long booms are needed, to avoid shielding-out of electric forces.
  • Radio sounders from the ground can bounce radio waves of varying frequency off the ionosphere, and by timing their return determine the electron density profile—up to its peak, past which radio waves no longer return. Radio sounders in low Earth orbit aboard the Canadian Alouette 1 (1962) and Alouette 2 (1965), beamed radio waves earthward and observed the electron density profile of the "topside ionosphere". Other radio sounding methods were also tried in the ionosphere (e.g. on IMAGE).
  • Particle detectors include a Geiger counter, as was used for the original observations of the Van Allen radiation belt. Scintillator detectors came later, and still later "channeltron" electron multipliers found particularly wide use. To derive charge and mass composition, as well as energies, a variety of mass spectrograph designs were used. For energies up to about 50 keV (which constitute most of the magnetospheric plasma) time-of-flight spectrometers (e.g. "top-hat" design) are widely used.[citation needed]
Computers have made it possible to bring together decades of isolated magnetic observations and extract average patterns of electrical currents and average responses to interplanetary variations. They also run simulations of the global magnetosphere and its responses, by solving the equations of magnetohydrodynamics (MHD) on a numerical grid. Appropriate extensions must be added to cover the inner magnetosphere, where magnetic drifts and ionospheric conduction need to be taken into account. So far the results are difficult to interpret, and certain assumptions are needed to cover small-scale phenomena.[citation needed]

Geomagnetic storm effects

Disruption of electrical systems

It has been suggested that a geomagnetic storm on the scale of the solar storm of 1859 today would cause billions or even trillions of dollars of damage to satellites, power grids and radio communications, and could cause electrical blackouts on a massive scale that might not be repaired for weeks, months, or even years.[21] Such sudden electrical blackouts may threaten food production.[24]

Mains electricity grid

When magnetic fields move about in the vicinity of a conductor such as a wire, a geomagnetically induced current is produced in the conductor. This happens on a grand scale during geomagnetic storms (the same mechanism also influenced telephone and telegraph lines before fiber optics, see above) on all long transmission lines. Long transmission lines (many kilometers in length) are thus subject to damage by this effect. Notably, this chiefly includes operators in China, North America, and Australia, especially in modern high-voltage, low-resistance lines. The European grid consists mainly of shorter transmission circuits, which are less vulnerable to damage.[25][26]
The (nearly direct) currents induced in these lines from geomagnetic storms are harmful to electrical transmission equipment, especially transformers—inducing core saturation, constraining their performance (as well as tripping various safety devices), and causing coils and cores to heat up. In extreme cases, this heat can disable or destroy them, even inducing a chain reaction that can overload transformers.[27][28] Most generators are connected to the grid via transformers, isolating them from the induced currents on the grid, making them much less susceptible to damage due to geomagnetically induced current. However, a transformer that is subjected to this will act as an unbalanced load to the generator, causing negative sequence current in the stator and consequently rotor heating.
According to a study by Metatech corporation, a storm with a strength comparable to that of 1921 would destroy more than 300 transformers and leave over 130 million people without power in the United States, costing several trillion dollars.[29] The British Daily Mail even claimed that a massive solar flare could knock out electric power for months, but[30] these predictions are contradicted by a North American Electric Reliability Corporation report that concludes that a geomagnetic storm would cause temporary grid instability but no widespread destruction of high-voltage transformers. The report points out that the widely quoted Quebec grid collapse was not caused by overheating transformers but by the near-simultaneous tripping of seven relays.[31]
Besides the transformers being vulnerable to the effects of a geomagnetic storm, electricity companies can also be affected indirectly by the geomagnetic storm. For instance, internet service providers may go down during geomagnetic storms (and/or remain non-operational long after). Electricity companies may have equipment requiring a working internet connection to function, so during the period the internet service provider is down, the electricity too may not be distributed.[32]
By receiving geomagnetic storm alerts and warnings (e.g. by the Space Weather Prediction Center; via Space Weather satellites as SOHO or ACE), power companies can minimize damage to power transmission equipment, by momentarily disconnecting transformers or by inducing temporary blackouts. Preventative measures also exist, including preventing the inflow of GICs into the grid through the neutral-to-ground connection.[25]

Communications

High frequency (3–30 MHz) communication systems use the ionosphere to reflect radio signals over long distances. Ionospheric storms can affect radio communication at all latitudes. Some frequencies are absorbed and others are reflected, leading to rapidly fluctuating signals and unexpected propagation paths. TV and commercial radio stations are little affected by solar activity, but ground-to-air, ship-to-shore, shortwave broadcast and amateur radio (mostly the bands below 30 MHz) are frequently disrupted. Radio operators using HF bands rely upon solar and geomagnetic alerts to keep their communication circuits up and running.
Military detection or early warning systems operating in the high frequency range are also affected by solar activity. The over-the-horizon radar bounces signals off the ionosphere to monitor the launch of aircraft and missiles from long distances. During geomagnetic storms, this system can be severely hampered by radio clutter. Also some submarine detection systems use the magnetic signatures of submarines as one input to their locating schemes. Geomagnetic storms can mask and distort these signals.
The Federal Aviation Administration routinely receives alerts of solar radio bursts so that they can recognize communication problems and avoid unnecessary maintenance. When an aircraft and a ground station are aligned with the Sun, high levels of noise can occur on air-control radio frequencies.[citation needed] This can also happen on UHF and SHF satellite communications, when an Earth station, a satellite and the Sun are in alignment. In order to prevent unnecessary maintenance on satellite communications systems aboard aircraft AirSatOne provides a live feed for geophysical events from NOAA's Space Weather Prediction Center. AirSatOne's live feed[33] allows users to view observed and predicted space storms. Geophysical Alerts are important to flight crews and maintenance personnel to determine if any upcoming activity or history has or will have an effect on satellite communications, GPS navigation and HF Communications.
Telegraph lines in the past were affected by geomagnetic storms. Telegraphs used a single long wire for the data line, stretching for many miles, using the ground as the return wire and fed with DC power from a battery; this made them (together with the power lines mentioned below) susceptible to being influenced by the fluctuations caused by the ring current. The voltage/current induced by the geomagnetic storm could have diminished the signal, when subtracted from the battery polarity, or to overly strong and spurious signals when added to it; some operators learned to disconnect the battery and rely on the induced current as their power source. In extreme cases the induced current was so high the coils at the receiving side burst in flames, or the operators received electric shocks. Geomagnetic storms affect also long-haul telephone lines, including undersea cables unless they are fiber optic.[34]
Damage to communications satellites can disrupt non-terrestrial telephone, television, radio and Internet links.[35] The National Academy of Sciences reported in 2008 on possible scenarios of widespread disruption in the 2012–2013 solar peak.[36]

Navigation systems

The Global Navigation Satellite System (GNSS), and other navigation systems such as LORAN and the now-defunct OMEGA are adversely affected when solar activity disrupts their signal propagation. The OMEGA system consisted of eight transmitters located throughout the world. Airplanes and ships used the very low frequency signals from these transmitters to determine their positions. During solar events and geomagnetic storms, the system gave navigators information that was inaccurate by as much as several miles. If navigators had been alerted that a proton event or geomagnetic storm was in progress, they could have switched to a backup system.
GNSS signals are affected when solar activity causes sudden variations in the density of the ionosphere, causing the satellite signals to scintillate (like a twinkling star). The scintillation of satellite signals during ionospheric disturbances is studied at HAARP during ionospheric modification experiments. It has also been studied at the Jicamarca Radio Observatory.
One technology used to allow GPS receivers to continue to operate in the presence of some confusing signals is Receiver Autonomous Integrity Monitoring (RAIM). However, RAIM is predicated on the assumption that a majority of the GPS constellation is operating properly, and so it is much less useful when the entire constellation is perturbed by global influences such as geomagnetic storms. Even if RAIM detects a loss of integrity in these cases, it may not be able to provide a useful, reliable signal.

Satellite hardware damage

Geomagnetic storms and increased solar ultraviolet emission heat Earth's upper atmosphere, causing it to expand. The heated air rises, and the density at the orbit of satellites up to about 1,000 km (621 mi) increases significantly. This results in increased drag, causing satellites to slow and change orbit slightly. Low Earth Orbit satellites that are not repeatedly boosted to higher orbits slowly fall and eventually burn up.
Skylab's 1979 destruction is an example of a spacecraft reentering Earth's atmosphere prematurely as a result of higher-than-expected solar activity. During the great geomagnetic storm of March 1989, four of the Navy's navigational satellites had to be taken out of service for up to a week, the U.S. Space Command had to post new orbital elements for over 1000 objects affected and the Solar Maximum Mission satellite fell out of orbit in December the same year.[citation needed]
The vulnerability of the satellites depends on their position as well. The South Atlantic Anomaly is a perilous place for a satellite to pass through.
As technology has allowed spacecraft components to become smaller, their miniaturized systems have become increasingly vulnerable to the more energetic solar particles. These particles can physically damage microchips and can change software commands in satellite-borne computers.[citation needed]
Another problem for satellite operators is differential charging. During geomagnetic storms, the number and energy of electrons and ions increase. When a satellite travels through this energized environment, the charged particles striking the spacecraft differentially charge portions of the spacecraft. Discharges can arc across spacecraft components, harming and possibly disabling them.[citation needed]
Bulk charging (also called deep charging) occurs when energetic particles, primarily electrons, penetrate the outer covering of a satellite and deposit their charge in its internal parts. If sufficient charge accumulates in any one component, it may attempt to neutralize by discharging to other components. This discharge is potentially hazardous to the satellite's electronic systems.[citation needed]

Geologic exploration

Earth's magnetic field is used by geologists to determine subterranean rock structures. For the most part, these geodetic surveyors are searching for oil, gas or mineral deposits. They can accomplish this only when Earth's field is quiet, so that true magnetic signatures can be detected. Other geophysicists prefer to work during geomagnetic storms, when strong variations in the Earth's normal subsurface electric currents allow them to sense subsurface oil or mineral structures. This technique is called magnetotellurics. For these reasons, many surveyors use geomagnetic alerts and predictions to schedule their mapping activities.[citation needed]

Pipelines

Rapidly fluctuating geomagnetic fields can produce geomagnetically induced currents in pipelines. This can cause multiple problems for pipeline engineers. Pipeline flow meters can transmit erroneous flow information and the corrosion rate of the pipeline can be dramatically increased.[37][38]

Radiation hazards to humans

Intense solar flares release very-high-energy particles that can cause radiation poisoning.[citation needed]
Earth's atmosphere and magnetosphere allow adequate protection at ground level, but astronauts are subject to potentially lethal doses of radiation. The penetration of high-energy particles into living cells can cause chromosome damage, cancer and other health problems. Large doses can be immediately fatal.
Solar protons with energies greater than 30 MeV are particularly hazardous.[39]
Solar proton events can also produce elevated radiation aboard aircraft flying at high altitudes. Although these risks are small, monitoring of solar proton events by satellite instrumentation allows the occasional exposure to be monitored and evaluated and eventually flight paths and altitudes adjusted in order to lower the absorbed dose of the flight crews.[40][41][42]

Effect on animals

Scientists are still studying whether or not animals are affected by this, some suggesting this is why whales beach themselves.[43][44] Some have stated the possibility that other migrating animals including birds and honey bees, might be affected since they also use magnetoreception to navigate, and geomagnetic storms alter the Earth's magnetic fields temporarily.[45]

Sunday, December 1, 2019

Ionosphere

From Wikipedia, the free encyclopedia
 
The ionosphere (/ˈɒnəˌsfɪər/) is the ionized part of Earth's upper atmosphere, from about 60 km (37 mi) to 1,000 km (620 mi) altitude, a region that includes the thermosphere and parts of the mesosphere and exosphere. The ionosphere is ionized by solar radiation. It plays an important role in atmospheric electricity and forms the inner edge of the magnetosphere. It has practical importance because, among other functions, it influences radio propagation to distant places on the Earth. The region below the ionosphere is called neutral atmosphere, or neutrosphere
 
Relationship of the atmosphere and ionosphere

History of discovery

As early as 1839, the German mathematician and physicist Carl Friedrich Gauss postulated that an electrically conducting region of the atmosphere could account for observed variations of Earth's magnetic field. Sixty years later, Guglielmo Marconi received the first trans-Atlantic radio signal on December 12, 1901, in St. John's, Newfoundland (now in Canada) using a 152.4 m (500 ft) kite-supported antenna for reception. The transmitting station in Poldhu, Cornwall, used a spark-gap transmitter to produce a signal with a frequency of approximately 500 kHz and a power of 100 times more than any radio signal previously produced. The message received was three dits, the Morse code for the letter S. To reach Newfoundland the signal would have to bounce off the ionosphere twice. Dr. Jack Belrose has contested this, however, based on theoretical and experimental work. However, Marconi did achieve transatlantic wireless communications in Glace Bay, Nova Scotia, one year later.

In 1902, Oliver Heaviside proposed the existence of the Kennelly–Heaviside layer of the ionosphere which bears his name. Heaviside's proposal included means by which radio signals are transmitted around the Earth's curvature. Heaviside's proposal, coupled with Planck's law of black-body radiation, may have hampered the growth of radio astronomy for the detection of electromagnetic waves from celestial bodies until 1932 (and the development of high-frequency radio transceivers). Also in 1902, Arthur Edwin Kennelly discovered some of the ionosphere's radio-electrical properties.
In 1912, the U.S. Congress imposed the Radio Act of 1912 on amateur radio operators, limiting their operations to frequencies above 1.5 MHz (wavelength 200 meters or smaller).  The government thought those frequencies were useless. This led to the discovery of HF radio propagation via the ionosphere in 1923.

In 1926, Scottish physicist Robert Watson-Watt introduced the term ionosphere in a letter published only in 1969 in Nature:
We have in quite recent years seen the universal adoption of the term 'stratosphere'..and..the companion term 'troposphere'... The term 'ionosphere', for the region in which the main characteristic is large scale ionisation with considerable mean free paths, appears appropriate as an addition to this series.
In the early 1930s, test transmissions of Radio Luxembourg inadvertently provided evidence of the first radio modification of the ionosphere; HAARP ran a series of experiments in 2017 using the eponymous Luxembourg Effect.

Edward V. Appleton was awarded a Nobel Prize in 1947 for his confirmation in 1927 of the existence of the ionosphere. Lloyd Berkner first measured the height and density of the ionosphere. This permitted the first complete theory of short-wave radio propagation. Maurice V. Wilkes and J. A. Ratcliffe researched the topic of radio propagation of very long radio waves in the ionosphere. Vitaly Ginzburg has developed a theory of electromagnetic wave propagation in plasmas such as the ionosphere.

In 1962, the Canadian satellite Alouette 1 was launched to study the ionosphere. Following its success were Alouette 2 in 1965 and the two ISIS satellites in 1969 and 1971, further AEROS-A and -B in 1972 and 1975, all for measuring the ionosphere.

On July 26, 1963 the first operational geosynchronous satellite Syncom 2 was launched. The board radio beacons on this satellite (and its successors) enabled – for the first time – the measurement of total electron content (TEC) variation along a radio beam from geostationary orbit to an earth receiver. (The rotation of the plane of polarization directly measures TEC along the path.) Australian geophysicist Elizabeth Essex-Cohen from 1969 onwards was using this technique to monitor the atmosphere above Australia and Antarctica.

Geophysics

The ionosphere is a shell of electrons and electrically charged atoms and molecules that surrounds the Earth, stretching from a height of about 50 km (31 mi) to more than 1,000 km (620 mi). It exists primarily due to ultraviolet radiation from the Sun.

The lowest part of the Earth's atmosphere, the troposphere extends from the surface to about 10 km (6.2 mi). Above that is the stratosphere, followed by the mesosphere. In the stratosphere incoming solar radiation creates the ozone layer. At heights of above 80 km (50 mi), in the thermosphere, the atmosphere is so thin that free electrons can exist for short periods of time before they are captured by a nearby positive ion. The number of these free electrons is sufficient to affect radio propagation. This portion of the atmosphere is partially ionized and contains a plasma which is referred to as the ionosphere.

Ultraviolet (UV), X-ray and shorter wavelengths of solar radiation are ionizing, since photons at these frequencies contain sufficient energy to dislodge an electron from a neutral gas atom or molecule upon absorption. In this process the light electron obtains a high velocity so that the temperature of the created electronic gas is much higher (of the order of thousand K) than the one of ions and neutrals. The reverse process to ionization is recombination, in which a free electron is "captured" by a positive ion. Recombination occurs spontaneously, and causes the emission of a photon carrying away the energy produced upon recombination. As gas density increases at lower altitudes, the recombination process prevails, since the gas molecules and ions are closer together. The balance between these two processes determines the quantity of ionization present. 

Ionization depends primarily on the Sun and its activity. The amount of ionization in the ionosphere varies greatly with the amount of radiation received from the Sun. Thus there is a diurnal (time of day) effect and a seasonal effect. The local winter hemisphere is tipped away from the Sun, thus there is less received solar radiation. The activity of the Sun is associated with the sunspot cycle, with more radiation occurring with more sunspots. Radiation received also varies with geographical location (polar, auroral zones, mid-latitudes, and equatorial regions). There are also mechanisms that disturb the ionosphere and decrease the ionization. There are disturbances such as solar flares and the associated release of charged particles into the solar wind which reaches the Earth and interacts with its geomagnetic field.

Layers of ionization

Ionospheric layers.
 
At night the F layer is the only layer of significant ionization present, while the ionization in the E and D layers is extremely low. During the day, the D and E layers become much more heavily ionized, as does the F layer, which develops an additional, weaker region of ionisation known as the F1 layer. The F2 layer persists by day and night and is the main region responsible for the refraction and reflection of radio waves.

D layer

The D layer is the innermost layer, 60 km (37 mi) to 90 km (56 mi) above the surface of the Earth. Ionization here is due to Lyman series-alpha hydrogen radiation at a wavelength of 121.6 nanometre (nm) ionizing nitric oxide (NO). In addition, high solar activity can generate hard X-rays (wavelength < 1 nm) that ionize N2 and O2. Recombination rates are high in the D layer, so there are many more neutral air molecules than ions.

Medium frequency (MF) and lower high frequency (HF) radio waves are significantly attenuated within the D layer, as the passing radio waves cause electrons to move, which then collide with the neutral molecules, giving up their energy. Lower frequencies experience greater absorption because they move the electrons farther, leading to greater chance of collisions. This is the main reason for absorption of HF radio waves, particularly at 10 MHz and below, with progressively less absorption at higher frequencies. This effect peaks around noon and is reduced at night due to a decrease in the D layer's thickness; only a small part remains due to cosmic rays. A common example of the D layer in action is the disappearance of distant AM broadcast band stations in the daytime.

During solar proton events, ionization can reach unusually high levels in the D-region over high and polar latitudes. Such very rare events are known as Polar Cap Absorption (or PCA) events, because the increased ionization significantly enhances the absorption of radio signals passing through the region. In fact, absorption levels can increase by many tens of dB during intense events, which is enough to absorb most (if not all) transpolar HF radio signal transmissions. Such events typically last less than 24 to 48 hours.

E layer

The E layer is the middle layer, 90 km (56 mi) to 150 km (93 mi) above the surface of the Earth. Ionization is due to soft X-ray (1–10 nm) and far ultraviolet (UV) solar radiation ionization of molecular oxygen (O2). Normally, at oblique incidence, this layer can only reflect radio waves having frequencies lower than about 10 MHz and may contribute a bit to absorption on frequencies above. However, during intense sporadic E events, the Es layer can reflect frequencies up to 50 MHz and higher. The vertical structure of the E layer is primarily determined by the competing effects of ionization and recombination. At night the E layer weakens because the primary source of ionization is no longer present. After sunset an increase in the height of the E layer maximum increases the range to which radio waves can travel by reflection from the layer.

This region is also known as the Kennelly–Heaviside layer or simply the Heaviside layer. Its existence was predicted in 1902 independently and almost simultaneously by the American electrical engineer Arthur Edwin Kennelly (1861–1939) and the British physicist Oliver Heaviside (1850–1925). However, it was not until 1924 that its existence was detected by Edward V. Appleton and Miles Barnett.

Es

The Es layer (sporadic E-layer) is characterized by small, thin clouds of intense ionization, which can support reflection of radio waves, rarely up to 225 MHz. Sporadic-E events may last for just a few minutes to several hours. Sporadic E propagation makes VHF-operating radio amateurs very excited, as propagation paths that are generally unreachable can open up. There are multiple causes of sporadic-E that are still being pursued by researchers. This propagation occurs most frequently during the summer months when high signal levels may be reached. The skip distances are generally around 1,640 km (1,020 mi). Distances for one hop propagation can be anywhere from 900 km (560 mi) to 2,500 km (1,600 mi). Double-hop reception over 3,500 km (2,200 mi) is possible.

F layer

The F layer or region, also known as the Appleton–Barnett layer, extends from about 150 km (93 mi) to more than 500 km (310 mi) above the surface of Earth. It is the layer with the highest electron density, which implies signals penetrating this layer will escape into space. Electron production is dominated by extreme ultraviolet (UV, 10–100 nm) radiation ionizing atomic oxygen. The F layer consists of one layer (F2) at night, but during the day, a secondary peak (labelled F1) often forms in the electron density profile. Because the F2 layer remains by day and night, it is responsible for most skywave propagation of radio waves and long distance high frequency (HF, or shortwave) radio communications.

Above the F layer, the number of oxygen ions decreases and lighter ions such as hydrogen and helium become dominant. This region above the F layer peak and below the plasmasphere is called the topside ionosphere. 

From 1972 to 1975 NASA launched the AEROS and AEROS B satellites to study the F region.

Ionospheric model

An ionospheric model is a mathematical description of the ionosphere as a function of location, altitude, day of year, phase of the sunspot cycle and geomagnetic activity. Geophysically, the state of the ionospheric plasma may be described by four parameters: electron density, electron and ion temperature and, since several species of ions are present, ionic composition. Radio propagation depends uniquely on electron density.

Models are usually expressed as computer programs. The model may be based on basic physics of the interactions of the ions and electrons with the neutral atmosphere and sunlight, or it may be a statistical description based on a large number of observations or a combination of physics and observations. One of the most widely used models is the International Reference Ionosphere (IRI), which is based on data and specifies the four parameters just mentioned. The IRI is an international project sponsored by the Committee on Space Research (COSPAR) and the International Union of Radio Science (URSI). The major data sources are the worldwide network of ionosondes, the powerful incoherent scatter radars (Jicamarca, Arecibo, Millstone Hill, Malvern, St Santin), the ISIS and Alouette topside sounders, and in situ instruments on several satellites and rockets. IRI is updated yearly. IRI is more accurate in describing the variation of the electron density from bottom of the ionosphere to the altitude of maximum density than in describing the total electron content (TEC). Since 1999 this model is "International Standard" for the terrestrial ionosphere (standard TS16457).

Persistent anomalies to the idealized model

Ionograms allow deducing, via computation, the true shape of the different layers. Nonhomogeneous structure of the electron/ion-plasma produces rough echo traces, seen predominantly at night and at higher latitudes, and during disturbed conditions.

Winter anomaly

At mid-latitudes, the F2 layer daytime ion production is higher in the summer, as expected, since the Sun shines more directly on the Earth. However, there are seasonal changes in the molecular-to-atomic ratio of the neutral atmosphere that cause the summer ion loss rate to be even higher. The result is that the increase in the summertime loss overwhelms the increase in summertime production, and total F2 ionization is actually lower in the local summer months. This effect is known as the winter anomaly. The anomaly is always present in the northern hemisphere, but is usually absent in the southern hemisphere during periods of low solar activity.

Equatorial anomaly

Electric currents created in sunward ionosphere.
 
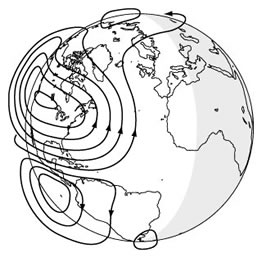
Within approximately ± 20 degrees of the magnetic equator, is the equatorial anomaly. It is the occurrence of a trough in the ionization in the F2 layer at the equator and crests at about 17 degrees in magnetic latitude. The Earth's magnetic field lines are horizontal at the magnetic equator. Solar heating and tidal oscillations in the lower ionosphere move plasma up and across the magnetic field lines. This sets up a sheet of electric current in the E region which, with the horizontal magnetic field, forces ionization up into the F layer, concentrating at ± 20 degrees from the magnetic equator. This phenomenon is known as the equatorial fountain.

Equatorial electrojet

The worldwide solar-driven wind results in the so-called Sq (solar quiet) current system in the E region of the Earth's ionosphere (ionospheric dynamo region) (100–130 km (62–81 mi) altitude). Resulting from this current is an electrostatic field directed west–east (dawn–dusk) in the equatorial day side of the ionosphere. At the magnetic dip equator, where the geomagnetic field is horizontal, this electric field results in an enhanced eastward current flow within ± 3 degrees of the magnetic equator, known as the equatorial electrojet.

Ephemeral ionospheric perturbations

X-rays: sudden ionospheric disturbances (SID)

When the Sun is active, strong solar flares can occur that hit the sunlit side of Earth with hard X-rays. The X-rays penetrate to the D-region, releasing electrons that rapidly increase absorption, causing a high frequency (3–30 MHz) radio blackout. During this time very low frequency (3–30 kHz) signals will be reflected by the D layer instead of the E layer, where the increased atmospheric density will usually increase the absorption of the wave and thus dampen it. As soon as the X-rays end, the sudden ionospheric disturbance (SID) or radio black-out ends as the electrons in the D-region recombine rapidly and signal strengths return to normal.

Protons: polar cap absorption (PCA)

Associated with solar flares is a release of high-energy protons. These particles can hit the Earth within 15 minutes to 2 hours of the solar flare. The protons spiral around and down the magnetic field lines of the Earth and penetrate into the atmosphere near the magnetic poles increasing the ionization of the D and E layers. PCA's typically last anywhere from about an hour to several days, with an average of around 24 to 36 hours. Coronal mass ejections can also release energetic protons that enhance D-region absorption in the polar regions.

Geomagnetic storms

A geomagnetic storm is a temporary intense disturbance of the Earth's magnetosphere.
  • During a geomagnetic storm the F₂ layer will become unstable, fragment, and may even disappear completely.
  • In the Northern and Southern pole regions of the Earth aurorae will be observable in the sky.

Lightning

Lightning can cause ionospheric perturbations in the D-region in one of two ways. The first is through VLF (very low frequency) radio waves launched into the magnetosphere. These so-called "whistler" mode waves can interact with radiation belt particles and cause them to precipitate onto the ionosphere, adding ionization to the D-region. These disturbances are called "lightning-induced electron precipitation" (LEP) events.

Additional ionization can also occur from direct heating/ionization as a result of huge motions of charge in lightning strikes. These events are called early/fast. 

In 1925, C. T. R. Wilson proposed a mechanism by which electrical discharge from lightning storms could propagate upwards from clouds to the ionosphere. Around the same time, Robert Watson-Watt, working at the Radio Research Station in Slough, UK, suggested that the ionospheric sporadic E layer (Es) appeared to be enhanced as a result of lightning but that more work was needed. In 2005, C. Davis and C. Johnson, working at the Rutherford Appleton Laboratory in Oxfordshire, UK, demonstrated that the Es layer was indeed enhanced as a result of lightning activity. Their subsequent research has focused on the mechanism by which this process can occur.

Applications

Radio communication

Due to the ability of ionized atmospheric gases to refract high frequency (HF, or shortwave) radio waves, the ionosphere can reflect radio waves directed into the sky back toward the Earth. Radio waves directed at an angle into the sky can return to Earth beyond the horizon. This technique, called "skip" or "skywave" propagation, has been used since the 1920s to communicate at international or intercontinental distances. The returning radio waves can reflect off the Earth's surface into the sky again, allowing greater ranges to be achieved with multiple hops. This communication method is variable and unreliable, with reception over a given path depending on time of day or night, the seasons, weather, and the 11-year sunspot cycle. During the first half of the 20th century it was widely used for transoceanic telephone and telegraph service, and business and diplomatic communication. Due to its relative unreliability, shortwave radio communication has been mostly abandoned by the telecommunications industry, though it remains important for high-latitude communication where satellite-based radio communication is not possible. Some broadcasting stations and automated services still use shortwave radio frequencies, as do radio amateur hobbyists for private recreational contacts.

Mechanism of refraction

When a radio wave reaches the ionosphere, the electric field in the wave forces the electrons in the ionosphere into oscillation at the same frequency as the radio wave. Some of the radio-frequency energy is given up to this resonant oscillation. The oscillating electrons will then either be lost to recombination or will re-radiate the original wave energy. Total refraction can occur when the collision frequency of the ionosphere is less than the radio frequency, and if the electron density in the ionosphere is great enough.

A qualitative understanding of how an electromagnetic wave propagates through the ionosphere can be obtained by recalling geometric optics. Since the ionosphere is a plasma, it can be shown that the refractive index is less than unity. Hence, the electromagnetic "ray" is bent away from the normal rather than toward the normal as would be indicated when the refractive index is greater than unity. It can also be shown that the refractive index of a plasma, and hence the ionosphere, is frequency-dependent, see Dispersion (optics).

The critical frequency is the limiting frequency at or below which a radio wave is reflected by an ionospheric layer at vertical incidence. If the transmitted frequency is higher than the plasma frequency of the ionosphere, then the electrons cannot respond fast enough, and they are not able to re-radiate the signal. It is calculated as shown below:
where N = electron density per m3 and fcritical is in Hz.

The Maximum Usable Frequency (MUF) is defined as the upper frequency limit that can be used for transmission between two points at a specified time.
where = angle of attack, the angle of the wave relative to the horizon, and sin is the sine function.
The cutoff frequency is the frequency below which a radio wave fails to penetrate a layer of the ionosphere at the incidence angle required for transmission between two specified points by refraction from the layer.

Other applications

The open system electrodynamic tether, which uses the ionosphere, is being researched. The space tether uses plasma contactors and the ionosphere as parts of a circuit to extract energy from the Earth's magnetic field by electromagnetic induction.

Measurements

Overview

Scientists explore the structure of the ionosphere by a wide variety of methods. They include:
A variety of experiments, such as HAARP (High Frequency Active Auroral Research Program), involve high power radio transmitters to modify the properties of the ionosphere. These investigations focus on studying the properties and behavior of ionospheric plasma, with particular emphasis on being able to understand and use it to enhance communications and surveillance systems for both civilian and military purposes. HAARP was started in 1993 as a proposed twenty-year experiment, and is currently active near Gakona, Alaska.

The SuperDARN radar project researches the high- and mid-latitudes using coherent backscatter of radio waves in the 8 to 20 MHz range. Coherent backscatter is similar to Bragg scattering in crystals and involves the constructive interference of scattering from ionospheric density irregularities. The project involves more than 11 different countries and multiple radars in both hemispheres.

Scientists are also examining the ionosphere by the changes to radio waves, from satellites and stars, passing through it. The Arecibo radio telescope located in Puerto Rico, was originally intended to study Earth's ionosphere.

Ionograms

Ionograms show the virtual heights and critical frequencies of the ionospheric layers and which are measured by an ionosonde. An ionosonde sweeps a range of frequencies, usually from 0.1 to 30 MHz, transmitting at vertical incidence to the ionosphere. As the frequency increases, each wave is refracted less by the ionization in the layer, and so each penetrates further before it is reflected. Eventually, a frequency is reached that enables the wave to penetrate the layer without being reflected. For ordinary mode waves, this occurs when the transmitted frequency just exceeds the peak plasma, or critical, frequency of the layer. Tracings of the reflected high frequency radio pulses are known as ionograms. Reduction rules are given in: "URSI Handbook of Ionogram Interpretation and Reduction", edited by William Roy Piggott and Karl Rawer, Elsevier Amsterdam, 1961 (translations into Chinese, French, Japanese and Russian are available).

Incoherent scatter radars

Incoherent scatter radars operate above the critical frequencies. Therefore, the technique allows probing the ionosphere, unlike ionosondes, also above the electron density peaks. The thermal fluctuations of the electron density scattering the transmitted signals lack coherence, which gave the technique its name. Their power spectrum contains information not only on the density, but also on the ion and electron temperatures, ion masses and drift velocities.

GNSS radio occultation

Radio occultation is a remote sensing technique where a GNSS signal tangentially scrapes the Earth, passing through the atmosphere, and is received by a Low Earth Orbit (LEO) satellite. As the signal passes through the atmosphere, it is refracted, curved and delayed. An LEO satellite samples the total electron content and bending angle of many such signal paths as it watches the GNSS satellite rise or set behind the Earth. Using an Inverse Abel's transform, a radial profile of refractivity at that tangent point on earth can be reconstructed. 

Major GNSS radio occultation missions include the GRACE, CHAMP, and COSMIC.

Indices of the ionosphere

In empirical models of the ionosphere such as Nequick, the following indices are used as indirect indicators of the state of the ionosphere.

Solar intensity

F10.7 and R12 are two indices commonly used in ionospheric modelling. Both are valuable for their long historical records covering multiple solar cycles. F10.7 is a measurement of the intensity of solar radio emissions at a frequency of 2800 MHz made using a ground radio telescope. R12 is a 12 months average of daily sunspot numbers. Both indices have been shown to be correlated to each other. 

However, both indices are only indirect indicators of solar ultraviolet and X-ray emissions, which are primarily responsible for causing ionization in the Earth's upper atmosphere. We now have data from the GOES spacecraft that measures the background X-ray flux from the Sun, a parameter more closely related to the ionization levels in the ionosphere.

Geomagnetic disturbances

  • The A- and K-indices are a measurement of the behavior of the horizontal component of the geomagnetic field. The K-index uses a scale from 0 to 9 to measure the change in the horizontal component of the geomagnetic field. A new K-index is determined at the Boulder Geomagnetic Observatory.
  • The geomagnetic activity levels of the Earth are measured by the fluctuation of the Earth's magnetic field in SI units called teslas (or in non-SI gauss, especially in older literature). The Earth's magnetic field is measured around the planet by many observatories. The data retrieved is processed and turned into measurement indices. Daily measurements for the entire planet are made available through an estimate of the Ap-index, called the planetary A-index (PAI).

GPS/GNSS ionospheric correction

There are a number of models used to understand the effects of the ionosphere global navigation satellite systems. The Klobuchar model is currently used to compensate for ionospheric effects in GPS. This model was developed at the US Air Force Geophysical Research Laboratory circa 1974 by John (Jack) Klobuchar. The Galileo navigation system uses the NeQuick model.

Ionospheres of other planets and natural satellites

Objects in the Solar System that have appreciable atmospheres (i.e., all of the major planets and many of the larger natural satellites) generally produce ionospheres. Planets known to have ionospheres include Venus, Uranus, Mars and Jupiter

The atmosphere of Titan includes an ionosphere that ranges from about 1,100 km (680 mi) to 1,300 km (810 mi) in altitude and contains carbon compounds.

Atmospheric electricity

From Wikipedia, the free encyclopedia
 
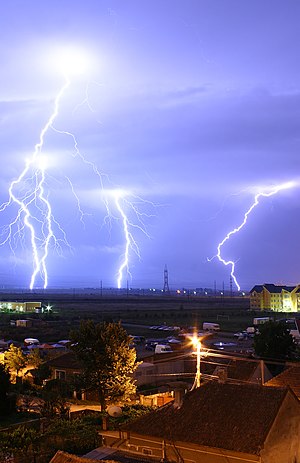
Cloud to ground lightning. Typically, lightning discharges 30,000 amperes, at up to 100 million volts, and emits light, radio waves, x-rays and even gamma rays. Plasma temperatures in lightning can approach 28,000 kelvins.
 
Atmospheric electricity is the study of electrical charges in the Earth's atmosphere (or that of another planet). The movement of charge between the Earth's surface, the atmosphere, and the ionosphere is known as the global atmospheric electrical circuit. Atmospheric electricity is an interdisciplinary topic with a long history, involving concepts from electrostatics, atmospheric physics, meteorology and Earth science.

Thunderstorms act as a giant battery in the atmosphere, charging up the electrosphere to about 400,000 volts with respect to the surface. This sets up an electric field throughout the atmosphere, which decreases with increase in altitude. Atmospheric ions created by cosmic rays and natural radioactivity move in the electric field, so a very small current flows through the atmosphere, even away from thunderstorms. Near the surface of the earth, the magnitude of the field is on average around 100 V/m.

Atmospheric electricity involves both thunderstorms, which create lightning bolts to rapidly discharge huge amounts of atmospheric charge stored in storm clouds, and the continual electrification of the air due to ionization from cosmic rays and natural radioactivity, which ensure that the atmosphere is never quite neutral.

History

Sparks drawn from electrical machines and from Leyden jars suggested to the early experimenters, Hauksbee, Newton, Wall, Nollet, and Gray, that lightning was caused by electric discharges. In 1708, Dr. William Wall was one of the first to observe that spark discharges resembled miniature lightning, after observing the sparks from a charged piece of amber

Benjamin Franklin's experiments showed that electrical phenomena of the atmosphere were not fundamentally different from those produced in the laboratory, by listing many similarities between electricity and lightning. By 1749, Franklin observed lightning to possess almost all the properties observable in electrical machines. 

In July 1750, Franklin hypothesized that electricity could be taken from clouds via a tall metal aerial with a sharp point. Before Franklin could carry out his experiment, in 1752 Thomas-François Dalibard erected a 40-foot (12 m) iron rod at Marly-la-Ville, near Paris, drawing sparks from a passing cloud. With ground-insulated aerials, an experimenter could bring a grounded lead with an insulated wax handle close to the aerial, and observe a spark discharge from the aerial to the grounding wire. In May 1752, Dalibard affirmed that Franklin's theory was correct.

Around June 1752, Franklin reportedly performed his famous kite experiment. The kite experiment was repeated by Romas, who drew from a metallic string sparks 9 feet (2.7 m) long, and by Cavallo, who made many important observations on atmospheric electricity. Lemonnier (1752) also reproduced Franklin's experiment with an aerial, but substituted the ground wire with some dust particles (testing attraction). He went on to document the fair weather condition, the clear-day electrification of the atmosphere, and its diurnal variation. Beccaria (1775) confirmed Lemonnier's diurnal variation data and determined that the atmosphere's charge polarity was positive in fair weather. Saussure (1779) recorded data relating to a conductor's induced charge in the atmosphere. Saussure's instrument (which contained two small spheres suspended in parallel with two thin wires) was a precursor to the electrometer. Saussure found that the atmospheric electrification under clear weather conditions had an annual variation, and that it also varied with height. In 1785, Coulomb discovered the electrical conductivity of air. His discovery was contrary to the prevailing thought at the time, that the atmospheric gases were insulators (which they are to some extent, or at least not very good conductors when not ionized). Erman (1804) theorized that the Earth was negatively charged, and Peltier (1842) tested and confirmed Erman's idea.

Several researchers contributed to the growing body of knowledge about atmospheric electrical phenomena. Francis Ronalds began observing the potential gradient and air-earth currents around 1810, including making continuous automated recordings. He resumed his research in the 1840s as the inaugural Honorary Director of the Kew Observatory, where the first extended and comprehensive dataset of electrical and associated meteorological parameters was created. He also supplied his equipment to other facilities around the world with the goal of delineating atmospheric electricity on a global scale. Kelvin's new water dropper collector and divided-ring electrometer  were introduced at Kew Observatory in the 1860s, and atmospheric electricity remained a speciality of the observatory until its closure. For high-altitude measurements, kites were once used, and weather balloons or aerostats are still used, to lift experimental equipment into the air. Early experimenters even went aloft themselves in hot-air balloons

Hoffert (1888) identified individual lightning downward strokes using early cameras. Elster and Geitel, who also worked on thermionic emission, proposed a theory to explain thunderstorms' electrical structure (1885) and, later, discovered atmospheric radioactivity (1899) from the existence of positive and negative ions in the atmosphere. Pockels (1897) estimated lightning current intensity by analyzing lightning flashes in basalt (c. 1900) and studying the left-over magnetic fields caused by lightning. Discoveries about the electrification of the atmosphere via sensitive electrical instruments and ideas on how the Earth's negative charge is maintained were developed mainly in the 20th century, with CTR Wilson playing an important part. Current research on atmospheric electricity focuses mainly on lightning, particularly high-energy particles and transient luminous events, and the role of non-thunderstorm electrical processes in weather and climate.

Description

Atmospheric electricity is always present, and during fine weather away from thunderstorms, the air above the surface of Earth is positively charged, while the Earth's surface charge is negative. It can be understood in terms of a difference of potential between a point of the Earth's surface, and a point somewhere in the air above it. Because the atmospheric electric field is negatively directed in fair weather, the convention is to refer to the potential gradient, which has the opposite sign and is about 100 V/m at the surface. The potential gradient in most locations is much lower than this value because it is an average of the charge built up by every thunderstorm and atmospheric disturbance around the globe. There is a weak conduction current of atmospheric ions moving in the atmospheric electric field, about 2 picoAmperes per square metre, and the air is weakly conductive due to the presence of these atmospheric ions.

Variations

Global daily cycles in the atmospheric electric field, with a minimum around 03 UT and peaking roughly 16 hours later, were researched by the Carnegie Institution of Washington in the 20th century. This Carnegie curve variation has been described as "the fundamental electrical heartbeat of the planet".

Even away from thunderstorms, atmospheric electricity can be highly variable, but, generally, the electric field is enhanced in fogs and dust whereas the atmospheric electrical conductivity is diminished.

Links with biology

The atmospheric potential gradient leads to an ion flow from the positively charged atmosphere to the negatively charged earth surface. Over a flat field on a day with clear skies, the atmospheric potential gradient is approximately 120 V/m. Objects protruding these fields, e.g. flowers and trees, can increase the electric field strength to several kilovolts per meter. These near-surface electrostatic forces are detected by organisms such as the bumblebee to navigate to flowers and the spider to initiate dispersal by ballooning. The atmospheric potential gradient is also thought to affect sub-surface electro-chemistry and microbial processes.

Near space

The electrosphere layer (from tens of kilometers above the surface of the earth to the ionosphere) has a high electrical conductivity and is essentially at a constant electric potential. The ionosphere is the inner edge of the magnetosphere and is the part of the atmosphere that is ionized by solar radiation. (Photoionization is a physical process in which a photon is incident on an atom, ion or molecule, resulting in the ejection of one or more electrons.)

Cosmic radiation

The Earth, and almost all living things on it, are constantly bombarded by radiation from outer space. This radiation primarily consists of positively charged ions from protons to iron and larger nuclei derived sources outside our solar system. This radiation interacts with atoms in the atmosphere to create an air shower of secondary ionising radiation, including X-rays, muons, protons, alpha particles, pions, and electrons. Ionization from this secondary radiation ensures that the atmosphere is weakly conductive, and that the slight current flow from these ions over the Earth's surface balances the current flow from thunderstorms. Ions have characteristic parameters such as mobility, lifetime, and generation rate that vary with altitude.

Thunderstorms and lightning

The potential difference between the ionosphere and the Earth is maintained by thunderstorms, with lightning strikes delivering negative charges from the atmosphere to the ground. 

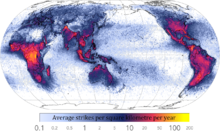
World map showing frequency of lightning strikes, in flashes per km² per year (equal-area projection). Lightning strikes most frequently in the Democratic Republic of the Congo. Combined 1995–2003 data from the Optical Transient Detector and 1998–2003 data from the Lightning Imaging Sensor.
 
Collisions between ice and soft hail (graupel) inside cumulonimbus clouds causes separation of positive and negative charges within the cloud, essential for the generation of lightning. How lightning initially forms is still a matter of debate: Scientists have studied root causes ranging from atmospheric perturbations (wind, humidity, and atmospheric pressure) to the impact of solar wind and energetic particles.

An average bolt of lightning carries a negative electric current of 40 kiloamperes (kA) (although some bolts can be up to 120 kA), and transfers a charge of five coulombs and energy of 500 MJ, or enough energy to power a 100-watt lightbulb for just under two months. The voltage depends on the length of the bolt, with the dielectric breakdown of air being three million volts per meter, and lightning bolts often being several hundred meters long. However, lightning leader development is not a simple matter of dielectric breakdown, and the ambient electric fields required for lightning leader propagation can be a few orders of magnitude less than dielectric breakdown strength. Further, the potential gradient inside a well-developed return-stroke channel is on the order of hundreds of volts per meter or less due to intense channel ionization, resulting in a true power output on the order of megawatts per meter for a vigorous return-stroke current of 100 kA.

If the quantity of water that is condensed in and subsequently precipitated from a cloud is known, then the total energy of a thunderstorm can be calculated. In an average thunderstorm, the energy released amounts to about 10,000,000 kilowatt-hours (3.6×10¹³ joule), which is equivalent to a 20-kiloton nuclear warhead. A large, severe thunderstorm might be 10 to 100 times more energetic.

Lightning sequence (Duration: 0.32 seconds)

Corona discharges

A depiction of atmospheric electricity in a Martian dust storm, which has been suggested as a possible explanation for enigmatic chemistry results from Mars (see also Viking lander biological experiments)
 
St. Elmo's Fire is an electrical phenomenon in which luminous plasma is created by a coronal discharge originating from a grounded object. Ball lightning is often erroneously identified as St. Elmo's Fire, whereas they are separate and distinct phenomena. Although referred to as "fire", St. Elmo's Fire is, in fact, plasma, and is observed, usually during a thunderstorm, at the tops of trees, spires or other tall objects, or on the heads of animals, as a brush or star of light. 

Corona is caused by the electric field around the object in question ionizing the air molecules, producing a faint glow easily visible in low-light conditions. Approximately 1,000 – 30,000 volts per centimetre is required to induce St. Elmo's Fire; however, this is dependent on the geometry of the object in question. Sharp points tend to require lower voltage levels to produce the same result because electric fields are more concentrated in areas of high curvature, thus discharges are more intense at the end of pointed objects. St. Elmo's Fire and normal sparks both can appear when high electrical voltage affects a gas. St. Elmo's fire is seen during thunderstorms when the ground below the storm is electrically charged, and there is high voltage in the air between the cloud and the ground. The voltage tears apart the air molecules and the gas begins to glow. The nitrogen and oxygen in the Earth's atmosphere causes St. Elmo's Fire to fluoresce with blue or violet light; this is similar to the mechanism that causes neon signs to glow.

Earth-Ionosphere cavity

The Schumann resonances are a set of spectrum peaks in the extremely low frequency (ELF) portion of the Earth's electromagnetic field spectrum. Schumann resonance is due to the space between the surface of the Earth and the conductive ionosphere acting as a waveguide. The limited dimensions of the earth cause this waveguide to act as a resonant cavity for electromagnetic waves. The cavity is naturally excited by energy from lightning strikes.

Electrical system grounding

Atmospheric charges can cause undesirable, dangerous, and potentially lethal charge potential buildup in suspended electric wire power distribution systems. Bare wires suspended in the air spanning many kilometers and isolated from the ground can collect very large stored charges at high voltage, even when there is no thunderstorm or lightning occurring. This charge will seek to discharge itself through the path of least insulation, which can occur when a person reaches out to activate a power switch or to use an electric device.

To dissipate atmospheric charge buildup, one side of the electrical distribution system is connected to the earth at many points throughout the distribution system, as often as on every support pole. The one earth-connected wire is commonly referred to as the "protective earth", and provides path for the charge potential to dissipate without causing damage, and provides redundancy in case any one of the ground paths is poor due to corrosion or poor ground conductivity. The additional electric grounding wire that carries no power serves a secondary role, providing a high-current short-circuit path to rapidly blow fuses and render a damaged device safe, rather than have an ungrounded device with damaged insulation become "electrically live" via the grid power supply, and hazardous to touch.

Each transformer in an alternating current distribution grid segments the grounding system into a new separate circuit loop. These separate grids must also be grounded on one side to prevent charge buildup within them relative to the rest of the system, and which could cause damage from charge potentials discharging across the transformer coils to the other grounded side of the distribution network.

Operator (computer programming)

From Wikipedia, the free encyclopedia https://en.wikipedia.org/wiki/Operator_(computer_programmin...