From Wikipedia, the free encyclopedia
Evidence of common descent of living organisms has been discovered by scientists researching in a variety of disciplines over many decades, demonstrating the common descent of all life on Earth developing from a last universal ancestor. This evidence constructs the theoretical framework on which evolutionary theory rests, demonstrates that evolution does occur, and is able to show the natural processes that led to the emergence of Earth's biodiversity. Additionally, this evidence supports the modern evolutionary synthesis—the current scientific theory that explains how and why life changes over time. Evolutionary biologists document evidence of common descent by developing testable predictions, testing hypotheses, and constructing theories that illustrate and describe its causes.
Comparison of the DNA genetic sequences of organisms has revealed that organisms that are phylogenetically close have a higher degree of DNA sequence similarity than organisms that are phylogenetically distant. Genetic fragments such as pseudogenes, regions of DNA that are orthologous to a gene in a related organism, but are no longer active and appear to be undergoing a steady process of degeneration from cumulative mutations support common descent alongside the universal biochemical organization and molecular variance patterns found in all organisms. Additional genetic information conclusively supports the relatedness of life and has allowed scientists (since the discovery of DNA) to develop phylogenetic trees: a construction of organisms evolutionary relatedness. It has also led to the development of molecular clock techniques to date taxon divergence times and to calibrate these with the fossil record.
Fossils are important for estimating when various lineages developed in geologic time. As fossilization is an uncommon occurrence, usually requiring hard body parts and death near a site where sediments are being deposited, the fossil record only provides sparse and intermittent information about the evolution of life. Evidence of organisms prior to the development of hard body parts such as shells, bones and teeth is especially scarce, but exists in the form of ancient microfossils, as well as impressions of various soft-bodied organisms. The comparative study of the anatomy of groups of animals shows structural features that are fundamentally similar (homologous), demonstrating phylogenetic and ancestral relationships with other organisms, most especially when compared with fossils of ancient extinct organisms. Vestigial structures and comparisons in embryonic development are largely a contributing factor in anatomical resemblance in concordance with common descent. Since metabolic processes do not leave fossils, research into the evolution of the basic cellular processes is done largely by comparison of existing organisms' physiology and biochemistry. Many lineages diverged at different stages of development, so it is possible to determine when certain metabolic processes appeared by comparing the traits of the descendants of a common ancestor.
Further evidence comes from the field of biogeography because evolution with common descent provides the best and most thorough explanation for a variety of facts concerning the geographical distribution of plants and animals across the world. This is especially obvious in the field of insular biogeography. Combined with the well-established geological theory of plate tectonics, common descent provides a way to combine facts about the current distribution of species with evidence from the fossil record to provide a logically consistent explanation of how the distribution of living organisms has changed over time.
The development and spread of antibiotic resistant bacteria provides evidence that evolution due to natural selection is an ongoing process in the natural world. Natural selection is ubiquitous in all research pertaining to evolution, taking note of the fact that all of the following examples in each section of the article document the process. Alongside this are observed instances of the separation of populations of species into sets of new species (speciation). Speciation has been observed directly and indirectly in the lab and in nature. Multiple forms of such have been described and documented as examples for individual modes of speciation. Furthermore, evidence of common descent extends from direct laboratory experimentation with the selective breeding of organisms—historically and currently—and other controlled experiments involving many of the topics in the article. This article summarizes the varying disciplines that provide the evidence for evolution and the common descent of all life on Earth, accompanied by numerous and specialized examples, indicating a compelling concordance of evidence.
Evidence from comparative physiology and biochemistry
-4500 —
–
-4000 —
–
-3500 —
–
-3000 —
–
-2500 —
–
-2000 —
–
-1500 —
–
-1000 —
–
-500 —
–
0 —
Axis scale: millions of years.
Orange labels: known ice ages.
Also see: Human timeline and Nature timeline
Orange labels: known ice ages.
Also see: Human timeline and Nature timeline
Genetics
One of the strongest evidences for common descent comes from the study of gene sequences. Comparative sequence analysis examines the relationship between the DNA sequences of different species,[1] producing several lines of evidence that confirm Darwin's original hypothesis of common descent. If the hypothesis of common descent is true, then species that share a common ancestor inherited that ancestor's DNA sequence, as well as mutations unique to that ancestor. More closely related species have a greater fraction of identical sequence and shared substitutions compared to more distantly related species.
Figure 1a: While on board HMS Beagle, Charles Darwin collected numerous specimens, many new to science, which supported his later theory of evolution by natural selection.
The simplest and most powerful evidence is provided by phylogenetic reconstruction. Such reconstructions, especially when done using slowly evolving protein sequences, are often quite robust and can be used to reconstruct a great deal of the evolutionary history of modern organisms (and even in some instances of the evolutionary history of extinct organisms, such as the recovered gene sequences of mammoths or Neanderthals). These reconstructed phylogenies recapitulate the relationships established through morphological and biochemical studies. The most detailed reconstructions have been performed on the basis of the mitochondrial genomes shared by all eukaryotic organisms, which are short and easy to sequence; the broadest reconstructions have been performed either using the sequences of a few very ancient proteins or by using ribosomal RNA sequence[citation needed].
Phylogenetic relationships also extend to a wide variety of nonfunctional sequence elements, including repeats, transposons, pseudogenes, and mutations in protein-coding sequences that do not result in changes in amino-acid sequence. While a minority of these elements might later be found to harbor function, in aggregate they demonstrate that identity must be the product of common descent rather than common function[citation needed].
Universal biochemical organisation and molecular variance patterns
All known extant (surviving) organisms are based on the same biochemical processes: genetic information encoded as nucleic acid (DNA, or RNA for many viruses), transcribed into RNA, then translated into proteins (that is, polymers of amino acids) by highly conserved ribosomes. Perhaps most tellingly, the Genetic Code (the "translation table" between DNA and amino acids) is the same for almost every organism, meaning that a piece of DNA in a bacterium codes for the same amino acid as in a human cell. ATP is used as energy currency by all extant life. A deeper understanding of developmental biology shows that common morphology is, in fact, the product of shared genetic elements.[2] For example, although camera-like eyes are believed to have evolved independently on many separate occasions,[3] they share a common set of light-sensing proteins (opsins), suggesting a common point of origin for all sighted creatures.[4][5] Another noteworthy example is the familiar vertebrate body plan, whose structure is controlled by the homeobox (Hox) family of genes.DNA sequencing
Comparison of the DNA sequences allows organisms to be grouped by sequence similarity, and the resulting phylogenetic trees are typically congruent with traditional taxonomy, and are often used to strengthen or correct taxonomic classifications. Sequence comparison is considered a measure robust enough to correct erroneous assumptions in the phylogenetic tree in instances where other evidence is scarce. For example, neutral human DNA sequences are approximately 1.2% divergent (based on substitutions) from those of their nearest genetic relative, the chimpanzee, 1.6% from gorillas, and 6.6% from baboons.[6][7] Genetic sequence evidence thus allows inference and quantification of genetic relatedness between humans and other apes.[8][9] The sequence of the 16S ribosomal RNA gene, a vital gene encoding a part of the ribosome, was used to find the broad phylogenetic relationships between all extant life. The analysis, originally done by Carl Woese, resulted in the three-domain system, arguing for two major splits in the early evolution of life. The first split led to modern Bacteria and the subsequent split led to modern Archaea and Eukaryotes.Some DNA sequences are shared by very different organisms. It has been predicted by the theory of evolution that the differences in such DNA sequences between two organisms should roughly resemble both the biological difference between them according to their anatomy and the time that had passed since these two organisms have separated in the course of evolution, as seen in fossil evidence. The rate of accumulating such changes should be low for some sequences, namely those that code for critical RNA or proteins, and high for others that code for less critical RNA or proteins; but for every specific sequence, the rate of change should be roughly constant over time. These results have been experimentally confirmed. Two examples are DNA sequences coding for rRNA, which is highly conserved, and DNA sequences coding for fibrinopeptides (amino acid chains that are discarded during the formation of fibrin), which are highly non-conserved.[10]
Proteins
The proteomic evidence also supports the universal ancestry of life. Vital proteins, such as the ribosome, DNA polymerase, and RNA polymerase, are found in everything from the most primitive bacteria to the most complex mammals. The core part of the protein is conserved across all lineages of life, serving similar functions. Higher organisms have evolved additional protein subunits, largely affecting the regulation and protein-protein interaction of the core. Other overarching similarities between all lineages of extant organisms, such as DNA, RNA, amino acids, and the lipid bilayer, give support to the theory of common descent. Phylogenetic analyses of protein sequences from various organisms produce similar trees of relationship between all organisms.[11] The chirality of DNA, RNA, and amino acids is conserved across all known life. As there is no functional advantage to right- or left-handed molecular chirality, the simplest hypothesis is that the choice was made randomly by early organisms and passed on to all extant life through common descent. Further evidence for reconstructing ancestral lineages comes from junk DNA such as pseudogenes, "dead" genes that steadily accumulate mutations.[12]Pseudogenes
Pseudogenes, also known as noncoding DNA, are extra DNA in a genome that do not get transcribed into RNA to synthesize proteins. Some of this noncoding DNA has known functions, but much of it has no known function and is called "Junk DNA".[citation needed] This is an example of a vestige since replicating these genes uses energy, making it a waste in many cases. A pseudogene can be produced when a coding gene accumulates mutations that prevent it from being transcribed, making it non-functional.[citation needed] But since it is not transcribed, it may disappear without affecting fitness, unless it has provided some beneficial function as non-coding DNA.[citation needed] Non-functional pseudogenes may be passed on to later species, thereby labeling the later species as descended from the earlier species.Other mechanisms
There is also a large body of molecular evidence for a number of different mechanisms for large evolutionary changes, among them: genome and gene duplication, which facilitates rapid evolution by providing substantial quantities of genetic material under weak or no selective constraints; horizontal gene transfer, the process of transferring genetic material to another cell that is not an organism's offspring, allowing for species to acquire beneficial genes from each other; and recombination, capable of reassorting large numbers of different alleles and of establishing reproductive isolation. The Endosymbiotic theory explains the origin of mitochondria and plastids (e.g. chloroplasts), which are organelles of eukaryotic cells, as the incorporation of an ancient prokaryotic cell into ancient eukaryotic cell. Rather than evolving eukaryotic organelles slowly, this theory offers a mechanism for a sudden evolutionary leap by incorporating the genetic material and biochemical composition of a separate species. Evidence supporting this mechanism has been found in the protist Hatena: as a predator it engulfs a green algae cell, which subsequently behaves as an endosymbiont, nourishing Hatena, which in turn loses its feeding apparatus and behaves as an autotroph.[13][14]Since metabolic processes do not leave fossils, research into the evolution of the basic cellular processes is done largely by comparison of existing organisms. Many lineages diverged when new metabolic processes appeared, and it is theoretically possible to determine when certain metabolic processes appeared by comparing the traits of the descendants of a common ancestor or by detecting their physical manifestations. As an example, the appearance of oxygen in the earth's atmosphere is linked to the evolution of photosynthesis.
Specific examples from comparative physiology and biochemistry
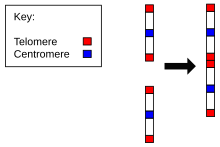
Chromosome 2 in humans
Figure 1b:Fusion of ancestral chromosomes left distinctive remnants of telomeres, and a vestigial centromere
Evidence for the evolution of Homo sapiens from a common ancestor with chimpanzees is found in the number of chromosomes in humans as compared to all other members of Hominidae. All hominidae have 24 pairs of chromosomes, except humans, who have only 23 pairs. Human chromosome 2 is a result of an end-to-end fusion of two ancestral chromosomes.[15][16]
The evidence for this includes:
- The correspondence of chromosome 2 to two ape chromosomes. The closest human relative, the common chimpanzee, has near-identical DNA sequences to human chromosome 2, but they are found in two separate chromosomes. The same is true of the more distant gorilla and orangutan.[17][18]
- The presence of a vestigial centromere. Normally a chromosome has just one centromere, but in chromosome 2 there are remnants of a second centromere.[19]
- The presence of vestigial telomeres. These are normally found only at the ends of a chromosome, but in chromosome 2 there are additional telomere sequences in the middle.[20]
Cytochrome c and b
A classic example of biochemical evidence for evolution is the variance of the ubiquitous (i.e. all living organisms have it, because it performs very basic life functions) protein Cytochrome c in living cells. The variance of cytochrome c of different organisms is measured in the number of differing amino acids, each differing amino acid being a result of a base pair substitution, a mutation. If each differing amino acid is assumed the result of one base pair substitution, it can be calculated how long ago the two species diverged by multiplying the number of base pair substitutions by the estimated time it takes for a substituted base pair of the cytochrome c gene to be successfully passed on. For example, if the average time it takes for a base pair of the cytochrome c gene to mutate is N years, the number of amino acids making up the cytochrome c protein in monkeys differ by one from that of humans, this leads to the conclusion that the two species diverged N years ago.The primary structure of cytochrome c consists of a chain of about 100 amino acids. Many higher order organisms possess a chain of 104 amino acids.[21]
The cytochrome c molecule has been extensively studied for the glimpse it gives into evolutionary biology. Both chicken and turkeys have identical sequence homology (amino acid for amino acid), as do pigs, cows and sheep. Both humans and chimpanzees share the identical molecule, while rhesus monkeys share all but one of the amino acids:[22] the 66th amino acid is isoleucine in the former and threonine in the latter.[21]
What makes these homologous similarities particularly suggestive of common ancestry in the case of cytochrome c, in addition to the fact that the phylogenies derived from them match other phylogenies very well, is the high degree of functional redundancy of the cytochrome c molecule. The different existing configurations of amino acids do not significantly affect the functionality of the protein, which indicates that the base pair substitutions are not part of a directed design, but the result of random mutations that aren't subject to selection.[23]
In addition, Cytochrome b is commonly used as a region of mitochondrial DNA to determine phylogenetic relationships between organisms due to its sequence variability. It is considered most useful in determining relationships within families and genera. Comparative studies involving cytochrome b have resulted in new classification schemes and have been used to assign newly described species to a genus, as well as deepen the understanding of evolutionary relationships.[24]
Endogenous retroviruses
Endogenous retroviruses (or ERVs) are remnant sequences in the genome left from ancient viral infections in an organism. The retroviruses (or virogenes) are always passed on to the next generation of that organism that received the infection. This leaves the virogene left in the genome. Because this event is rare and random, finding identical chromosomal positions of a virogene in two different species suggests common ancestry.[25] Cats (Felidae) present a notable instance of virogene sequences demonstrating common descent. The standard phylogenetic tree for Felidae have smaller cats (Felis chaus, Felis silvestris, Felis nigripes, and Felis catus) diverging from larger cats such as the subfamily Pantherinae and other carnivores. The fact that small cats have an ERV where the larger cats do not suggests that the gene was inserted into the ancestor of the small cats after the larger cats had diverged.[26] Another example of this is with humans and chimps. Humans contain numerous ERVs that comprise a considerable percentage of the genome. Sources vary, however, 1%[27] to 8%[28] has been proposed. Humans and chimps share seven different occurrences of virogenes, while all primates share similar retroviruses congruent with phylogeny.[29]Recent African origin of modern humans
Mathematical models of evolution, pioneered by the likes of Sewall Wright, Ronald Fisher and J. B. S. Haldane and extended via diffusion theory by Motoo Kimura, allow predictions about the genetic structure of evolving populations. Direct examination of the genetic structure of modern populations via DNA sequencing has allowed verification of many of these predictions. For example, the Out of Africa theory of human origins, which states that modern humans developed in Africa and a small sub-population migrated out (undergoing a population bottleneck), implies that modern populations should show the signatures of this migration pattern. Specifically, post-bottleneck populations (Europeans and Asians) should show lower overall genetic diversity and a more uniform distribution of allele frequencies compared to the African population. Both of these predictions are borne out by actual data from a number of studies.[30]Evidence from comparative anatomy
Comparative study of the anatomy of groups of animals or plants reveals that certain structural features are basically similar. For example, the basic structure of all flowers consists of sepals, petals, stigma, style and ovary; yet the size, colour, number of parts and specific structure are different for each individual species. The neural anatomy of fossilized remains may also be compared using advanced imaging techniques.[31]Atavisms
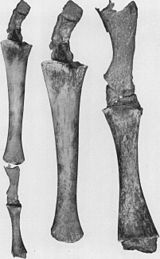
Figure 2a: In July 1919, a humpback whale was caught by a ship operating out of Vancouver that had legs 4 ft 2 in (1.27 m) long.[32] This image shows the hindlegs of another humpback whale reported in 1921 by the American Museum.
Once thought of as a refutation to evolutionary theory, atavisms are "now seen as potent evidence of how much genetic potential is retained...after a particular structure has disappeared from a species".[33] "Atavisms are the reappearance of a lost character typical of remote ancestors and not seen in the parents or recent ancestors..."[34] and are an "[indication] of the developmental plasticity that exists within embryos..."[34] Atavisms occur because genes for previously existing phenotypical features are often preserved in DNA, even though the genes are not expressed in some or most of the organisms possessing them.[35] Numerous examples have documented the occurrence of atavisms alongside experimental research triggering their formation. Due to the complexity and interrelatedness of the factors involved in the development of atavisms, both biologists and medical professionals find it "difficult, if not impossible, to distinguish [them] from malformations."[36]
Some examples of atavisms found in the scientific literature include:
- Hind limbs in whales.[34] (see figure 2a)
- Reappearance of limbs in limbless vertebrates.[33][34][37]
- Back pair of flippers on a bottlenose dolphin.[38]
- Extra toes of the modern horse.[34][39][40]
- Human tails (not pseudo-tails)[36][41] and extra nipples in humans.[34]
- Re-evolution of sexuality from parthenogenesis in orbitid mites.[42]
- Teeth in chickens.[43]
- Dewclaws in dogs.[34]
- Reappearance of wings on wingless stick insects[44] and earwigs.[34]
- Atavistic muscles in several birds[45][46] and mammals such as the beagle[47] and the jerboa.[45]
- Extra toes in guinea pigs.[34][48]
Evolutionary developmental biology and embryonic development
Evolutionary developmental biology is the biological field that compares the developmental process of different organisms to determine ancestral relationships between species. A large variety of organism's genomes contain a small fraction of genes that control the organisms development. Hox genes are an example of these types of nearly universal genes in organisms pointing to an origin of common ancestry. Embryological evidence comes from the development of organisms at the embryological level with the comparison of different organisms embryos similarity. Remains of ancestral traits often appear and disappear in different stages of the embryological development process. Examples include such as hair growth and loss (lanugo) during human development;[49] development and degeneration of a yolk sac; terrestrial frogs and salamanders passing through the larval stage within the egg—with features of typically aquatic larvae—but hatch ready for life on land;[50] and the appearance of gill-like structures (pharyngeal arch) in vertebrate embryo development. Note that in fish, the arches continue to develop as branchial arches while in humans, for example, they give rise to a variety of structures within the head and neck.Homologous structures and divergent (adaptive) evolution
If widely separated groups of organisms are originated from a common ancestry, they are expected to have certain basic features in common. The degree of resemblance between two organisms should indicate how closely related they are in evolution:- Groups with little in common are assumed to have diverged from a common ancestor much earlier in geological history than groups with a lot in common;
- In deciding how closely related two animals are, a comparative anatomist looks for structures that are fundamentally similar, even though they may serve different functions in the adult. Such structures are described as homologous and suggest a common origin.
- In cases where the similar structures serve different functions in adults, it may be necessary to trace their origin and embryonic development. A similar developmental origin suggests they are the same structure, and thus likely derived from a common ancestor.
Nested hierarchies and classification
Taxonomy is based on the fact that all organisms are related to each other in nested hierarchies based on shared characteristics. Most existing species can be organized rather easily in a nested hierarchical classification. This is evident from the Linnaean classification scheme. Based on shared derived characters, closely related organisms can be placed in one group (such as a genus), several genera can be grouped together into one family, several families can be grouped together into an order, etc.[51] The existence of these nested hierarchies was recognized by many biologists before Darwin, but he showed that his theory of evolution with its branching pattern of common descent could explain them.[51][52] Darwin described how common descent could provide a logical basis for classification:[53]| “ | All the foregoing rules and aids and difficulties in classification are explained, if I do not greatly deceive myself, on the view that the natural system is founded on descent with modification; that the characters which naturalists consider as showing true affinity between any two or more species, are those which have been inherited from a common parent, and, in so far, all true classification is genealogical; that community of descent is the hidden bond which naturalists have been unconsciously seeking, ... | ” |
| — Charles Darwin, On the Origin of Species, page 577 | ||
Evolutionary trees
An evolutionary tree (of Amniota, for example, the last common ancestor of mammals and reptiles, and all its descendants) illustrates the initial conditions causing evolutionary patterns of similarity (e.g., all Amniotes produce an egg that possesses the amnios) and the patterns of divergence amongst lineages (e.g., mammals and reptiles branching from the common ancestry in Amniota). Evolutionary trees provide conceptual models of evolving systems once thought limited in the domain of making predictions out of the theory.[54] However, the method of phylogenetic bracketing is used to infer predictions with far greater probability than raw speculation. For example, paleontologists use this technique to make predictions about nonpreservable traits in fossil organisms, such as feathered dinosaurs, and molecular biologists use the technique to posit predictions about RNA metabolism and protein functions.[55][56] Thus evolutionary trees are evolutionary hypotheses that refer to specific facts, such as the characteristics of organisms (e.g., scales, feathers, fur), providing evidence for the patterns of descent, and a causal explanation for modification (i.e., natural selection or neutral drift) in any given lineage (e.g., Amniota). Evolutionary biologists test evolutionary theory using phylogenetic systematic methods that measure how much the hypothesis (a particular branching pattern in an evolutionary tree) increases the likelihood of the evidence (the distribution of characters among lineages).[57][58][59] The severity of tests for a theory increases if the predictions "are the least probable of being observed if the causal event did not occur."[60] "Testability is a measure of how much the hypothesis increases the likelihood of the evidence."[61]Vestigial structures
Evidence for common descent comes from the existence of vestigial structures.[62] These rudimentary structures are often homologous to structures that correspond in related or ancestral species. A wide range of structures exist such as mutated and non-functioning genes, parts of a flower, muscles, organs, and even behaviors. This variety can be found across many different groups of species. In many cases they are degenerated or underdeveloped. The existence of vestigial organs can be explained in terms of changes in the environment or modes of life of the species. Those organs are typically functional in the ancestral species but are now either semi-functional, nonfunctional, or re-purposed.Scientific literature concerning vestigial structures abounds. One study complied 64 examples of vestigial structures found in the literature across a wide range of disciplines within the 21st century.[63] The following non-exhaustive list summarizes Senter et al. alongside various other examples:
- The presence of remnant mitochondria (mitosomes) that have lost the ability to synthesize ATP in Entamoeba histolytica, Trachipleistophora hominis, Cryptosporidium parvum, Blastocystis hominis, and Giardia intestinalis.[64]
- Remnant chloroplast organelles (leucoplasts) in non-photosynthetic algae species (Plasmodium falciparum, Toxoplasma gondii, Aspasia longa, Anthophysa vegetans, Ciliophrys infusionum, Pteridomonas danica, Paraphysomonas, Spumella and Epifagus americana.[65]
- Missing stamens (unvascularized staminodes) on Gilliesia and Gethyum flowers.[66]
- Non-functioning androecium in female flowers and non-functioning gynoecium in male flowers of the cactus species Consolea spinosissima.[67]
- Remnant stamens on female flowers of Fragaria virginiana;[68] all species in the genus Schiedea;[69] and on Penstemon centranthifolius, P. rostriflorus, P. ellipticus, and P. palmeri.[70]
- Vestigial anthers on Nemophila menziesii.[71]
Figure 2b: Skeleton of a Baleen whale
with the hind limb and pelvic bone structure circled in red. This bone
structure stays internal during the entire life of the species.
- Reduced hindlimbs and pelvic girdle embedded in the muscles of extant whales (see figure 2b).[72][73][74][75] Occasionally, the genes that code for longer extremities cause a modern whale to develop legs. On October 28, 2006, a four-finned bottlenose dolphin was caught and studied due to its extra set of hind limbs.[76] These legged Cetacea display an example of an atavism predicted from their common ancestry.
- Nonfunctional hind wings in Carabus solieri[77] and other beetles.[73]
- Remnant eyes (and eye structures) in animals that have lost sight such as blind cavefish (e.g. Astyanax mexicanus),[78] mole rats, snakes, spiders, salamanders, shrimp, crayfish, and beetles.[79][80]
- Vestigial eye in the extant Rhineura floridana and remnant jugal in the extinct Rhineura hatchery (reclassified as Protorhineura hatcherii).[81][82]
- Functionless wings in flightless birds such as ostriches, kiwis, cassowaries, and emus.[83][84]
- The presence of the plica semilunaris in the human eye—a vestigial remnant of the nictitating membrane.[85]
- Harderian gland in primates.[86]
- Reduced hind limbs and pelvic girdle structures in legless lizards, skinks,[87] amphisbaenians, and some snakes.[88][89]
- Reduced and missing olfactory apparatus in whales that still possess vestigial olfactory receptor subgenomes.[90]
- Vestigial teeth in Narwhal.[91]
- Rudimentary digits of Ateles geoffroyi, Colobus guereza, and Perodicticus potto.[92]
- Vestigial dental primordia in the embryonic tooth pattern in mice.[93]
- Reduced or absent vomeronasal organ in humans and Old World monkeys.[94][95]
- Presence of non-functional sinus hair muscles in humans used in whisker movement.[96]
- Degenerating palmaris longus muscle in humans.[97]
- Teleost fish, anthropoid primates (Simians), guinea pigs, some bat species, and some Passeriformes have lost the ability to synthesize vitamin C (ascorbic acid), yet still possess the genes involved. This inability is due to mutations of the L-gulono-γ-lactone oxidase (GLO) gene— and in primates, teleost fish, and guinea pigs it is irreversible.[98]
- Remnant abdominal segments in cirripedes (barnacles).[99]
- Non-mammalian vertebrate embryos depend on nutrients from the yolk sac. Humans and other mammal genomes contain broken, non-functioning genes that code for the production of yolk. alongside the presence of an empty yolk sac with the embryo.[100][101][102]
- Dolphin embryonic limb buds.[103]
- Leaf formation in some cacti species.[104]
- Presence of a vestigial endosymbiont Lepidodinium viride within the dinoflagellate Gymnodinium chlorophorum.[105]
- The species Dolabrifera dolabrifera has an ink gland but is "incapable of producing ink or its associated anti-predator proteins".[106]
Specific examples from comparative anatomy
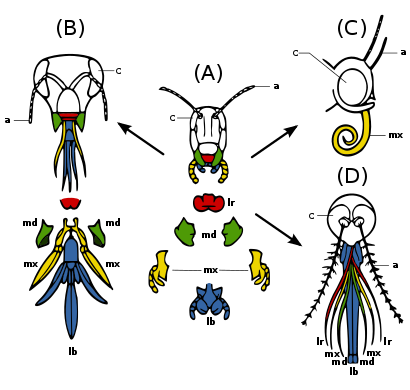
Figure 2c: Adaptation of insect mouthparts: a, antennae; c, compound eye; lb, labrium; lr, labrum; md, mandibles; mx, maxillae.
(A) Primitive state — biting and chewing: e.g. grasshopper. Strong mandibles and maxillae for manipulating food.
(B) Ticking and biting: e.g. honey bee. Labium long to lap up nectar; mandibles chew pollen and mould wax.
(C) Sucking: e.g. butterfly. Labrum reduced; mandibles lost; maxillae long forming sucking tube.
(D) Piercing and sucking, e.g.. female mosquito. Labrum and maxillae form tube; mandibles form piercing stylets; labrum grooved to hold other parts.
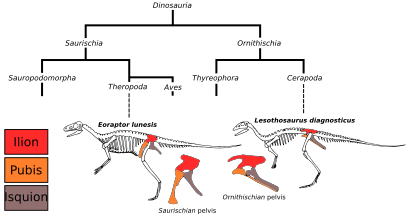
Figure 2d: Illustration of the Eoraptor lunensis pelvis of the saurischian order and the Lesothosaurus diagnosticus pelvis of the ornithischian order in the Dinosauria superorder. The parts of the pelvis show modification over time. The cladogram is shown to illustrate the distance of divergence between the two species.
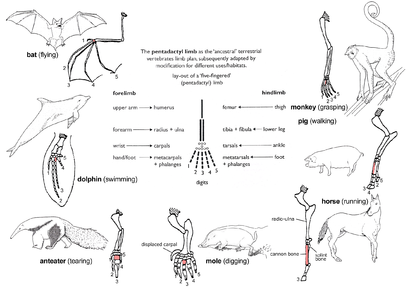
Figure 2e: The principle of homology
illustrated by the adaptive radiation of the forelimb of mammals. All
conform to the basic pentadactyl pattern but are modified for different
usages. The third metacarpal is shaded throughout; the shoulder is
crossed-hatched.
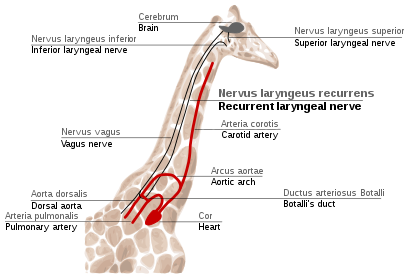
Figure 2f: The path
of the recurrent laryngeal nerve in giraffes. The laryngeal nerve is
compensated for by subsequent tinkering from natural selection.
Insect mouthparts and appendages
Many different species of insects have mouthparts derived from the same embryonic structures, indicating that the mouthparts are modifications of a common ancestor's original features. These include a labrum (upper lip), a pair of mandibles, a hypopharynx (floor of mouth), a pair of maxillae, and a labium. (Fig. 2c) Evolution has caused enlargement and modification of these structures in some species, while it has caused the reduction and loss of them in other species. The modifications enable the insects to exploit a variety of food materials.Insect mouthparts and antennae are considered homologues of insect legs. Parallel developments are seen in some arachnids: The anterior pair of legs may be modified as analogues of antennae, particularly in whip scorpions, which walk on six legs. These developments provide support for the theory that complex modifications often arise by duplication of components, with the duplicates modified in different directions.
Pelvic structure of dinosaurs
Similar to the pentadactyl limb in mammals, the earliest dinosaurs split into two distinct orders—the saurischia and ornithischia. They are classified as one or the other in accordance with what the fossils demonstrate. Figure 2d, shows that early saurischians resembled early ornithischians. The pattern of the pelvis in all species of dinosaurs is an example of homologous structures. Each order of dinosaur has slightly differing pelvis bones providing evidence of common descent. Additionally, modern birds show a similarity to ancient saurischian pelvic structures indicating the evolution of birds from dinosaurs. This can also be seen in Figure 5c as the Aves branch off the Theropoda suborder.Pentadactyl limb
The pattern of limb bones called pentadactyl limb is an example of homologous structures (Fig. 2e). It is found in all classes of tetrapods (i.e. from amphibians to mammals). It can even be traced back to the fins of certain fossil fishes from which the first amphibians evolved such as tiktaalik. The limb has a single proximal bone (humerus), two distal bones (radius and ulna), a series of carpals (wrist bones), followed by five series of metacarpals (palm bones) and phalanges (digits). Throughout the tetrapods, the fundamental structures of pentadactyl limbs are the same, indicating that they originated from a common ancestor. But in the course of evolution, these fundamental structures have been modified. They have become superficially different and unrelated structures to serve different functions in adaptation to different environments and modes of life. This phenomenon is shown in the forelimbs of mammals. For example:- In monkeys, the forelimbs are much elongated, forming a grasping hand used for climbing and swinging among trees.
- Pigs have lost their first digit, while the second and fifth digits are reduced. The remaining two digits are longer and stouter than the rest and bear a hoof for supporting the body.
- In horses, the forelimbs are highly adapted for strength and support. Fast and long-distance running is possible due to the extensive elongation of the third digit that bears a hoof.
- The mole has a pair of short, spade-like forelimbs for burrowing.
- Anteaters use their enlarged third digit for tearing into ant and termite nests.
- In cetaceans, the forelimbs become flippers for steering and maintaining equilibrium during swimming.
- In bats, the forelimbs have become highly modified and evolved into functioning wings. Four digits have become elongated, while the hook-like first digit remains free and is used to hang upside down.
Recurrent laryngeal nerve in giraffes
The recurrent laryngeal nerve is a fourth branch of the vagus nerve, which is a cranial nerve. In mammals, its path is unusually long. As a part of the vagus nerve, it comes from the brain, passes through the neck down to heart, rounds the dorsal aorta and returns up to the larynx, again through the neck. (Fig. 2f)This path is suboptimal even for humans, but for giraffes it becomes even more suboptimal. Due to the lengths of their necks, the recurrent laryngeal nerve may be up to 4 m (13 ft) long, despite its optimal route being a distance of just several inches.
The indirect route of this nerve is the result of evolution of mammals from fish, which had no neck and had a relatively short nerve that innervated one gill slit and passed near the gill arch. Since then, the gill it innervated has become the larynx and the gill arch has become the dorsal aorta in mammals.[107][108]
Route of the vas deferens
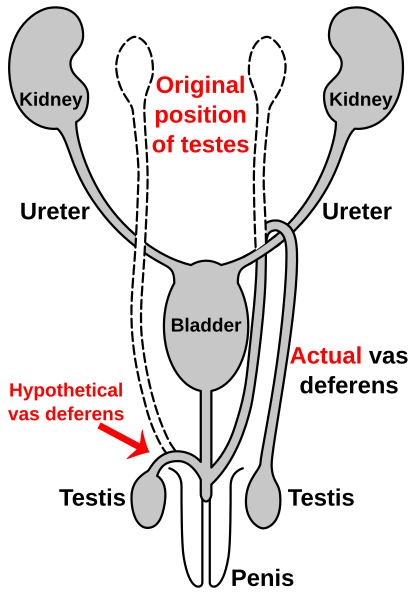
Similar to the laryngeal nerve in giraffes, the vas deferens is part of the male anatomy of many vertebrates; it transports sperm from the epididymis in anticipation of ejaculation. In humans, the vas deferens routes up from the testicle, looping over the ureter, and back down to the urethra and penis. It has been suggested that this is due to the descent of the testicles during the course of human evolution—likely associated with temperature. As the testicles descended, the vas deferens lengthened to accommodate the accidental "hook" over the ureter.[108][109]Evidence from paleontology
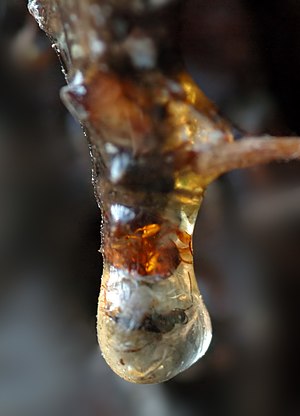
Figure 3a: An insect trapped in amber
Figure 3b: Fossil trilobite, Kainops invius from the early Devonian. Trilobites were hard-shelled arthropods, related to living horseshoe crabs and spiders, that first appeared in significant numbers around 540 mya, dying out 250 mya.
Figure 3c: Cynognathus (skull), a Eucynodont, one of a grouping of Therapsids ("mammal-like reptiles") that is ancestral to all modern mammals.
Figure 3d: Charles
Darwin collected fossils in South America, and found fragments of armor
he thought were like giant versions of the scales on the modern armadillos living nearby. The anatomist Richard Owen showed him that the fragments were from gigantic extinct glyptodons, related to the armadillos. This was one of the patterns of distribution that helped Darwin to develop his theory.[110]
When organisms die, they often decompose rapidly or are consumed by scavengers, leaving no permanent evidences of their existence. However, occasionally, some organisms are preserved. The remains or traces of organisms from a past geologic age embedded in rocks by natural processes are called fossils. They are extremely important for understanding the evolutionary history of life on Earth, as they provide direct evidence of evolution and detailed information on the ancestry of organisms. Paleontology is the study of past life based on fossil records and their relations to different geologic time periods.
For fossilization to take place, the traces and remains of organisms must be quickly buried so that weathering and decomposition do not occur. Skeletal structures or other hard parts of the organisms are the most commonly occurring form of fossilized remains. There are also some trace "fossils" showing moulds, cast or imprints of some previous organisms.
As an animal dies, the organic materials gradually decay, such that the bones become porous. If the animal is subsequently buried in mud, mineral salts infiltrate into the bones and gradually fill up the pores. The bones harden into stones and are preserved as fossils. This process is known as petrification. If dead animals are covered by wind-blown sand, and if the sand is subsequently turned into mud by heavy rain or floods, the same process of mineral infiltration may occur. Apart from petrification, the dead bodies of organisms may be well preserved in ice, in hardened resin of coniferous trees (figure 3a), in tar, or in anaerobic, acidic peat. Fossilization can sometimes be a trace, an impression of a form. Examples include leaves and footprints, the fossils of which are made in layers that then harden.
Fossil record
It is possible to decipher how a particular group of organisms evolved by arranging its fossil record in a chronological sequence. Such a sequence can be determined because fossils are mainly found in sedimentary rock. Sedimentary rock is formed by layers of silt or mud on top of each other; thus, the resulting rock contains a series of horizontal layers, or strata. Each layer contains fossils typical for a specific time period when they formed. The lowest strata contain the oldest rock and the earliest fossils, while the highest strata contain the youngest rock and more recent fossils.A succession of animals and plants can also be seen from fossil discoveries. By studying the number and complexity of different fossils at different stratigraphic levels, it has been shown that older fossil-bearing rocks contain fewer types of fossilized organisms, and they all have a simpler structure, whereas younger rocks contain a greater variety of fossils, often with increasingly complex structures.[111]
For many years, geologists could only roughly estimate the ages of various strata and the fossils found. They did so, for instance, by estimating the time for the formation of sedimentary rock layer by layer. Today, by measuring the proportions of radioactive and stable elements in a given rock, the ages of fossils can be more precisely dated by scientists. This technique is known as radiometric dating.
Throughout the fossil record, many species that appear at an early stratigraphic level disappear at a later level. This is interpreted in evolutionary terms as indicating the times when species originated and became extinct. Geographical regions and climatic conditions have varied throughout Earth's history. Since organisms are adapted to particular environments, the constantly changing conditions favoured species that adapted to new environments through the mechanism of natural selection.
Extent of the fossil record
Despite the relative rarity of suitable conditions for fossilization, an estimated 250,000 fossil species have been named.[112] The number of individual fossils this represents varies greatly from species to species, but many millions of fossils have been recovered: for instance, more than three million fossils from the last Ice Age have been recovered from the La Brea Tar Pits in Los Angeles.[113] Many more fossils are still in the ground, in various geological formations known to contain a high fossil density, allowing estimates of the total fossil content of the formation to be made. An example of this occurs in South Africa's Beaufort Formation (part of the Karoo Supergroup, which covers most of South Africa), which is rich in vertebrate fossils, including therapsids (reptile-mammal transitional forms).[114] It has been estimated that this formation contains 800 billion vertebrate fossils.[115] Palentologists have documented numerous transitional forms and have constructed "an astonishingly comprehensive record of the key transitions in animal evolution".[116] Conducting a survey of the paleontological literature, one would find that there is "abundant evidence for how all the major groups of animals are related, much of it in the form of excellent transitional fossils".[116]Limitations
The fossil record is an important source for scientists when tracing the evolutionary history of organisms. However, because of limitations inherent in the record, there are not fine scales of intermediate forms between related groups of species. This lack of continuous fossils in the record is a major limitation in tracing the descent of biological groups. When transitional fossils are found that show intermediate forms in what had previously been a gap in knowledge, they are often popularly referred to as "missing links".There is a gap of about 100 million years between the beginning of the Cambrian period and the end of the Ordovician period. The early Cambrian period was the period from which numerous fossils of sponges, cnidarians (e.g., jellyfish), echinoderms (e.g., eocrinoids), molluscs (e.g., snails) and arthropods (e.g., trilobites) are found. The first animal that possessed the typical features of vertebrates, the Arandaspis, was dated to have existed in the later Ordovician period. Thus few, if any, fossils of an intermediate type between invertebrates and vertebrates have been found, although likely candidates include the Burgess Shale animal, Pikaia gracilens,[117] and its Maotianshan shales relatives, Myllokunmingia, Yunnanozoon, Haikouella lanceolata,[118] and Haikouichthys.[119]
Some of the reasons for the incompleteness of fossil records are:
- In general, the probability that an organism becomes fossilized is very low;
- Some species or groups are less likely to become fossils because they are soft-bodied;
- Some species or groups are less likely to become fossils because they live (and die) in conditions that are not favourable for fossilization;
- Many fossils have been destroyed through erosion and tectonic movements;
- Most fossils are fragmentary;
- Some evolutionary change occurs in populations at the limits of a species' ecological range, and as these populations are likely small, the probability of fossilization is lower (see punctuated equilibrium);
- Similarly, when environmental conditions change, the population of a species is likely to be greatly reduced, such that any evolutionary change induced by these new conditions is less likely to be fossilized;
- Most fossils convey information about external form, but little about how the organism functioned;
- Using present-day biodiversity as a guide, this suggests that the fossils unearthed represent only a small fraction of the large number of species of organisms that lived in the past.
Specific examples from paleontology
Evolution of the horse
Figure 3e: Evolution of the horse
showing reconstruction of the fossil species obtained from successive
rock strata. The foot diagrams are all front views of the left forefoot.
The third metacarpal is shaded throughout. The teeth are shown in longitudinal section.
Due to an almost-complete fossil record found in North American sedimentary deposits from the early Eocene to the present, the horse provides one of the best examples of evolutionary history (phylogeny).
This evolutionary sequence starts with a small animal called Hyracotherium (commonly referred to as Eohippus), which lived in North America about 54 million years ago then spread across to Europe and Asia. Fossil remains of Hyracotherium show it to have differed from the modern horse in three important respects: it was a small animal (the size of a fox), lightly built and adapted for running; the limbs were short and slender, and the feet elongated so that the digits were almost vertical, with four digits in the forelimbs and three digits in the hindlimbs; and the incisors were small, the molars having low crowns with rounded cusps covered in enamel.[120]
The probable course of development of horses from Hyracotherium to Equus (the modern horse) involved at least 12 genera and several hundred species. The major trends seen in the development of the horse to changing environmental conditions may be summarized as follows:
- Increase in size (from 0.4 m to 1.5 m — from 15in to 60in);
- Lengthening of limbs and feet;
- Reduction of lateral digits;
- Increase in length and thickness of the third digit;
- Increase in width of incisors;
- Replacement of premolars by molars; and
- Increases in tooth length, crown height of molars.
Transition from fish to amphibians
Prior to 2004, paleontologists had found fossils of amphibians with necks, ears, and four legs, in rock no older than 365 million years old. In rocks more than 385 million years old they could only find fish, without these amphibian characteristics. Evolutionary theory predicted that since amphibians evolved from fish, an intermediate form should be found in rock dated between 365 and 385 million years ago. Such an intermediate form should have many fish-like characteristics, conserved from 385 million years ago or more, but also have many amphibian characteristics as well. In 2004, an expedition to islands in the Canadian arctic searching specifically for this fossil form in rocks that were 375 million years old discovered fossils of Tiktaalik.[122] Some years later, however, scientists in Poland found evidence of fossilised tetrapod tracks predating Tiktaalik.[123]Evidence from biogeography
Data about the presence or absence of species on various continents and islands (biogeography) can provide evidence of common descent and shed light on patterns of speciation.Continental distribution
All organisms are adapted to their environment to a greater or lesser extent. If the abiotic and biotic factors within a habitat are capable of supporting a particular species in one geographic area, then one might assume that the same species would be found in a similar habitat in a similar geographic area, e.g. in Africa and South America. This is not the case. Plant and animal species are discontinuously distributed throughout the world:- Africa has Old World monkeys, apes, elephants, leopards, giraffes, and hornbills.
- South America has New World monkeys, cougars, jaguars, sloths, llamas, and toucans.
- Deserts in North and South America have native cacti, but deserts in Africa, Asia, and Australia have succulent (apart from Rhipsalis baccifera)[124] which are native euphorbs that resemble cacti but are very different.
Other animal distribution examples include bears, located on all continents excluding Africa, Australia and Antarctica, and the polar bear only located solely in the Arctic Circle and adjacent land masses.[127] Penguins are located only around the South Pole despite similar weather conditions at the North Pole. Families of sirenians are distributed exclusively around the earth's waters, where manatees are located in western Africa waters, northern South American waters, and West Indian waters only while the related family, the dugongs, are located only in Oceanic waters north of Australia, and the coasts surrounding the Indian Ocean Additionally, the now extinct Steller's sea cow resided in the Bering Sea.[128]
The same kinds of fossils are found from areas known to be adjacent to one another in the past but that, through the process of continental drift, are now in widely divergent geographic locations. For example, fossils of the same types of ancient amphibians, arthropods and ferns are found in South America, Africa, India, Australia and Antarctica, which can be dated to the Paleozoic Era, when these regions were united as a single landmass called Gondwana.[129] Sometimes the descendants of these organisms can be identified and show unmistakable similarity to each other, even though they now inhabit very different regions and climates.
Island biogeography
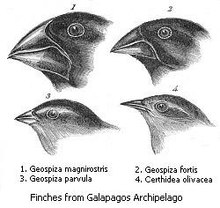
Figure 4a: Four of the 13 finch species found on the Galápagos Archipelago, have evolved by an adaptive radiation that diversified their beak shapes to adapt them to different food sources.
Types of species found on islands
Evidence from island biogeography has played an important and historic role in the development of evolutionary biology. For purposes of biogeography, islands are divided into two classes. Continental islands are islands like Great Britain, and Japan that have at one time or another been part of a continent. Oceanic islands, like the Hawaiian islands, the Galápagos Islands and St. Helena, on the other hand are islands that have formed in the ocean and never been part of any continent. Oceanic islands have distributions of native plants and animals that are unbalanced in ways that make them distinct from the biotas found on continents or continental islands. Oceanic islands do not have native terrestrial mammals (they do sometimes have bats and seals), amphibians, or fresh water fish. In some cases they have terrestrial reptiles (such as the iguanas and giant tortoises of the Galápagos Islands) but often (for example Hawaii) they do not. This despite the fact that when species such as rats, goats, pigs, cats, mice, and cane toads, are introduced to such islands by humans they often thrive. Starting with Charles Darwin, many scientists have conducted experiments and made observations that have shown that the types of animals and plants found, and not found, on such islands are consistent with the theory that these islands were colonized accidentally by plants and animals that were able to reach them. Such accidental colonization could occur by air, such as plant seeds carried by migratory birds, or bats and insects being blown out over the sea by the wind, or by floating from a continent or other island by sea, as for example by some kinds of plant seeds like coconuts that can survive immersion in salt water, and reptiles that can survive for extended periods on rafts of vegetation carried to sea by storms.[130]Endemism
Many of the species found on remote islands are endemic to a particular island or group of islands, meaning they are found nowhere else on earth. Examples of species endemic to islands include many flightless birds of New Zealand, lemurs of Madagascar, the Komodo dragon of Komodo,[131] the dragon's blood tree of Socotra,[132] Tuatara of New Zealand,[133][134] and others. However, many such endemic species are related to species found on other nearby islands or continents; the relationship of the animals found on the Galápagos Islands to those found in South America is a well-known example.[130] All of these facts, the types of plants and animals found on oceanic islands, the large number of endemic species found on oceanic islands, and the relationship of such species to those living on the nearest continents, are most easily explained if the islands were colonized by species from nearby continents that evolved into the endemic species now found there.[130]Other types of endemism do not have to include, in the strict sense, islands. Islands can mean isolated lakes or remote and isolated areas. Examples of these would include the highlands of Ethiopia, Lake Baikal, fynbos of South Africa, forests of New Caledonia, and others. Examples of endemic organisms living in isolated areas include the kagu of New Caledonia,[135] cloud rats of the Luzon tropical pine forests of the Philippines,[136][137] the boojum tree (Fouquieria columnaris) of the Baja California peninsula,[138] the Baikal seal[139] and the omul of Lake Baikal.
Adaptive radiations
Oceanic islands are frequently inhabited by clusters of closely related species that fill a variety of ecological niches, often niches that are filled by very different species on continents. Such clusters, like the finches of the Galápagos, Hawaiian honeycreepers, members of the sunflower family on the Juan Fernandez Archipelago and wood weevils on St. Helena are called adaptive radiations because they are best explained by a single species colonizing an island (or group of islands) and then diversifying to fill available ecological niches. Such radiations can be spectacular; 800 species of the fruit fly family Drosophila, nearly half the world's total, are endemic to the Hawaiian islands. Another illustrative example from Hawaii is the silversword alliance, which is a group of thirty species found only on those islands. Members range from the silverswords that flower spectacularly on high volcanic slopes to trees, shrubs, vines and mats that occur at various elevations from mountain top to sea level, and in Hawaiian habitats that vary from deserts to rainforests. Their closest relatives outside Hawaii, based on molecular studies, are tarweeds found on the west coast of North America. These tarweeds have sticky seeds that facilitate distribution by migrant birds.[140] Additionally, nearly all of the species on the island can be crossed and the hybrids are often fertile,[50] and they have been hybridized experimentally with two of the west coast tarweed species as well.[141] Continental islands have less distinct biota, but those that have been long separated from any continent also have endemic species and adaptive radiations, such as the 75 lemur species of Madagascar, and the eleven extinct moa species of New Zealand.[130][142]Rings species
The biologist Ernst Mayer championed the concept of ring species, claiming that it unequivocally demonstrated the process of speciation.[143] A ring species is an alternative model to allopatric speciation, “illustrating how new species can arise through ‘circular overlap’, without interruption of gene flow through intervening populations…”[144]Ring species often attract the interests of evolutionary biologists, systematists, and researchers of speciation leading to both thought provoking ideas and confusion concerning their definition.[145] Contemporary scholars recognize that examples in nature have proved rare due to various factors such as limitations in taxonomic delineation[146] or, “taxonomic zeal”[143]—explained by the fact that taxonomists classify organisms into "species", while ring species often cannot fit this definition.[145] Other reasons such as gene flow interruption from “vicariate divergence” and fragmented populations due to climate instability have also been cited.[143]
Figure 4b: Ensatina salamander which forms a ring around the Californian Central Valley
A great deal of research has been conducted on the topic, and examples have been found and documented in nature. Debate exists concerning much of the research, with some authors citing evidence against their existence entirely.[147] The following examples provide evidence that—despite the limited number of concrete, idealized examples in nature—continuums of species do exist and can be found in biological systems.[143] This is often characterized by the existence of various sub-species level classifications (i.e. clines, ecotypes, groups, varieties, etc.). Caveats do exist considering that many of the examples have been disputed by researchers conducting subsequent studies and that, "many of the [proposed] cases have received very little attention from researchers, making it difficult to assess whether they display the characteristics of ideal ring species."[145]
Examples of species that have been described as exhibiting a ring-like, geographic distribution pattern:
- Acanthiza pusilla and A. ewingii[148]
- Acacia karroo[145][149][150]
- Alophoixus[143][151]
- Camarhynchus psittacula and C. pauper[145]
- Crimson Rosella (Platycercus elegans) complex[152][153]
- Drosophila paulistorum[154]
- Ensatina salamanders[155] (See figure 4b)
- Great Tit[145] (however, some studies dispute this example[156][157])
- Greenish warbler (Phylloscopus trochiloides) species complex[158][159][160][161]
- Hoplitis producta[145]
- House mouse[145]
- Junonia coenia and J. genoveva/J. evarete[145]
- Lalage leucopygialis, L. nigra, and L. sueurii[145]
- Larus gulls species complex
- Pelophylax nigromaculatus and P. porosus/P. porosus brevipodus[145] (the names and classification of these species have changed since the publication suggesting a ring species)
- Pernis ptilorhynchus and P. celebensis[145]
- Perognathus amplus and P. longimembris[145]
- Peromyscus maniculatus[162]
- Phellinus[163]
- Phylloscopus collybita and P. sindianus[145]
- Powelliphanta[164]
- Rhymogona silvatica and R. cervina[145] (the names and classification of these species have changed since the publication suggesting a ring species)
- Skylarks (Alauda arvensis, A. japonica and A. gulgula)[145]
- Song sparrow (Melospiza melodia)[165]
- Spurge (Euphorbia tithymaloides)[166]
- Trumpetfish (Aulostomus)[167]
- Todiramphus chloris and T. cinnamominus[145]
- Willow warblers[168][169]
Specific examples from biogeography
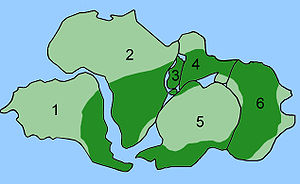
Figure 4c: Current distribution of Glossopteris
placed on a Permian map showing the connection of the continents. (1,
South America; 2, Africa; 3, Madagascar; 4, India; 5, Antarctica; and 6,
Australia). Note that the map is a rough approximation of which leaves
out additional land masses such as the Eurasian and North American
plates.
Figure 4d: A simplified phylogenetic tree of marsupials showing which groups reside on each continent.
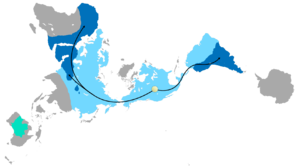
Figure 4e: A dymaxion map of the biogeographic distribution of Camelidae
species. Light blue indicates the Tertiary distribution, dark blue
indicates the present-day distributions, and green indicates the introduced (feral) distributions.
The yellow dot is the origin of the Camelidae family and the black
arrows are the historic migration routes that explain the present day
distribution.
Distribution of Glossopteris
The combination of continental drift and evolution can sometimes be used to predict what will be found in the fossil record. Glossopteris is an extinct species of seed fern plants from the Permian. Glossopteris appears in the fossil record around the beginning of the Permian on the ancient continent of Gondwana.[170] Continental drift explains the current biogeography of the tree. Present day Glossopteris fossils are found in Permian strata in southeast South America, southeast Africa, all of Madagascar, northern India, all of Australia, all of New Zealand, and scattered on the southern and northern edges of Antarctica. During the Permian, these continents were connected as Gondwana (see figure 4c) in agreement with magnetic striping, other fossil distributions, and glacial scratches pointing away from the temperate climate of the South Pole during the Permian.[171][172]Metatherian distribution
The history of metatherians (the clade containing marsupials and their extinct, primitive ancestors) provides an example of how evolutionary theory and the movement of continents can be combined to make predictions concerning fossil stratigraphy and distribution. The oldest metatherian fossils are found in present-day China.[173] Metatherians spread westward into modern North America (still attached to Eurasia) and then to South America, which was connected to North America until around 65 mya. Marsupials reached Australia via Antarctica about 50 mya, shortly after Australia had split off suggesting a single dispersion event of just one species.[174] Evolutionary theory suggests that the Australian marsupials descended from the older ones found in the Americas. Geologic evidence suggests that between 30 and 40 million years ago South America and Australia were still part of the Southern Hemisphere super continent of Gondwana and that they were connected by land that is now part of Antarctica. Therefore, when combining the models, scientists could predict that marsupials migrated from what is now South America, through Antarctica, and then to present-day Australia between 40 and 30 million years ago. A first marsupial fossil of the extinct family Polydolopidae was found on Seymour Island on the Antarctic Peninsula in 1982.[175] Further fossils have subsequently been found, including members of the marsupial orders Didelphimorphia (opossum) and Microbiotheria,[176] as well as ungulates and a member of the enigmatic extinct order Gondwanatheria, possibly Sudamerica ameghinoi.[177][178][179]Migration, isolation, and distribution of the camel
The history of the camel provides an example of how fossil evidence can be used to reconstruct migration and subsequent evolution. The fossil record indicates that the evolution of camelids started in North America (see figure 4e), from which, six million years ago, they migrated across the Bering Strait into Asia and then to Africa, and 3.5 million years ago through the Isthmus of Panama into South America. Once isolated, they evolved along their own lines, giving rise to the Bactrian camel and Dromedary in Asia and Africa and the llama and its relatives in South America. Camelids then became extinct in North America at the end of the last ice age.[180]Evidence from selection
Examples for the evidence for evolution often stem from direct observation of natural selection in the field and the laboratory. This section is unique in that it provides a narrower context concerning the process of selection. All of the examples provided prior to this have described the evidence that evolution has occurred, but has not provided the major underlying mechanism: natural selection. This section explicitly provides evidence that natural selection occurs, has been replicated artificially, and can be replicated in laboratory experiments.Scientists have observed and documented a multitude of events where natural selection is in action. The most well known examples are antibiotic resistance in the medical field along with better-known laboratory experiments documenting evolution's occurrence. Natural selection is tantamount to common descent in that long-term occurrence and selection pressures can lead to the diversity of life on earth as found today. All adaptations—documented and undocumented changes concerned—are caused by natural selection (and a few other minor processes). It is well established that, "...natural selection is a ubiquitous part of speciation...",[181] and is the primary driver of speciation;[182] therefore, the following examples of natural selection and speciation will often interdepend or correspond with one another. The examples below are only a small fraction of the actual experiments and observations.
Artificial selection and experimental evolution
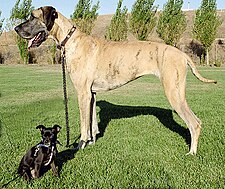
Artificial selection demonstrates the diversity that can exist among organisms that share a relatively recent common ancestor. In artificial selection, one species is bred selectively at each generation, allowing only those organisms that exhibit desired characteristics to reproduce. These characteristics become increasingly well developed in successive generations. Artificial selection was successful long before science discovered the genetic basis. Examples of artificial selection include dog breeding, genetically modified food, flower breeding, and the cultivation of foods such as wild cabbage,[183] and others.
Experimental evolution uses controlled experiments to test hypotheses and theories of evolution. In one early example, William Dallinger set up an experiment shortly before 1880, subjecting microbes to heat with the aim of forcing adaptive changes. His experiment ran for around seven years, and his published results were acclaimed, but he did not resume the experiment after the apparatus failed.[184]
A large-scale example of experimental evolution is Richard Lenski's multi-generation experiment with Escherichia coli. Lenski observed that some strains of E. coli evolved a complex new ability, the ability to metabolize citrate, after tens of thousands of generations.[185][186] The evolutionary biologist Jerry Coyne commented as a critique of creationism, saying, "the thing I like most is it says you can get these complex traits evolving by a combination of unlikely events. That's just what creationists say can't happen."[185] In addition to the metabolic changes, the different bacterial populations were found to have diverged in respect to both morphology (the overall size of the cell) and fitness (of which was measured in competition with the ancestors).[187] The E. coli long-term evolution experiment that began in 1988 is still in progress, and has shown adaptations including the evolution of a strain of E. coli that was able to grow on citric acid in the growth media—a trait absent in all other known forms of E. coli, including the initial strain.
Specific examples from selection: invertebrates
Historical lead tolerance in Daphnia
Another study involved species of Daphnia and the enormous increase in lead pollution that occurred during the 20th century. Lead toxicity reached an all-time high in lakes in the 1970s, and due to leads toxicity to both vertebrates and invertebrates, it could be predicted that an increase in lead pollution would lead to strong selection pressures towards lead tolerance. In this study, researchers were able to use a method of "resurrection ecology" whereby they could hatch decades-old Daphnia eggs from the time in which lakes were heavily polluted with lead. The hatchlings in the study were compared to current-day Daphnia, and demonstrated "dramatic fitness differences between old and modern phenotypes when confronted with a widespread historical environmental stressor". Essentially, the modern-day Daphnia were unable to resist or tolerate high levels of lead (this is due to the huge reduction of lead pollution in 21st century lakes). The old hatchlings; however, were able to tolerate high lead pollution. The authors concluded that "by employing the techniques of resurrection ecology, we were able to show clear phenotypic change over decades...".[188]Peppered moths
Other examples include phenotypic changes such as in the classic example of light-to-dark color adaptation in the peppered moth due to pollution from the Industrial Revolution in England.Specific examples from selection: microbes
Antimicrobial resistance
The development and spread of antibiotic-resistant bacteria is evidence for the process of evolution of species. Thus the appearance of vancomycin-resistant Staphylococcus aureus, and the danger it poses to hospital patients, is a direct result of evolution through natural selection. The rise of Shigella strains resistant to the synthetic antibiotic class of sulfonamides also demonstrates the generation of new information as an evolutionary process.[189] Similarly, the appearance of DDT resistance in various forms of Anopheles mosquitoes, and the appearance of myxomatosis resistance in breeding rabbit populations in Australia, are both evidence of the existence of evolution in situations of evolutionary selection pressure in species in which generations occur rapidly.Additionally, all classes of microbes develop resistance: including fungi (antifungal resistance), viruses (antiviral resistance), protozoa (antiprotozoal resistance), and bacteria (antibiotic resistance). This is to be expected when considering that all life exhibits universal genetic code and is therefore subject to the process of evolution through its various mechanisms.
Nylon-eating bacteria
Another example of organisms adapting to human-caused conditions are Nylon-eating bacteria: a strain of Flavobacterium that are capable of digesting certain byproducts of nylon 6 manufacturing. There is scientific consensus that the capacity to synthesize nylonase most probably developed as a single-step mutation that survived because it improved the fitness of the bacteria possessing the mutation. This is seen as a good example of evolution through mutation and natural selection that has been observed as it occurs and could not have come about until the production of nylon by humans.[190][191][192][193]Specific examples from selection: plants and fungi
Monkeyflower radiation
Both subspecies Mimulus aurantiacus puniceus (red-flowered) and Mimulus aurantiacus australis (yellow-flowered) of monkeyflowers are isolated due to the preferences of their hummingbird and hawkmoth pollinators. The radiation of M. aurantiacus subspecies are mostly yellow colored; however, both M. a. ssp. puniceus and M. a. ssp. flemingii are red. Phylogenetic analysis suggests two independent origins of red-colored flowers that arose due to cis-regulatory mutations in the gene MaMyb2 that is present in all M. aurantiacus subspecies. Further research suggested that two independent mutations did not take place, but one MaMyb2 allele was transferred via introgressive hybridization.[194] This study presents an example of the overlap of research in various disciplines. Gene isolation and cis-regulatory functions; phylogenetic analysis; geographic location and pollinator preference; and species hybridization and speciation are just some of the areas in which data can be obtained to document the occurrence of evolution.Radiotrophic fungi
Like the codfish, human-caused pollution can come in different forms. Radiotrophic fungi is a perfect example of natural selection taking place after a chemical accident. Radiotrophic fungi appears to use the pigment melanin to convert gamma radiation into chemical energy for growth[195][196] and were first discovered in 2007 as black molds growing inside and around the Chernobyl Nuclear Power Plant.[195] Research at the Albert Einstein College of Medicine showed that three melanin-containing fungi, Cladosporium sphaerospermum, Wangiella dermatitidis, and Cryptococcus neoformans, increased in biomass and accumulated acetate faster in an environment in which the radiation level was 500 times higher than in the normal environment.Specific examples from selection: vertebrates
Guppies
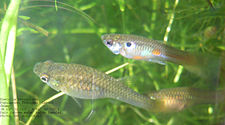
While studying guppies (Poecilia reticulata) in Trinidad, biologist John Endler detected selection at work on the fish populations. To rule out alternative possibilities, Endler set up a highly controlled experiment to mimic the natural habitat by constructing ten ponds within a laboratory greenhouse at Princeton University. Each pond contained gravel to exactly match that of the natural ponds. After capturing a random sample of guppies from ponds in Trinidad, he raised and mixed them to create similar genetically diverse populations and measured each fish (spot length, spot height, spot area, relative spot length, relative spot height, total patch area, and standard body lengths). For the experiment he added Crenicichla alta (P. reticulata's main predator) in four of the ponds, Rivulus hartii (a non-predator fish) in four of the ponds, and left the remaining two ponds empty with only the guppies. After 10 generations, comparisons were made between each pond's guppy populations and measurements were taken again. Endler found that the populations had evolved dramatically different color patterns in the control and non-predator pools and drab color patterns in the predator pool. Predation pressure had caused a selection against standing out from background gravel.[197]
Figure 5b: Endler's Trinadadian guppies (Poecilia reticulata).
In parallel, during this experiment, Endler conducted a field experiment in Trinidad where he caught guppies from ponds where they had predators and relocated them to ponds upstream where the predators did not live. After 15 generations, Endler found that the relocated guppies had evolved dramatic and colorful patterns. Essentially, both experiments showed convergence due to similar selection pressures (i.e. predator selection against contrasting color patterns and sexual selection for contrasting color patterns).[197]
In a later study by David Reznick, the field population was examined 11 years later after Endler relocated the guppies to high streams. The study found that the populations has evolved in a number of different ways: bright color patterns, late maturation, larger sizes, smaller litter sizes, and larger offspring within litters.[198] Further studies of P. reticulata and their predators in the streams of Trinidad have indicated that varying modes of selection through predation have not only changed the guppies color patterns, sizes, and behaviors, but their life histories and life history patterns.[199]
Humans
Natural selection is observed in contemporary human populations, with recent findings demonstrating that the population at risk of the severe debilitating disease kuru has significant over-representation of an immune variant of the prion protein gene G127V versus non-immune alleles. Scientists postulate one of the reasons for the rapid selection of this genetic variant is the lethality of the disease in non-immune persons.[200][201] Other reported evolutionary trends in other populations include a lengthening of the reproductive period, reduction in cholesterol levels, blood glucose and blood pressure.[202]A well known example of selection occurring in human populations is lactose tolerance. Lactose intolerance is the inability to metabolize lactose, because of a lack of the required enzyme lactase in the digestive system. The normal mammalian condition is for the young of a species to experience reduced lactase production at the end of the weaning period (a species-specific length of time). In humans, in non-dairy consuming societies, lactase production usually drops about 90% during the first four years of life, although the exact drop over time varies widely.[203] Lactase activity persistence in adults is associated with two polymorphisms: C/T 13910 and G/A 22018 located in the MCM6 gene.[204] This gene difference eliminates the shutdown in lactase production, making it possible for members of these populations to continue consumption of raw milk and other fresh and fermented dairy products throughout their lives without difficulty. This appears to be an evolutionarily recent (around 10,000 years ago [and 7,500 years ago in Europe][205]) adaptation to dairy consumption,[206] and has occurred independently in both northern Europe and east Africa in populations with a historically pastoral lifestyle.[207][208]
Italian wall lizards
In 1971, ten adult specimens of Podarcis sicula (the Italian wall lizard) were transported from the Croatian island of Pod Kopište to the island Pod Mrčaru (about 3.5 km to the east). Both islands lie in the Adriatic Sea near Lastovo, where the lizards founded a new bottlenecked population.[209][210] The two islands have similar size, elevation, microclimate, and a general absence of terrestrial predators[210] and the P. sicula expanded for decades without human interference, even out-competing the (now locally extinct[209]) Podarcis melisellensis population.[211]In the 1990s, scientists returned to Pod Mrčaru and found that the lizards currently occupying Mrčaru differ greatly from those on Kopište. While mitochondrial DNA analyses have verified that P. sicula currently on Mrčaru are genetically very similar to the Kopište source population,[209] the new Mrčaru population of P. sicula was described as having a larger average size, shorter hind limbs, lower maximal sprint speed and altered response to simulated predatory attacks compared to the original Kopište population.[210] These population changes in morphology and behavior were attributed to "relaxed predation intensity" and greater protection from vegetation on Mrčaru.[210]
In 2008, further analysis revealed that the Mrčaru population of P. sicula have significantly different head morphology (longer, wider, and taller heads) and increased bite force compared to the original Kopište population.[209] This change in head shape corresponded with a shift in diet: Kopište P. sicula are primarily insectivorous, but those on Mrčaru eat substantially more plant matter.[209] The changes in foraging style may have contributed to a greater population density and decreased territorial behavior of the Mrčaru population.[209]
Another difference found between the two populations was the discovery, in the Mrčaru lizards, of cecal valves, which slow down food passage and provide fermenting chambers, allowing commensal microorganisms to convert cellulose to nutrients digestible by the lizards.[209] Additionally, the researchers discovered that nematodes were common in the guts of Mrčaru lizards, but absent from Kopište P. sicula, which do not have cecal valves.[209] The cecal valves, which occur in less than 1 percent of all known species of scaled reptiles,[209] have been described as an "adaptive novelty, a brand new feature not present in the ancestral population and newly evolved in these lizards".[212]
PAH resistance in killifish
A similar study was also done regarding the polycyclic aromatic hydrocarbons (PAHs) that pollute the waters of the Elizabeth River in Portsmouth, Virginia. This chemical is a product of creosote, a type of tar. The Atlantic killifish (Fundulus heteroclitus) has evolved a resistance to PAHs involving the AHR gene (the same gene involved in the tomcods). This particular study focused on the resistance to "acute toxicity and cardiac teratogenesis" caused by PAHs. that mutated within the tomcods in the Hudson River.[213]PCB resistance in codfish
An example involving the direct observation of gene modification due to selection pressures is the resistance to PCBs in codfish. After General Electric dumped polychlorinated biphenyls (PCBs) in the Hudson River from 1947 through 1976, tomcods (Microgadus tomcod) living in the river were found to have evolved an increased resistance to the compound's toxic effects.[214] The tolerance to the toxins is due to a change in the coding section of specific gene. Genetic samples were taken from the cods from 8 different rivers in the New England region: the St. Lawrence River, Miramichi River, Margaree River, Squamscott River, Niantic River, the Shinnecock Basic, the Hudson River, and the Hackensack River. Genetic analysis found that in the population of tomcods in the four southernmost rivers, the gene AHR2 (aryl hydrocarbon receptor 2) was present as an allele with a difference of two amino acid deletions.[215] This deletion conferred a resistance to PCB in the fish species and was found in 99% of Hudson River tomcods, 92% in the Hackensack River, 6% in the Niantic River, and 5% in Shinnecock Bay.[215] This pattern along the sampled bodies of waters infers a direct correlation of selective pressures leading to the evolution of PCB resistance in Atlantic tomcod fish.[215]Urban wildlife
Urban wildlife is a broad and easily observable case of human-caused selection pressure on wildlife. With the growth in human habitats, different animals have adapted to survive within these urban environments. These types of environments can exert selection pressures on organisms, often leading to new adaptations. For example, the weed Crepis sancta, found in France, has two types of seed, heavy and fluffy. The heavy ones land nearby to the parent plant, whereas fluffy seeds float further away on the wind. In urban environments, seeds that float far often land on infertile concrete. Within about 5–12 generations, the weed evolves to produce significantly heavier seeds than its rural relatives.[216][217] Other examples of urban wildlife are rock pigeons and species of crows adapting to city environments around the world; African penguins in Simon's Town; baboons in South Africa; and a variety of insects living in human habitations. Studies have been conducted and have found striking changes to animals' (more specifically mammals') behavior and physical brain size due to their interactions with human-created environments.[218][219]White Sands lizards
Figure 5c: An ecotonal variant of Holbrookia maculata ruthveni.
Animals that exhibit ecotonal variations allow for research concerning the mechanisms that maintain population differentiation. A wealth of information about natural selection, genotypic, and phenotypic variation;[220][221] adaptation and ecomorphology;[222] and social signaling[223] has been acquired from the studies of three species of lizards located in the White Sands desert of New Mexico. Holbrookia maculata, Aspidoscelis inornata, and Sceloporus undulatus exhibit ecotonal populations that match both the dark soils and the white sands in the region. Research conducted on these species has found significant phenotypic and genotypic differences between the dark and light populations due to strong selection pressures. For example, H. maculata exhibits the strongest phenotypic difference (matches best with the substrate) of the light colored population coinciding with the least amount of gene flow between the populations and the highest genetic differences when compared to the other two lizard species.[220]
New Mexico’s White Sands are a recent geologic formation (approximately 6000 years old[223] to possibly 2000 years old[220]). This recent origin of the sands suggests that species exhibiting lighter-colored variations have evolved in a relatively short time frame. The three lizard species previously mentioned have been found to display variable social signal coloration in coexistence with their ecotonal variants.[223] Not only have the three species convergently evolved their lighter variants due to the selection pressures from the environment, they’ve also evolved ecomorphological differences: morphology, behavior (in is case, escape behavior), and performance (in this case, sprint speed) collectively.[222] Roches’ work found surprising results in the escape behavior of H. maculata and S. undulatus. When dark morphs were placed on white sands, their startle response was significantly diminished. This result could be due to varying factors relating to sand temperature or visual acuity; however, regardless of the cause, “…failure of mismatched lizards to sprint could be maladaptive when faced with a predator”.[222]
Evidence from speciation
Speciation is the evolutionary process by which new biological species arise. Biologists research species using different theoretical frameworks for what constitutes a species (see species problem and species complex) and there exists debate with regard to delineation.[224] Nevertheless, much of the current research suggests that, "...speciation is a process of emerging genealogical distinctness, rather than a discontinuity affecting all genes simultaneously"[225] and, in allopatry (the most common form of speciation), "reproductive isolation is a byproduct of evolutionary change in isolated populations, and thus can be considered an evolutionary accident".[226] Speciation occurs as the result of the latter (allopatry); however, a variety of differing agents have been documented and are often defined and classified in various forms (e.g. peripatric, parapatric, sympatric, polyploidization, hybridization, etc.). Instances of speciation have been observed in both nature and the laboratory. A.-B Florin and A. Ödeen note that, "strong laboratory evidence for allopatric speciation is lacking..."; however, contrary to laboratory studies (focused specifically on models of allopatric speciation), "speciation most definitely occurs; [and] the vast amount of evidence from nature makes it unreasonable to argue otherwise".[227] Coyne and Orr compiled a list of 19 laboratory experiments on Drosophila presenting examples of allopatric speciation by divergent selection concluding that, "reproductive isolation in allopatry can evolve as a byproduct of divergent selection".[228]Research documenting speciation is abundant. Biologists have documented numerous examples of speciation in nature—with evolution having produced far more species than any observer would consider necessary. For example, there are well over 350,000 described species of beetles.[229] Great examples of speciation come from the observations of island biogeography and the process of adaptive radiation, both explained previously. Evidence of common descent can also be found through paleontological studies of speciation within geologic strata. The examples described below represent different modes of speciation and provide strong evidence for common descent. It is important to acknowledge that not all speciation research directly observes divergence from "start-to-finish". This is by virtue of research delimitation and definition ambiguity, and occasionally leads research towards historical reconstructions. In light of this, examples abound, and the following are by no means exhaustive—comprising only a small fraction of the instances observed. Once again, take note of the established fact that, "...natural selection is a ubiquitous part of speciation...",[181] and is the primary driver of speciation,[182] so; hereinafter, examples of speciation will often interdepend and correspond with selection.
Specific examples from speciation: fossils
Limitations exist within the fossil record when considering the concept of what constitutes a species. Paleontologists largely rely on a different framework: the morphological species concept.[230] Due to the absence of information such as reproductive behavior or genetic material in fossils, paleontologists distinguish species by their phenotypic differences.[230] Extensive investigation of the fossil record has led to numerous theories concerning speciation (in the context of paleontology) with many of the studies suggesting that stasis, punctuation, and lineage branching are common. In 1995, D. H. Erwin, et al. published a major work—New Approaches to Speciation in the Fossil Record—which compiled 58 studies of fossil speciation (between 1972 and 1995) finding most of the examples suggesting stasis (involving anagenesis or punctuation) and 16 studies suggesting speciation.[230] Despite stasis appearing to be the predominate conclusion at first glance, this particular meta-study investigated deeper, concluding that, "...no single pattern appears dominate..." with "...the preponderance of studies illustrating both stasis and gradualism in the history of a single lineage".[231] Many of the studies conducted utilize seafloor sediments that can provide a significant amount of data concerning planktonic microfossils.[230] The succession of fossils in stratigraphy can be used to determine evolutionary trends among fossil organisms. In addition, incidences of speciation can be interpreted from the data and numerous studies have been conducted documenting both morphological evolution and speciation.Globorotalia
Figure 6a: Morphologic change of Globorotalia crassaformis, G. tosaensis, and G. truncatulinoides over 3.5 Ma. Superimposed is a phylogenetic tree of the group. Adapted from Lazarus et al. (1995)
Extensive research on the planktonic foraminifer Globorotalia truncatulinoides has provided insight into paleobiogeographical and paleoenvironmental studies alongside the relationship between the environment and evolution. In an extensive study of the paleobiogeography of G. truncatulinoides, researchers found evidence that suggested the formation of a new species (via the sympatric speciation framework). Cores taken of the sediment containing the three species G. crassaformis, G. tosaensis, and G. truncatulinoides found that before 2.7 Ma, only G. crassaformis and G. tosaensis existed. A speciation event occurred at that time, whereby intermediate forms existed for quite some time. Eventually G. tosaensis disappears from the record (suggesting extinction) but exists as an intermediate between the extant G. crassaformis and G. truncatulinoides. This record of the fossils also matched the already existing phylogeny constructed by morphological characters of the three species.[232] See figure 6a.
Radiolaria
In a large study of five species of radiolarians (Calocycletta caepa, Pterocanium prismatium, Pseudoculous vema, Eucyrtidium calvertense, and Eucyrtidium matuyamai), the researchers documented considerable evolutionary change in each lineage. Alongside this, trends with the closely related species E. calvertense and E. matuyamai showed that about 1.9 Mya E. calvertense invaded a new region of the Pacific, becoming isolated from the main population. The stratigraphy of this species clearly shows that this isolated population evolved into E. Matuyamai. It then reinvaded the region of the still-existing and static E. calvertense population whereby a sudden decrease in body size occurred. Eventually the invader E. matuyamai disappeared from the stratum (presumably due to extinction) coinciding with a desistance of size reduction of the E. calvertense population. From that point on, the change in size leveled to a constant. The authors suggest competition-induced character displacement.[233][234]Rhizosolenia
Researchers conducted measurements on 5,000 Rhizosolenia (a planktonic diatom) specimens from eight sedimentary cores in the Pacific Ocean. The core samples spanned two million years and were chronologized using sedimentary magnetic field reversal measurements. All the core samples yielded a similar pattern of divergence: with a single lineage (R. bergonii) occurring before 3.1 Mya and two morphologically distinct lineages (daughter species: R. praebergonii) appearing after. The parameters used to measure the samples were consistent throughout each core.[235] An additional study of the daughter species R. praebergonii found that, after the divergence, it invaded the Indian Ocean.[230][236]Turborotalia
A recent study was conducted involving the planktonic foraminifer Turborotalia. The authors extracted “51 stratigraphically ordered samples from a site within the oceanographically stable tropical North Pacific gyre”. Two hundred individual species were examined using ten specific morphological traits (size, compression index, chamber aspect ratio, chamber inflation, aperture aspect ratio, test height, test expansion, umbilical angle, coiling direction, and the number of chambers in the final whorl). Utilizing multivariate statistical clustering methods, the study found that the species continued to evolve non-directionally within the Eocene from 45 Ma to about 36 Ma. However, from 36 Ma to approximately 34 Ma, the stratigraphic layers showed two distinct clusters with significantly defining characteristics distinguishing one another from a single species. The authors concluded that speciation must have occurred and that the two new species were ancestral to the prior species.[237] Just as in most of evolutionary biology, this example represents the interdisciplinary nature of the field and the necessary collection of data from various fields (e.g. oceanography, paleontology) and the integration of mathematical analysis (e.g. biometry).Vertebrates
There exists evidence for vertebrate speciation despite limitations imposed by the fossil record. Studies have been conducted documenting similar patterns seen in marine invertebrates.[230] For example, extensive research documenting rates of morphological change, evolutionary trends, and speciation patterns in small mammals[238] has significantly contributed to the scientific literature; once more, demonstrating that evolution (and speciation) occurred in the past and lends support common ancestry.A study of four mammalian genera: Hyopsodus, Pelycodus, Haplomylus (three from the Eocene), and Plesiadapis (from the Paleocene) found that—through a large number of stratigraphic layers and specimen sampling—each group exhibited, "gradual phyletic evolution, overall size increase, iterative evolution of small species, and character divergence following the origin of each new lineage".[239] The authors of this study concluded that speciation was discernible. In another study concerning morphological trends and rates of evolution found that the European arvicolid rodent radiated into 52 distinct lineages over a time frame of 5 million years while documenting examples of phyletic gradualism, punctuation, and stasis.[240]
Specific examples from speciation: invertebrates
Drosophila melanogaster
Figure 6b: A common fruit fly (Drosophila melanogaster).
William R. Rice and George W. Salt found experimental evidence of sympatric speciation in the common fruit fly. They collected a population of Drosophila melanogaster from Davis, California and placed the pupae into a habitat maze. Newborn flies had to investigate the maze to find food. The flies had three choices to take in finding food. Light and dark (phototaxis), up and down (geotaxis), and the scent of acetaldehyde and the scent of ethanol (chemotaxis) were the three options. This eventually divided the flies into 42 spatio-temporal habitats.
They then cultured two strains that chose opposite habitats. One of the strains emerged early, immediately flying upward in the dark attracted to the acetaldehyde. The other strain emerged late and immediately flew downward, attracted to light and ethanol. Pupae from the two strains were then placed together in the maze and allowed to mate at the food site. They then were collected. A selective penalty was imposed on the female flies that switched habitats. This entailed that none of their gametes would pass on to the next generation. After 25 generations of this mating test, it showed reproductive isolation between the two strains. They repeated the experiment again without creating the penalty against habitat switching and the result was the same; reproductive isolation was produced.[241][242][243]
Gall wasps
A study of the gall-forming wasp species Belonocnema treatae found that populations inhabiting different host plants (Quercus geminata and Q. Virginiana) exhibited different body size and gall morphology alongside an strong expression of sexual isolation. The study hypothesized that B. treatae populations inhabiting different host plants would show evidence of divergent selection promoting speciation. The researchers sampled gall wasp species and oak tree localities, measured body size (right hand tibia of each wasp), and counted gall chamber numbers. In addition to measurements, they conducted mating assays and statistical analyses. Genetic analysis was also conducted on two mtDNA sites (416 base pairs from cytochrome C and 593 base pairs from cytochrome oxidase ) to “control for the confounding effects of time since divergence among allopatric populations”.[244]In an additional study, the researchers studied two gall wasp species B. treatae and Disholcaspis quercusvirens and found strong morphological and behavioral variation among host-associated populations. This study further confounded prerequisites to speciation.[245]
Hawthorn fly
One example of evolution at work is the case of the hawthorn fly, Rhagoletis pomonella, also known as the apple maggot fly, which appears to be undergoing sympatric speciation.[246] Different populations of hawthorn fly feed on different fruits. A distinct population emerged in North America in the 19th century some time after apples, a non-native species, were introduced. This apple-feeding population normally feeds only on apples and not on the historically preferred fruit of hawthorns. The current hawthorn feeding population does not normally feed on apples. Some evidence, such as the fact that six out of thirteen allozyme loci are different, that hawthorn flies mature later in the season and take longer to mature than apple flies; and that there is little evidence of interbreeding (researchers have documented a 4–6% hybridization rate) suggests that speciation is occurring.[247][248][249][250][251]London Underground mosquito
The London Underground mosquito is a species of mosquito in the genus Culex found in the London Underground. It evolved from the overground species Culex pipiens. This mosquito, although first discovered in the London Underground system, has been found in underground systems around the world. It is suggested that it may have adapted to human-made underground systems since the last century from local above-ground Culex pipiens,[252] although more recent evidence suggests that it is a southern mosquito variety related to Culex pipiens that has adapted to the warm underground spaces of northern cities.[253]The two species have very different behaviours,[254] are extremely difficult to mate,[252] and with different allele frequency, consistent with genetic drift during a founder event.[255] More specifically, this mosquito, Culex pipiens molestus, breeds all-year round, is cold intolerant, and bites rats, mice, and humans, in contrast to the above ground species Culex pipiens that is cold tolerant, hibernates in the winter, and bites only birds. When the two varieties were cross-bred the eggs were infertile suggesting reproductive isolation.[252][254]
The genetic data indicates that the molestus form in the London Underground mosquito appears to have a common ancestry, rather than the population at each station being related to the nearest aboveground population (i.e. the pipiens form). Byrne and Nichols' working hypothesis was that adaptation to the underground environment had occurred locally in London only once. These widely separated populations are distinguished by very minor genetic differences, which suggest that the molestus form developed: a single mtDNA difference shared among the underground populations of ten Russian cities;[256] a single fixed microsatellite difference in populations spanning Europe, Japan, Australia, the middle East and Atlantic islands.[253]
Snapping shrimp and the isthmus of Panama
Debate exists determining when the isthmus of Panama closed. Much of the evidence supports a closure approximately 2.7 to 3.5 mya using "...multiple lines of evidence and independent surveys".[257] However, a recent study suggests an earlier, transient bridge existed 13 to 15 mya.[258] Regardless of the timing of the isthmus closer, biologists can study the species on the Pacific and Caribbean sides in, what has been called, "one of the greatest natural experiments in evolution."[257] Studies of snapping shrimp in the genus Alpheus have provided direct evidence of allopatric speciation events,[259] and contributed to the literature concerning rates of molecular evolution.[260] Phylogenetic reconstructions using "multilocus datasets and coalescent-based analytical methods" support the relationships of the species in the group[257] and molecular clock techniques support the separation of 15 pairs of Alpheus species between 3 and 15 million years ago.[260]Specific examples from speciation: plants
The botanist Verne Grant pioneered the field of plant speciation with his research and major publications on the topic.[261] As stated before, many biologists rely on the biological species concept, with some modern researchers utilizing the phylogenetic species concept. Debate exists in the field concerning which framework should be applied in the research.[261] Regardless, reproductive isolation is the primary role in the process of speciation and has been studied extensively by biologists in their respective disciplines.Both hybridization and polyploidy have also been found to be major contributors to plant speciation.[262] With the advent of molecular markers, "hybridization [is] considerably more frequent than previously believed".[261] In addition to these two modes leading to speciation, pollinator preference and isolation, chromosomal rearrangements, and divergent natural selection have become critical to the speciation of plants. Furthermore, recent research suggests that sexual selection, epigenetic drivers, and the creation of incompatible allele combinations caused by balancing selection also contribute to the formation of new species.[262] Instances of these modes have been researched in both the laboratory and in nature. Studies have also suggested that, due to "the sessile nature of plants... [it increases] the relative importance of ecological speciation..."[263]
Hybridization between two different species sometimes leads to a distinct phenotype. This phenotype can also be fitter than the parental lineage and as such, natural selection may then favor these individuals. Eventually, if reproductive isolation is achieved, it may lead to a separate species. However, reproductive isolation between hybrids and their parents is particularly difficult to achieve and thus hybrid speciation is considered a rare event. However, hybridization resulting in reproductive isolation is considered an important means of speciation in plants,[264] since polyploidy (having more than two copies of each chromosome) is tolerated in plants more readily than in animals.[265][266]
Polyploidy is important in hybrids as it allows reproduction, with the two different sets of chromosomes each being able to pair with an identical partner during meiosis.[267] Polyploids also have more genetic diversity, which allows them to avoid inbreeding depression in small populations.[268] Hybridization without change in chromosome number is called homoploid hybrid speciation. It is considered very rare but has been shown in Heliconius butterflies[269] and sunflowers. Polyploid speciation, which involves changes in chromosome number, is a more common phenomenon, especially in plant species.
Polyploidy is a mechanism that has caused many rapid speciation events in sympatry because offspring of, for example, tetraploid x diploid matings often result in triploid sterile progeny.[270] Not all polyploids are reproductively isolated from their parental plants, and gene flow may still occur for example through triploid hybrid x diploid matings that produce tetraploids, or matings between meiotically unreduced gametes from diploids and gametes from tetraploids. It has been suggested that many of the existing plant and most animal species have undergone an event of polyploidization in their evolutionary history.[267][271] Reproduction of successful polyploid species is sometimes asexual, by parthenogenesis or apomixis, as for unknown reasons many asexual organisms are polyploid. Rare instances of polyploid mammals are known, but most often result in prenatal death.
Researchers consider reproductive isolation as key to speciation.[272] A major aspect of speciation research is to determine the nature of the barriers that inhibit reproduction. Botanists often consider the zoological classifications of prezygotic and postzygotic barriers as inadequate.[272] The examples provided below give insight into the process of speciation.
Mimulus peregrinus
The creation of a new allopolyploid species (Mimulus peregrinus) was observed on the banks of the Shortcleuch Water—a river in Leadhills, South Lanarkshire, Scotland. Parented from the cross of the two species Mimulus guttatus (containing 14 pairs of chromosomes) and Mimulus luteus (containing 30-31 pairs from a chromosome duplication), M. peregrinus has six copies of its chromosomes (caused by the duplication of the sterile hybrid triploid). Due to the nature of these species, they have the ability to self-fertilize. Because of its number of chromosomes it is not able to pair with M. guttatus, M. luteus, or their sterile triploid offspring. M. peregrinus will either die, producing no offspring, or reproduce with itself effectively leading to a new species.[273][274]Raphanobrassica
Raphanobrassica includes all intergeneric hybrids between the genera Raphanus (radish) and Brassica (cabbages, etc.).[275][276] The Raphanobrassica is an allopolyploid cross between the radish (Raphanus sativus) and cabbage (Brassica oleracea). Plants of this parentage are now known as radicole. Two other fertile forms of Raphanobrassica are known. Raparadish, an allopolyploid hybrid between Raphanus sativus and Brassica rapa is grown as a fodder crop. "Raphanofortii" is the allopolyploid hybrid between Brassica tournefortii and Raphanus caudatus. The Raphanobrassica is a fascinating plant, because (in spite of its hybrid nature), it is not sterile. This has led some botanists to propose that the accidental hybridization of a flower by pollen of another species in nature could be a mechanism of speciation common in higher plants.Senecio (groundsel)
The Welsh groundsel is an allopolyploid, a plant that contains sets of chromosomes originating from two different species. Its ancestor was Senecio × baxteri, an infertile hybrid that can arise spontaneously when the closely related groundsel (Senecio vulgaris) and Oxford ragwort (Senecio squalidus) grow alongside each other. Sometime in the early 20th century, an accidental doubling of the number of chromosomes in an S. × baxteri plant led to the formation of a new fertile species.[277][278]The York groundsel (Senecio eboracensis) is a hybrid species of the self-incompatible Senecio squalidus (also known as Oxford ragwort) and the self-compatible Senecio vulgaris (also known as common groundsel). Like S. vulgaris, S. eboracensis is self-compatible, however, it shows little or no natural crossing with its parent species, and is therefore reproductively isolated, indicating that strong breed barriers exist between this new hybrid and its parents. It resulted from a backcrossing of the F1 hybrid of its parents to S. vulgaris. S. vulgaris is native to Britain, while S. squalidus was introduced from Sicily in the early 18th century; therefore, S. eboracensis has speciated from those two species within the last 300 years.
Other hybrids descended from the same two parents are known. Some are infertile, such as S. x baxteri. Other fertile hybrids are also known, including S. vulgaris var. hibernicus, now common in Britain, and the allohexaploid S. cambrensis, which according to molecular evidence probably originated independently at least three times in different locations. Morphological and genetic evidence support the status of S. eboracensis as separate from other known hybrids.[279]
Thale cress
Figure 6c: Arabidopsis thaliana (colloquially known as thale cress, mouse-ear cress or Arabidopsis).
Kirsten Bomblies et al. from the Max Planck Institute for Developmental Biology discovered that two genes passed down by each parent of the thale cress plant, Arabidopsis thaliana. When the genes are passed down, it ignites a reaction in the hybrid plant that turns its own immune system against it. In the parents, the genes were not detrimental, but they evolved separately to react defectively when combined.[280] To test this, Bomblies crossed 280 genetically different strains of Arabidopsis in 861 distinct ways and found that 2 percent of the resulting hybrids were necrotic. Along with allocating the same indicators, the 20 plants also shared a comparable collection of genetic activity in a group of 1,080 genes. In almost all of the cases, Bomblies discovered that only two genes were required to cause the autoimmune response. Bomblies looked at one hybrid in detail and found that one of the two genes belonged to the NB-LRR class, a common group of disease resistance genes involved in recognizing new infections. When Bomblies removed the problematic gene, the hybrids developed normally.[280] Over successive generations, these incompatibilities could create divisions between different plant strains, reducing their chances of successful mating and turning distinct strains into separate species.[281]
Tragopogon (salsify)
Figure 6d: Purple salsify, Tragopogon porrifolius
Tragopogon is one example where hybrid speciation has been observed. In the early 20th century, humans introduced three species of salsify into North America. These species, the western salsify (Tragopogon dubius), the meadow salsify (Tragopogon pratensis), and the oyster plant (Tragopogon porrifolius), are now common weeds in urban wastelands. In the 1950s, botanists found two new species in the regions of Idaho and Washington, where the three already known species overlapped. One new species, Tragopogon miscellus, is a tetraploid hybrid of T. dubius and T. pratensis. The other new species, Tragopogon mirus, is also an allopolyploid, but its ancestors were T. dubius and T. porrifolius. These new species are usually referred to as "the Ownbey hybrids" after the botanist who first described them. The T. mirus population grows mainly by reproduction of its own members, but additional episodes of hybridization continue to add to the T. mirus population.[282]
T. dubius and T. pratensis mated in Europe but were never able to hybridize. A study published in March 2011 found that when these two plants were introduced to North America in the 1920s, they mated and doubled the number of chromosomes in there hybrid Tragopogon miscellus allowing for a "reset" of its genes, which in turn, allows for greater genetic variation. Professor Doug Soltis of the University of Florida said, "We caught evolution in the act…New and diverse patterns of gene expression may allow the new species to rapidly adapt in new environments".[283][284] This observable event of speciation through hybridization further advances the evidence for the common descent of organisms and the time frame in which the new species arose in its new environment. The hybridizations have been reproduced artificially in laboratories from 2004 to present day.
Specific examples from speciation: vertebrates
Blackcap
The bird species, Sylvia atricapilla, commonly referred to as blackcaps, lives in Germany and flies southwest to Spain while a smaller group flies northwest to Great Britain during the winter. Gregor Rolshausen from the University of Freiburg found that the genetic separation of the two populations is already in progress. The differences found have arisen in about 30 generations. With DNA sequencing, the individuals can be assigned to a correct group with an 85% accuracy. Stuart Bearhop from the University of Exeter reported that birds wintering in England tend to mate only among themselves, and not usually with those wintering in the Mediterranean.[285] It is still inference to say that the populations will become two different species, but researchers expect it due to the continued genetic and geographic separation.[286]Mollies
The shortfin molly (Poecilia mexicana) is a small fish that lives in the Sulfur Caves of Mexico. Years of study on the species have found that two distinct populations of mollies—the dark interior fish and the bright surface water fish—are becoming more genetically divergent.[287] The populations have no obvious barrier separating the two; however, it was found that the mollies are hunted by a large water bug (Belostoma spp). Tobler collected the bug and both types of mollies, placed them in large plastic bottles, and put them back in the cave. After a day, it was found that, in the light, the cave-adapted fish endured the most damage, with four out of every five stab-wounds from the water bugs sharp mouthparts. In the dark, the situation was the opposite. The mollies' senses can detect a predator's threat in their own habitats, but not in the other ones. Moving from one habitat to the other significantly increases the risk of dying. Tobler plans on further experiments, but believes that it is a good example of the rise of a new species.[288]Polar bear
A remarkable example of natural selection, geographic isolation, and speciation in progress is the relationship between the polar bear (Ursus maritimus) and the brown bear (Ursus arctos). Considered separate species throughout their ranges;[289] however, it has been documented that they possess the capability to interbreed and produce fertile offspring. This introgressive hybridization has occurred both in the wild and in captivity and has been documented[290] and verified with DNA testing.[291] The oldest known fossil evidence of polar bears dates around 130,000 to 110,000 years ago;[292] however, molecular data has revealed varying estimates of divergence time. Mitochondrial DNA analysis has given an estimate of 150,000 years ago[292] while nuclear genome analysis has shown an approximate divergence of 603,000 years ago.[293] Recent research using the complete genomes (rather than mtDNA or partial nuclear genomes) establishes the divergence of polar and brown bears between 479-343 thousand years ago.[294] Despite the differences in divergence rates, molecular research suggests the sister species have undergone a highly complex process of speciation and admixture between the two.[295]Polar bears have acquired significant anatomical and physiological differences from the brown bear that allow it to comfortably survive in conditions that the brown bear likely could not. Notable examples include the ability to swim sixty miles or more at a time in freezing waters, fur that blends with the snow, and to stay warm in the arctic environment, an elongated neck that makes it easier to keep their heads above water while swimming, and oversized and heavy-matted webbed feet that act as paddles when swimming. It has also evolved small papillae and vacuole-like suction cups on the soles to make them less likely to slip on the ice, alongside smaller ears for a reduction of heat loss, eyelids that act like sunglasses, accommodations for their all-meat diet, a large stomach capacity to enable opportunistic feeding, and the ability to fast for up to nine months while recycling their urea.[296][297] This example presents a macro-evolutionary change involving an amalgamation of several fields of evolutionary biology, e.g. adaptation through natural selection, geographic isolation, speciation, and hybridization.
Evidence from mathematic modeling
Computer science allows the iteration of self-changing complex systems to be studied, allowing a mathematical understanding of the nature of the processes behind evolution; providing evidence for the hidden causes of known evolutionary events. The evolution of specific cellular mechanisms like spliceosomes that can turn the cell's genome into a vast workshop of billions of interchangeable parts that can create tools that create tools that create tools that create us can be studied for the first time in an exact way."It has taken more than five decades, but the electronic computer is now powerful enough to simulate evolution,"[298] assisting bioinformatics in its attempt to solve biological problems.
Computational evolutionary biology has enabled researchers to trace the evolution of a large number of organisms by measuring changes in their DNA, rather than through physical taxonomy or physiological observations alone. It has compared entire genomes permitting the study of more complex evolutionary events, such as gene duplication, horizontal gene transfer, and the prediction of factors important in speciation. It has also helped build complex computational models of populations to predict the outcome of the system over time and track and share information on an increasingly large number of species and organisms.
Future endeavors are to reconstruct a now more complex tree of life.
Christoph Adami, a professor at the Keck Graduate Institute made this point in Evolution of biological complexity:
- To make a case for or against a trend in the evolution of complexity in biological evolution, complexity must be both rigorously defined and measurable. A recent information-theoretic (but intuitively evident) definition identifies genomic complexity with the amount of information a sequence stores about its environment. We investigate the evolution of genomic complexity in populations of digital organisms and monitor in detail the evolutionary transitions that increase complexity. We show that, because natural selection forces genomes to behave as a natural "Maxwell Demon", within a fixed environment, genomic complexity is forced to increase.[299]
- Not only has life evolved, but life has evolved to evolve. That is, correlations within protein structure have evolved, and mechanisms to manipulate these correlations have evolved in tandem. The rates at which the various events within the hierarchy of evolutionary moves occur are not random or arbitrary but are selected by Darwinian evolution. Sensibly, rapid or extreme environmental change leads to selection for greater evolvability. This selection is not forbidden by causality and is strongest on the largest-scale moves within the mutational hierarchy. Many observations within evolutionary biology, heretofore considered evolutionary happenstance or accidents, are explained by selection for evolvability. For example, the vertebrate immune system shows that the variable environment of antigens has provided selective pressure for the use of adaptable codons and low-fidelity polymerases during somatic hypermutation. A similar driving force for biased codon usage as a result of productively high mutation rates is observed in the hemagglutinin protein of influenza A.[300]

