Search This Blog

Thursday, February 21, 2019

Infrared spectroscopy

From Wikipedia, the free encyclopedia

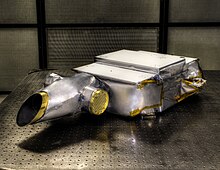
OVIRS instrument of the Osiris-REx probe is a visible and infrared spectrometer
 
Infrared spectroscopy (IR spectroscopy or vibrational spectroscopy) involves the interaction of infrared radiation with matter. It covers a range of techniques, mostly based on absorption spectroscopy. As with all spectroscopic techniques, it can be used to identify and study chemicals. Samples may be solid, liquid, or gas. The method or technique of infrared spectroscopy is conducted with an instrument called an infrared spectrometer (or spectrophotometer) to produce an infrared spectrum. An IR spectrum can be visualized in a graph of infrared light absorbance (or transmittance) on the vertical axis vs. frequency or wavelength on the horizontal axis. Typical units of frequency used in IR spectra are reciprocal centimeters (sometimes called wave numbers), with the symbol cm−1. Units of IR wavelength are commonly given in micrometers (formerly called "microns"), symbol μm, which are related to wave numbers in a reciprocal way. A common laboratory instrument that uses this technique is a Fourier transform infrared (FTIR) spectrometer. Two-dimensional IR is also possible as discussed below

The infrared portion of the electromagnetic spectrum is usually divided into three regions; the near-, mid- and far- infrared, named for their relation to the visible spectrum. The higher-energy near-IR, approximately 14000–4000 cm−1 (0.7–2.5 μm wavelength) can excite overtone or harmonic vibrations. The mid-infrared, approximately 4000–400 cm−1 (2.5–25 μm) may be used to study the fundamental vibrations and associated rotational-vibrational structure. The far-infrared, approximately 400–10 cm−1 (25–1000 μm), lying adjacent to the microwave region, has low energy and may be used for rotational spectroscopy. The names and classifications of these subregions are conventions, and are only loosely based on the relative molecular or electromagnetic properties.

Theory

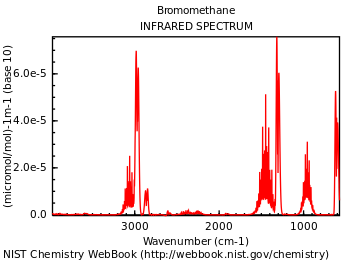
Sample of an IR spec. reading; this one is from bromomethane (CH3Br), showing peaks around 3000, 1300, and 1000 cm−1 (on the horizontal axis).
 
Infrared spectroscopy exploits the fact that molecules absorb frequencies that are characteristic of their structure. These absorptions occur at resonant frequencies, i.e. the frequency of the absorbed radiation matches the vibrational frequency. The energies are affected by the shape of the molecular potential energy surfaces, the masses of the atoms, and the associated vibronic coupling

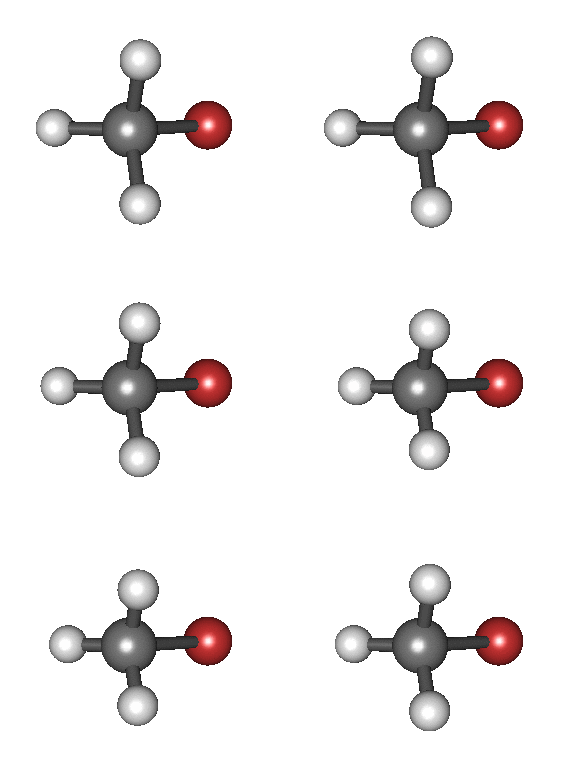
3D animation of the symmetric stretching of the C–H bonds of bromomethane
 
In particular, in the Born–Oppenheimer and harmonic approximations, i.e. when the molecular Hamiltonian corresponding to the electronic ground state can be approximated by a harmonic oscillator in the neighborhood of the equilibrium molecular geometry, the resonant frequencies are associated with the normal modes corresponding to the molecular electronic ground state potential energy surface. The resonant frequencies are also related to the strength of the bond and the mass of the atoms at either end of it. Thus, the frequency of the vibrations are associated with a particular normal mode of motion and a particular bond type.

Number of vibrational modes

In order for a vibrational mode in a sample to be "IR active", it must be associated with changes in the dipole moment. A permanent dipole is not necessary, as the rule requires only a change in dipole moment.

A molecule can vibrate in many ways, and each way is called a vibrational mode. For molecules with N number of atoms, linear molecules have 3N – 5 degrees of vibrational modes, whereas nonlinear molecules have 3N – 6 degrees of vibrational modes (also called vibrational degrees of freedom). As an example H2O, a non-linear molecule, will have 3 × 3 – 6 = 3 degrees of vibrational freedom, or modes. 

Simple diatomic molecules have only one bond and only one vibrational band. If the molecule is symmetrical, e.g. N2, the band is not observed in the IR spectrum, but only in the Raman spectrum. Asymmetrical diatomic molecules, e.g. CO, absorb in the IR spectrum. More complex molecules have many bonds, and their vibrational spectra are correspondingly more complex, i.e. big molecules have many peaks in their IR spectra.

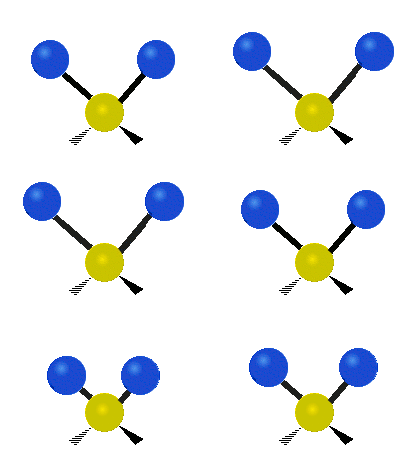
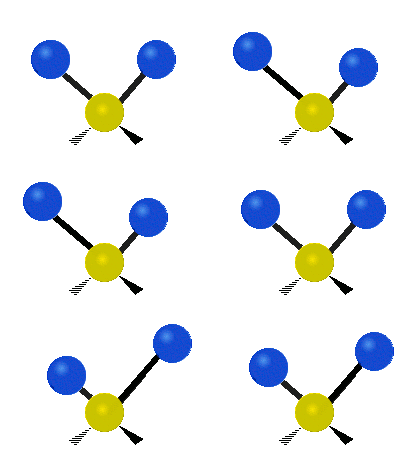
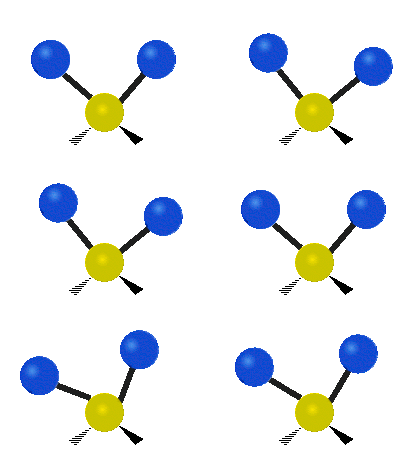
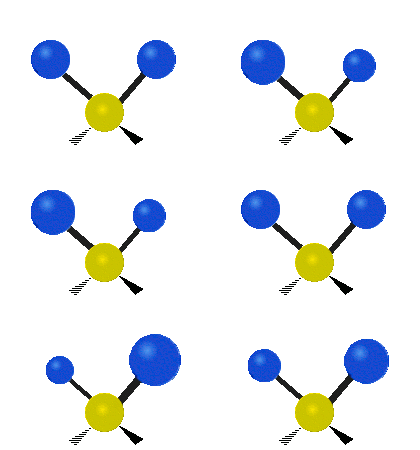
The atoms in a CH2X2 group, commonly found in organic compounds and where X can represent any other atom, can vibrate in nine different ways. Six of these vibrations involve only the CH2 portion: symmetric and antisymmetric stretching, scissoring, rocking, wagging and twisting, as shown below. Structures that do not have the two additional X groups attached have fewer modes because some modes are defined by specific relationships to those other attached groups. For example, in water, the rocking, wagging, and twisting modes do not exist because these types of motions of the H represent simple rotation of the whole molecule rather than vibrations within it. 

Symmetric Antisymmetric
Symmetrical stretching.gif
Symmetric stretching
Asymmetrical stretching.gif
Antisymmetric stretching
Scissoring.gif
Scissoring
Modo rotacao.gif
Rocking
Wagging.gif
Wagging
Twisting.gif
Twisting

These figures do not represent the "recoil" of the C atoms, which, though necessarily present to balance the overall movements of the molecule, are much smaller than the movements of the lighter H atoms.

Special effects

The simplest and most important or fundamental IR bands arise from the excitations of normal modes, the simplest distortions of the molecule, from the ground state with vibrational quantum number v = 0 to the first excited state with vibrational quantum number v = 1. In some cases, overtone bands are observed. An overtone band arises from the absorption of a photon leading to a direct transition from the ground state to the second excited vibrational state (v = 2). Such a band appears at approximately twice the energy of the fundamental band for the same normal mode. Some excitations, so-called combination modes, involve simultaneous excitation of more than one normal mode. The phenomenon of Fermi resonance can arise when two modes are similar in energy; Fermi resonance results in an unexpected shift in energy and intensity of the bands etc.

Practical IR spectroscopy

The infrared spectrum of a sample is recorded by passing a beam of infrared light through the sample. When the frequency of the IR is the same as the vibrational frequency of a bond or collection of bonds, absorption occurs. Examination of the transmitted light reveals how much energy was absorbed at each frequency (or wavelength). This measurement can be achieved by scanning the wavelength range using a monochromator. Alternatively, the entire wavelength range is measured using a Fourier transform instrument and then a transmittance or absorbance spectrum is generated using a dedicated procedure. 

This technique is commonly used for analyzing samples with covalent bonds. Simple spectra are obtained from samples with few IR active bonds and high levels of purity. More complex molecular structures lead to more absorption bands and more complex spectra. 

Typical IR solution cell. The windows are CaF2.

Sample preparation

Gaseous samples require a sample cell with a long pathlength to compensate for the diluteness. The path length of the sample cell depends on the concentration of the compound of interest. A simple glass tube with length of 5 to 10 cm equipped with infrared-transparent windows at the both ends of the tube can be used for concentrations down to several hundred ppm. Sample gas concentrations well below ppm can be measured with a White's cell in which the infrared light is guided with mirrors to travel through the gas. White's cells are available with optical path length starting from 0.5 m up to hundred meters. 

Liquid samples can be sandwiched between two plates of a salt (commonly sodium chloride, or common salt, although a number of other salts such as potassium bromide or calcium fluoride are also used). The plates are transparent to the infrared light and do not introduce any lines onto the spectra. 

Solid samples can be prepared in a variety of ways. One common method is to crush the sample with an oily mulling agent (usually mineral oil Nujol). A thin film of the mull is applied onto salt plates and measured. The second method is to grind a quantity of the sample with a specially purified salt (usually potassium bromide) finely (to remove scattering effects from large crystals). This powder mixture is then pressed in a mechanical press to form a translucent pellet through which the beam of the spectrometer can pass. A third technique is the "cast film" technique, which is used mainly for polymeric materials. The sample is first dissolved in a suitable, non hygroscopic solvent. A drop of this solution is deposited on surface of KBr or NaCl cell. The solution is then evaporated to dryness and the film formed on the cell is analysed directly. Care is important to ensure that the film is not too thick otherwise light cannot pass through. This technique is suitable for qualitative analysis. The final method is to use microtomy to cut a thin (20–100 µm) film from a solid sample. This is one of the most important ways of analyzing failed plastic products for example because the integrity of the solid is preserved.

In photoacoustic spectroscopy the need for sample treatment is minimal. The sample, liquid or solid, is placed into the sample cup which is inserted into the photoacoustic cell which is then sealed for the measurement. The sample may be one solid piece, powder or basically in any form for the measurement. For example, a piece of rock can be inserted into the sample cup and the spectrum measured from it.

Comparing to a reference

Schematics of a two-beam absorption spectrometer. A beam of infrared light is produced, passed through an interferometer (not shown), and then split into two separate beams. One is passed through the sample, the other passed through a reference. The beams are both reflected back towards a detector, however first they pass through a splitter, which quickly alternates which of the two beams enters the detector. The two signals are then compared and a printout is obtained. This "two-beam" setup gives accurate spectra even if the intensity of the light source drifts over time.
 
It is typical to record spectrum of both the sample and a "reference". This step controls for a number of variables, e.g. infrared detector, which may affect the spectrum. The reference measurement makes it possible to eliminate the instrument influence.

The appropriate "reference" depends on the measurement and its goal. The simplest reference measurement is to simply remove the sample (replacing it by air). However, sometimes a different reference is more useful. For example, if the sample is a dilute solute dissolved in water in a beaker, then a good reference measurement might be to measure pure water in the same beaker. Then the reference measurement would cancel out not only all the instrumental properties (like what light source is used), but also the light-absorbing and light-reflecting properties of the water and beaker, and the final result would just show the properties of the solute (at least approximately). 

A common way to compare to a reference is sequentially: first measure the reference, then replace the reference by the sample and measure the sample. This technique is not perfectly reliable; if the infrared lamp is a bit brighter during the reference measurement, then a bit dimmer during the sample measurement, the measurement will be distorted. More elaborate methods, such as a "two-beam" setup (see figure), can correct for these types of effects to give very accurate results. The Standard addition method can be used to statistically cancel these errors. 

Nevertheless, among different absorption based techniques which are used for gaseous species detection, Cavity ring-down spectroscopy (CRDS) can be used as a calibration free method. The fact that CRDS is based on the measurements of photon life-times (and not the laser intensity) makes it needless for any calibration and comparison with a reference 

FTIR

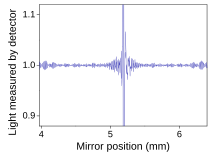
An interferogram from an FTIR measurement. The horizontal axis is the position of the mirror, and the vertical axis is the amount of light detected. This is the "raw data" which can be Fourier transformed to get the actual spectrum.
 
Fourier transform infrared (FTIR) spectroscopy is a measurement technique that allows one to record infrared spectra. Infrared light is guided through an interferometer and then through the sample (or vice versa). A moving mirror inside the apparatus alters the distribution of infrared light that passes through the interferometer. The signal directly recorded, called an "interferogram", represents light output as a function of mirror position. A data-processing technique called Fourier transform turns this raw data into the desired result (the sample's spectrum): Light output as a function of infrared wavelength (or equivalently, wavenumber). As described above, the sample's spectrum is always compared to a reference. 

An alternate method for acquiring spectra is the "dispersive" or "scanning monochromator" method. In this approach, the sample is irradiated sequentially with various single wavelengths. The dispersive method is more common in UV-Vis spectroscopy, but is less practical in the infrared than the FTIR method. One reason that FTIR is favored is called "Fellgett's advantage" or the "multiplex advantage": The information at all frequencies is collected simultaneously, improving both speed and signal-to-noise ratio. Another is called "Jacquinot's Throughput Advantage": A dispersive measurement requires detecting much lower light levels than an FTIR measurement. There are other advantages, as well as some disadvantages, but virtually all modern infrared spectrometers are FTIR instruments.

Absorption bands

IR spectroscopy is often used to identify structures because functional groups give rise to characteristic bands both in terms of intensity and position (frequency). The positions of these bands are summarized in correlation tables as shown below. 

List of main IR spectroscopy bands. For example, the carboxyl group will contain a C = O band at 1700 cm−1 and an OH band at 3500 cm−1 (total group -COOH). Wavenumbers listed in cm−1.

Regions

A spectrograph is often interpreted as having two regions.
  • functional group region
In the functional region there are one to a few troughs per functional group.
  • fingerprint region
In the fingerprint region there are many troughs which form an intricate pattern which can be used like a fingerprint to determine the compound.

Badger's rule

For many kinds of samples, the assignments are known, i.e. which bond deformation(s) are associated with which frequency. In such cases further information can be gleaned about the strength on a bond, relying on the empirical guideline called Badger's Rule. Originally published by Richard Badger in 1934, this rule states that the strength of a bond correlates with the frequency of its vibrational mode. That is, increase in bond strength leads to corresponding frequency increase and vice versa.

Uses and applications

US Food and Drug Administration scientist uses portable near infrared spectroscopy device to detect potentially illegal substances
 
Infrared spectroscopy is a simple and reliable technique widely used in both organic and inorganic chemistry, in research and industry. It is used in quality control, dynamic measurement, and monitoring applications such as the long-term unattended measurement of CO2 concentrations in greenhouses and growth chambers by infrared gas analyzers. 

It is also used in forensic analysis in both criminal and civil cases, for example in identifying polymer degradation. It can be used in determining the blood alcohol content of a suspected drunk driver. 

IR-spectroscopy has been successfully used in analysis and identification of pigments in paintings and other art objects such as illuminated manuscripts.

A useful way of analyzing solid samples without the need for cutting samples uses ATR or attenuated total reflectance spectroscopy. Using this approach, samples are pressed against the face of a single crystal. The infrared radiation passes through the crystal and only interacts with the sample at the interface between the two materials. 

With increasing technology in computer filtering and manipulation of the results, samples in solution can now be measured accurately (water produces a broad absorbance across the range of interest, and thus renders the spectra unreadable without this computer treatment).

Some instruments also automatically identify the substance being measured from a store of thousands of reference spectra held in storage.

Infrared spectroscopy is also useful in measuring the degree of polymerization in polymer manufacture. Changes in the character or quantity of a particular bond are assessed by measuring at a specific frequency over time. Modern research instruments can take infrared measurements across the range of interest as frequently as 32 times a second. This can be done whilst simultaneous measurements are made using other techniques. This makes the observations of chemical reactions and processes quicker and more accurate. 

Infrared spectroscopy has also been successfully utilized in the field of semiconductor microelectronics: for example, infrared spectroscopy can be applied to semiconductors like silicon, gallium arsenide, gallium nitride, zinc selenide, amorphous silicon, silicon nitride, etc. 

Another important application of Infrared Spectroscopy is in the food industry to measure the concentration of various compounds in different food products.

The instruments are now small, and can be transported, even for use in field trials. 

Infrared Spectroscopy is also used in gas leak detection devices such as the DP-IR and EyeCGAs. These devices detect hydrocarbon gas leaks in the transportation of natural gas and crude oil. 

In February 2014, NASA announced a greatly upgraded database, based on IR spectroscopy, for tracking polycyclic aromatic hydrocarbons (PAHs) in the universe. According to scientists, more than 20% of the carbon in the universe may be associated with PAHs, possible starting materials for the formation of life. PAHs seem to have been formed shortly after the Big Bang, are widespread throughout the universe, and are associated with new stars and exoplanets.

Recent developments include a miniature IR-spectrometer that's linked to a cloud based database and suitable for personal everyday use, and NIR-spectroscopic chips that can be embedded in smartphones and various gadgets.

Isotope effects

The different isotopes in a particular species may exhibit different fine details in infrared spectroscopy. For example, the O–O stretching frequency (in reciprocal centimeters) of oxyhemocyanin is experimentally determined to be 832 and 788 cm−1 for ν(16O–16O) and ν(18O–18O), respectively. 

By considering the O–O bond as a spring, the wavenumber of absorbance, ν can be calculated:
where k is the spring constant for the bond, c is the speed of light, and μ is the reduced mass of the A–B system:
( is the mass of atom ).
The reduced masses for 16O–16O and 18O–18O can be approximated as 8 and 9 respectively. Thus
Where is the wavenumber; [wavenumber = frequency/(speed of light)]

The effect of isotopes, both on the vibration and the decay dynamics, has been found to be stronger than previously thought. In some systems, such as silicon and germanium, the decay of the anti-symmetric stretch mode of interstitial oxygen involves the symmetric stretch mode with a strong isotope dependence. For example, it was shown that for a natural silicon sample, the lifetime of the anti-symmetric vibration is 11.4 ps. When the isotope of one of the silicon atoms is increased to 29Si, the lifetime increases to 19 ps. In similar manner, when the silicon atom is changed to 30Si, the lifetime becomes 27 ps.

Two-dimensional IR

Two-dimensional infrared correlation spectroscopy analysis combines multiple samples of infrared spectra to reveal more complex properties. By extending the spectral information of a perturbed sample, spectral analysis is simplified and resolution is enhanced. The 2D synchronous and 2D asynchronous spectra represent a graphical overview of the spectral changes due to a perturbation (such as a changing concentration or changing temperature) as well as the relationship between the spectral changes at two different wavenumbers.

Pulse Sequence used to obtain a two-dimensional Fourier transform infrared spectrum. The time period is usually referred to as the coherence time and the second time period is known as the waiting time. The excitation frequency is obtained by Fourier transforming along the axis.
 
Nonlinear two-dimensional infrared spectroscopy is the infrared version of correlation spectroscopy. Nonlinear two-dimensional infrared spectroscopy is a technique that has become available with the development of femtosecond infrared laser pulses. In this experiment, first a set of pump pulses is applied to the sample. This is followed by a waiting time during which the system is allowed to relax. The typical waiting time lasts from zero to several picoseconds, and the duration can be controlled with a resolution of tens of femtoseconds. A probe pulse is then applied, resulting in the emission of a signal from the sample. The nonlinear two-dimensional infrared spectrum is a two-dimensional correlation plot of the frequency ω1 that was excited by the initial pump pulses and the frequency ω3 excited by the probe pulse after the waiting time. This allows the observation of coupling between different vibrational modes; because of its extremely fine time resolution, it can be used to monitor molecular dynamics on a picosecond timescale. It is still a largely unexplored technique and is becoming increasingly popular for fundamental research.

As with two-dimensional nuclear magnetic resonance (2DNMR) spectroscopy, this technique spreads the spectrum in two dimensions and allows for the observation of cross peaks that contain information on the coupling between different modes. In contrast to 2DNMR, nonlinear two-dimensional infrared spectroscopy also involves the excitation to overtones. These excitations result in excited state absorption peaks located below the diagonal and cross peaks. In 2DNMR, two distinct techniques, COSY and NOESY, are frequently used. The cross peaks in the first are related to the scalar coupling, while in the latter they are related to the spin transfer between different nuclei. In nonlinear two-dimensional infrared spectroscopy, analogs have been drawn to these 2DNMR techniques. Nonlinear two-dimensional infrared spectroscopy with zero waiting time corresponds to COSY, and nonlinear two-dimensional infrared spectroscopy with finite waiting time allowing vibrational population transfer corresponds to NOESY. The COSY variant of nonlinear two-dimensional infrared spectroscopy has been used for determination of the secondary structure content of proteins.
Absorption spectroscopy

From Wikipedia, the free encyclopedia

An overview of electromagnetic radiation absorption. This example discusses the general principle using visible light as a specific example. A white beam source – emitting light of multiple wavelengths – is focused on a sample (the complementary color pairs are indicated by the yellow dotted lines). Upon striking the sample, photons that match the energy gap of the molecules present (green light in this example) are absorbed in order to excite the molecule. Other photons transmit unaffected and, if the radiation is in the visible region (400-700nm), the sample color is the complementary color of the absorbed light. By comparing the attenuation of the transmitted light with the incident, an absorption spectrum can be obtained.
 
The first direct detection and chemical analysis of the atmosphere of an exoplanet, in 2001. Sodium in the atmosphere filters the starlight of HD 209458 as the giant planet passes in front of the star.
 
Absorption spectroscopy refers to spectroscopic techniques that measure the absorption of radiation, as a function of frequency or wavelength, due to its interaction with a sample. The sample absorbs energy, i.e., photons, from the radiating field. The intensity of the absorption varies as a function of frequency, and this variation is the absorption spectrum. Absorption spectroscopy is performed across the electromagnetic spectrum

Absorption spectroscopy is employed as an analytical chemistry tool to determine the presence of a particular substance in a sample and, in many cases, to quantify the amount of the substance present. Infrared and ultraviolet-visible spectroscopy are particularly common in analytical applications. Absorption spectroscopy is also employed in studies of molecular and atomic physics, astronomical spectroscopy and remote sensing.

There are a wide range of experimental approaches for measuring absorption spectra. The most common arrangement is to direct a generated beam of radiation at a sample and detect the intensity of the radiation that passes through it. The transmitted energy can be used to calculate the absorption. The source, sample arrangement and detection technique vary significantly depending on the frequency range and the purpose of the experiment.

Absorption spectrum

Solar spectrum with Fraunhofer lines as it appears visually.
 
A material's absorption spectrum is the fraction of incident radiation absorbed by the material over a range of frequencies. The absorption spectrum is primarily determined by the atomic and molecular composition of the material. Radiation is more likely to be absorbed at frequencies that match the energy difference between two quantum mechanical states of the molecules. The absorption that occurs due to a transition between two states is referred to as an absorption line and a spectrum is typically composed of many lines.

The frequencies where absorption lines occur, as well as their relative intensities, primarily depend on the electronic and molecular structure of the sample. The frequencies will also depend on the interactions between molecules in the sample, the crystal structure in solids, and on several environmental factors (e.g., temperature, pressure, electromagnetic field). The lines will also have a width and shape that are primarily determined by the spectral density or the density of states of the system.

Theory

Absorption lines are typically classified by the nature of the quantum mechanical change induced in the molecule or atom. Rotational lines, for instance, occur when the rotational state of a molecule is changed. Rotational lines are typically found in the microwave spectral region. Vibrational lines correspond to changes in the vibrational state of the molecule and are typically found in the infrared region. Electronic lines correspond to a change in the electronic state of an atom or molecule and are typically found in the visible and ultraviolet region. X-ray absorption is associated with the excitation of inner shell electrons in atoms. These changes can also be combined (e.g. rotation-vibration transitions), leading to new absorption lines at the combined energy of the two changes.

The energy associated with the quantum mechanical change primarily determines the frequency of the absorption line but the frequency can be shifted by several types of interactions. Electric and magnetic fields can cause a shift. Interactions with neighboring molecules can cause shifts. For instance, absorption lines of the gas phase molecule can shift significantly when that molecule is in a liquid or solid phase and interacting more strongly with neighboring molecules.

The width and shape of absorption lines are determined by the instrument used for the observation, the material absorbing the radiation and the physical environment of that material. It is common for lines to have the shape of a Gaussian or Lorentzian distribution. It is also common for a line to be described solely by its intensity and width instead of the entire shape being characterized.

The integrated intensity—obtained by integrating the area under the absorption line—is proportional to the amount of the absorbing substance present. The intensity is also related to the temperature of the substance and the quantum mechanical interaction between the radiation and the absorber. This interaction is quantified by the transition moment and depends on the particular lower state the transition starts from, and the upper state it is connected to.

The width of absorption lines may be determined by the spectrometer used to record it. A spectrometer has an inherent limit on how narrow a line it can resolve and so the observed width may be at this limit. If the width is larger than the resolution limit, then it is primarily determined by the environment of the absorber. A liquid or solid absorber, in which neighboring molecules strongly interact with one another, tends to have broader absorption lines than a gas. Increasing the temperature or pressure of the absorbing material will also tend to increase the line width. It is also common for several neighboring transitions to be close enough to one another that their lines overlap and the resulting overall line is therefore broader yet.

Relation to transmission spectrum

Absorption and transmission spectra represent equivalent information and one can be calculated from the other through a mathematical transformation. A transmission spectrum will have its maximum intensities at wavelengths where the absorption is weakest because more light is transmitted through the sample. An absorption spectrum will have its maximum intensities at wavelengths where the absorption is strongest.

Relation to emission spectrum

Emission spectrum of iron
 
Emission is a process by which a substance releases energy in the form of electromagnetic radiation. Emission can occur at any frequency at which absorption can occur, and this allows the absorption lines to be determined from an emission spectrum. The emission spectrum will typically have a quite different intensity pattern from the absorption spectrum, though, so the two are not equivalent. The absorption spectrum can be calculated from the emission spectrum using appropriate theoretical models and additional information about the quantum mechanical states of the substance.

Relation to scattering and reflection spectra

The scattering and reflection spectra of a material are influenced by both its index of refraction and its absorption spectrum. In an optical context, the absorption spectrum is typically quantified by the extinction coefficient, and the extinction and index coefficients are quantitatively related through the Kramers-Kronig relation. Therefore, the absorption spectrum can be derived from a scattering or reflection spectrum. This typically requires simplifying assumptions or models, and so the derived absorption spectrum is an approximation.

Applications

The infrared absorption spectrum of NASA laboratory sulfur dioxide ice is compared with the infrared absorption spectra of ices on Jupiter's moon, Io credit NASA, Bernard Schmitt, and UKIRT.
 
Absorption spectroscopy is useful in chemical analysis because of its specificity and its quantitative nature. The specificity of absorption spectra allows compounds to be distinguished from one another in a mixture, making absorption spectroscopy useful in wide variety of applications. For instance, Infrared gas analyzers can be used to identify the presence of pollutants in the air, distinguishing the pollutant from nitrogen, oxygen, water and other expected constituents.

The specificity also allows unknown samples to be identified by comparing a measured spectrum with a library of reference spectra. In many cases, it is possible to determine qualitative information about a sample even if it is not in a library. Infrared spectra, for instance, have characteristics absorption bands that indicate if carbon-hydrogen or carbon-oxygen bonds are present. 

An absorption spectrum can be quantitatively related to the amount of material present using the Beer-Lambert law. Determining the absolute concentration of a compound requires knowledge of the compound's absorption coefficient. The absorption coefficient for some compounds is available from reference sources, and it can also be determined by measuring the spectrum of a calibration standard with a known concentration of the target.

Remote sensing

One of the unique advantages of spectroscopy as an analytical technique is that measurements can be made without bringing the instrument and sample into contact. Radiation that travels between a sample and an instrument will contain the spectral information, so the measurement can be made remotely. Remote spectral sensing is valuable in many situations. For example, measurements can be made in toxic or hazardous environments without placing an operator or instrument at risk. Also, sample material does not have to be brought into contact with the instrument—preventing possible cross contamination. 

Remote spectral measurements present several challenges compared to laboratory measurements. The space in between the sample of interest and the instrument may also have spectral absorptions. These absorptions can mask or confound the absorption spectrum of the sample. These background interferences may also vary over time. The source of radiation in remote measurements is often an environmental source, such as sunlight or the thermal radiation from a warm object, and this makes it necessary to distinguish spectral absorption from changes in the source spectrum. 

To simplify these challenges, Differential optical absorption spectroscopy has gained some popularity, as it focuses on differential absorption features and omits broad-band absorption such as aerosol extinction and extinction due to Rayleigh scattering. This method is applied to ground-based, air-borne and satellite based measurements. Some ground-based methods provide the possibility to retrieve tropospheric and stratospheric trace gas profiles.

Astronomy

Absorption spectrum observed by the Hubble Space Telescope
 
Astronomical spectroscopy is a particularly significant type of remote spectral sensing. In this case, the objects and samples of interest are so distant from earth that electromagnetic radiation is the only means available to measure them. Astronomical spectra contain both absorption and emission spectral information. Absorption spectroscopy has been particularly important for understanding interstellar clouds and determining that some of them contain molecules. Absorption spectroscopy is also employed in the study of extrasolar planets. Detection of extrasolar planets by the transit method also measures their absorption spectrum and allows for the determination of the planet's atmospheric composition, temperature, pressure, and scale height, and hence allows also for the determination of the planet's mass.

Atomic and molecular physics

Theoretical models, principally quantum mechanical models, allow for the absorption spectra of atoms and molecules to be related to other physical properties such as electronic structure, atomic or molecular mass, and molecular geometry. Therefore, measurements of the absorption spectrum are used to determine these other properties. Microwave spectroscopy, for example, allows for the determination of bond lengths and angles with high precision.

In addition, spectral measurements can be used to determine the accuracy of theoretical predictions. For example, the Lamb shift measured in the hydrogen atomic absorption spectrum was not expected to exist at the time it was measured. Its discovery spurred and guided the development of quantum electrodynamics, and measurements of the Lamb shift are now used to determine the fine-structure constant.

Experimental methods

Basic approach

The most straightforward approach to absorption spectroscopy is to generate radiation with a source, measure a reference spectrum of that radiation with a detector and then re-measure the sample spectrum after placing the material of interest in between the source and detector. The two measured spectra can then be combined to determine the material's absorption spectrum. The sample spectrum alone is not sufficient to determine the absorption spectrum because it will be affected by the experimental conditions—the spectrum of the source, the absorption spectra of other materials in between the source and detector and the wavelength dependent characteristics of the detector. The reference spectrum will be affected in the same way, though, by these experimental conditions and therefore the combination yields the absorption spectrum of the material alone.

A wide variety of radiation sources are employed in order to cover the electromagnetic spectrum. For spectroscopy, it is generally desirable for a source to cover a broad swath of wavelengths in order to measure a broad region of the absorption spectrum. Some sources inherently emit a broad spectrum. Examples of these include globars or other black body sources in the infrared, mercury lamps in the visible and ultraviolet and x-ray tubes. One recently developed, novel source of broad spectrum radiation is synchrotron radiation which covers all of these spectral regions. Other radiation sources generate a narrow spectrum but the emission wavelength can be tuned to cover a spectral range. Examples of these include klystrons in the microwave region and lasers across the infrared, visible and ultraviolet region (though not all lasers have tunable wavelengths). 

The detector employed to measure the radiation power will also depend on the wavelength range of interest. Most detectors are sensitive to a fairly broad spectral range and the sensor selected will often depend more on the sensitivity and noise requirements of a given measurement. Examples of detectors common in spectroscopy include heterodyne receivers in the microwave, bolometers in the millimeter-wave and infrared, mercury cadmium telluride and other cooled semiconductor detectors in the infrared, and photodiodes and photomultiplier tubes in the visible and ultraviolet. 

If both the source and the detector cover a broad spectral region, then it is also necessary to introduce a means of resolving the wavelength of the radiation in order to determine the spectrum. Often a spectrograph is used to spatially separate the wavelengths of radiation so that the power at each wavelength can be measured independently. It is also common to employ interferometry to determine the spectrum—Fourier transform infrared spectroscopy is a widely used implementation of this technique. 

Two other issues that must be considered in setting up an absorption spectroscopy experiment include the optics used to direct the radiation and the means of holding or containing the sample material (called a cuvette or cell). For most UV, visible, and NIR measurements the use of precision quartz cuvettes are necessary. In both cases, it is important to select materials that have relatively little absorption of their own in the wavelength range of interest. The absorption of other materials could interfere with or mask the absorption from the sample. For instance, in several wavelength ranges it is necessary to measure the sample under vacuum or in a rare gas environment because gases in the atmosphere have interfering absorption features.

Specific approaches

Spectroscopy (updated)

From Wikipedia, the free encyclopedia

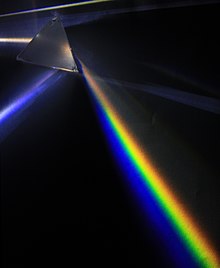
Analysis of white light by dispersing it with a prism is an example of spectroscopy.

Spectroscopy is the study of the interaction between matter and electromagnetic radiation. Historically, spectroscopy originated through the study of visible light dispersed according to its wavelength, by a prism. Later the concept was expanded greatly to include any interaction with radiative energy as a function of its wavelength or frequency, predominantly in the electromagnetic spectrum, though matter waves and acoustic waves can also be considered forms of radiative energy; recently, with tremendous difficulty, even gravitational waves have been associated with a spectral signature in the context of LIGO and laser interferometry. Spectroscopic data are often represented by an emission spectrum, a plot of the response of interest as a function of wavelength or frequency.

Spectroscopy, primarily in the electromagnetic spectrum, is a fundamental exploratory tool in the fields of physics, chemistry, and astronomy, allowing the composition, physical structure and electronic structure of matter to be investigated at atomic scale, molecular scale, macro scale, and over astronomical distances. Important applications arise from biomedical spectroscopy in the areas of tissue analysis and medical imaging.

Introduction

Spectroscopy and spectrography are terms used to refer to the measurement of radiation intensity as a function of wavelength and are often used to describe experimental spectroscopic methods. Spectral measurement devices are referred to as spectrometers, spectrophotometers, spectrographs or spectral analyzers

Daily observations of color can be related to spectroscopy. Neon lighting is a direct application of atomic spectroscopy. Neon and other noble gases have characteristic emission frequencies (colors). Neon lamps use collision of electrons with the gas to excite these emissions. Inks, dyes and paints include chemical compounds selected for their spectral characteristics in order to generate specific colors and hues. A commonly encountered molecular spectrum is that of nitrogen dioxide. Gaseous nitrogen dioxide has a characteristic red absorption feature, and this gives air polluted with nitrogen dioxide a reddish-brown color. Rayleigh scattering is a spectroscopic scattering phenomenon that accounts for the color of the sky. 

Spectroscopic studies were central to the development of quantum mechanics and included Max Planck's explanation of blackbody radiation, Albert Einstein's explanation of the photoelectric effect and Niels Bohr's explanation of atomic structure and spectra. Spectroscopy is used in physical and analytical chemistry because atoms and molecules have unique spectra. As a result, these spectra can be used to detect, identify and quantify information about the atoms and molecules. Spectroscopy is also used in astronomy and remote sensing on Earth. Most research telescopes have spectrographs. The measured spectra are used to determine the chemical composition and physical properties of astronomical objects (such as their temperature and velocity).

Theory

One of the central concepts in spectroscopy is a resonance and its corresponding resonant frequency. Resonances were first characterized in mechanical systems such as pendulums. Mechanical systems that vibrate or oscillate will experience large amplitude oscillations when they are driven at their resonant frequency. A plot of amplitude vs. excitation frequency will have a peak centered at the resonance frequency. This plot is one type of spectrum, with the peak often referred to as a spectral line, and most spectral lines have a similar appearance.

In quantum mechanical systems, the analogous resonance is a coupling of two quantum mechanical stationary states of one system, such as an atom, via an oscillatory source of energy such as a photon. The coupling of the two states is strongest when the energy of the source matches the energy difference between the two states. The energy of a photon is related to its frequency by where is Planck's constant, and so a spectrum of the system response vs. photon frequency will peak at the resonant frequency or energy. Particles such as electrons and neutrons have a comparable relationship, the de Broglie relations, between their kinetic energy and their wavelength and frequency and therefore can also excite resonant interactions.

Spectra of atoms and molecules often consist of a series of spectral lines, each one representing a resonance between two different quantum states. The explanation of these series, and the spectral patterns associated with them, were one of the experimental enigmas that drove the development and acceptance of quantum mechanics. The hydrogen spectral series in particular was first successfully explained by the Rutherford-Bohr quantum model of the hydrogen atom. In some cases spectral lines are well separated and distinguishable, but spectral lines can also overlap and appear to be a single transition if the density of energy states is high enough. Named series of lines include the principal, sharp, diffuse and fundamental series.

Classification of methods

A huge diffraction grating at the heart of the ultra-precise ESPRESSO spectrograph.
 
Spectroscopy is a sufficiently broad field that many sub-disciplines exist, each with numerous implementations of specific spectroscopic techniques. The various implementations and techniques can be classified in several ways.

Type of radiative energy

The types of spectroscopy are distinguished by the type of radiative energy involved in the interaction. In many applications, the spectrum is determined by measuring changes in the intensity or frequency of this energy. The types of radiative energy studied include:

Nature of the interaction

The types of spectroscopy also can be distinguished by the nature of the interaction between the energy and the material. These interactions include:
  • Absorption spectroscopy: Absorption occurs when energy from the radiative source is absorbed by the material. Absorption is often determined by measuring the fraction of energy transmitted through the material, with absorption decreasing the transmitted portion.
  • Emission spectroscopy: Emission indicates that radiative energy is released by the material. A material's blackbody spectrum is a spontaneous emission spectrum determined by its temperature. This feature can be measured in the infrared by instruments such as the atmospheric emitted radiance interferometer. Emission can also be induced by other sources of energy such as flames or sparks or electromagnetic radiation in the case of fluorescence.
  • Elastic scattering and reflection spectroscopy determine how incident radiation is reflected or scattered by a material. Crystallography employs the scattering of high energy radiation, such as x-rays and electrons, to examine the arrangement of atoms in proteins and solid crystals.
  • Impedance spectroscopy: Impedance is the ability of a medium to impede or slow the transmittance of energy. For optical applications, this is characterized by the index of refraction.
  • Inelastic scattering phenomena involve an exchange of energy between the radiation and the matter that shifts the wavelength of the scattered radiation. These include Raman and Compton scattering.
  • Coherent or resonance spectroscopy are techniques where the radiative energy couples two quantum states of the material in a coherent interaction that is sustained by the radiating field. The coherence can be disrupted by other interactions, such as particle collisions and energy transfer, and so often require high intensity radiation to be sustained. Nuclear magnetic resonance (NMR) spectroscopy is a widely used resonance method, and ultrafast laser spectroscopy is also possible in the infrared and visible spectral regions.

Type of material

Spectroscopic studies are designed so that the radiant energy interacts with specific types of matter.

Atoms

Atomic spectroscopy was the first application of spectroscopy developed. Atomic absorption spectroscopy and atomic emission spectroscopy involve visible and ultraviolet light. These absorptions and emissions, often referred to as atomic spectral lines, are due to electronic transitions of outer shell electrons as they rise and fall from one electron orbit to another. Atoms also have distinct x-ray spectra that are attributable to the excitation of inner shell electrons to excited states.

Atoms of different elements have distinct spectra and therefore atomic spectroscopy allows for the identification and quantitation of a sample's elemental composition. After inventing the spectroscope, Robert Bunsen and Gustav Kirchhoff discovered new elements by observing their emission spectra. Atomic absorption lines are observed in the solar spectrum and referred to as Fraunhofer lines after their discoverer. A comprehensive explanation of the hydrogen spectrum was an early success of quantum mechanics and explained the Lamb shift observed in the hydrogen spectrum, which further led to the development of quantum electrodynamics

Modern implementations of atomic spectroscopy for studying visible and ultraviolet transitions include flame emission spectroscopy, inductively coupled plasma atomic emission spectroscopy, glow discharge spectroscopy, microwave induced plasma spectroscopy, and spark or arc emission spectroscopy. Techniques for studying x-ray spectra include X-ray spectroscopy and X-ray fluorescence.

Molecules

The combination of atoms into molecules leads to the creation of unique types of energetic states and therefore unique spectra of the transitions between these states. Molecular spectra can be obtained due to electron spin states (electron paramagnetic resonance), molecular rotations, molecular vibration, and electronic states. Rotations are collective motions of the atomic nuclei and typically lead to spectra in the microwave and millimeter-wave spectral regions. Rotational spectroscopy and microwave spectroscopy are synonymous. Vibrations are relative motions of the atomic nuclei and are studied by both infrared and Raman spectroscopy. Electronic excitations are studied using visible and ultraviolet spectroscopy as well as fluorescence spectroscopy

Studies in molecular spectroscopy led to the development of the first maser and contributed to the subsequent development of the laser.

Crystals and extended materials

The combination of atoms or molecules into crystals or other extended forms leads to the creation of additional energetic states. These states are numerous and therefore have a high density of states. This high density often makes the spectra weaker and less distinct, i.e., broader. For instance, blackbody radiation is due to the thermal motions of atoms and molecules within a material. Acoustic and mechanical responses are due to collective motions as well. Pure crystals, though, can have distinct spectral transitions, and the crystal arrangement also has an effect on the observed molecular spectra. The regular lattice structure of crystals also scatters x-rays, electrons or neutrons allowing for crystallographic studies.

Nuclei

Nuclei also have distinct energy states that are widely separated and lead to gamma ray spectra. Distinct nuclear spin states can have their energy separated by a magnetic field, and this allows for nuclear magnetic resonance spectroscopy.

Other types

Other types of spectroscopy are distinguished by specific applications or implementations:

Applications

UVES is a high-resolution spectrograph on the Very Large Telescope.
  • Cure monitoring of composites using optical fibers.
  • Estimate weathered wood exposure times using near infrared spectroscopy.
  • Measurement of different compounds in food samples by absorption spectroscopy both in visible and infrared spectrum.
  • Measurement of toxic compounds in blood samples
  • Non-destructive elemental analysis by X-ray fluorescence.
  • Electronic structure research with various spectroscopes.

History

The history of spectroscopy began with Isaac Newton's optics experiments (1666–1672). Newton applied the word "spectrum" to describe the rainbow of colors that combine to form white light and that are revealed when the white light is passed through a prism. During the early 1800s, Joseph von Fraunhofer made experimental advances with dispersive spectrometers that enabled spectroscopy to become a more precise and quantitative scientific technique. Since then, spectroscopy has played and continues to play a significant role in chemistry, physics, and astronomy.
  • "In 1672, in the first paper that he submitted to the Royal Society, Isaac Newton described an experiment in which he permitted sunlight to pass through a small hole and then through a prism. Newton found that sunlight, which looks white to us, is actually made up of a mixture of all the colors of the rainbow."
  • "In 1802, William Hyde Wollaston built an improved spectrometer that included a lens to focus the Sun’s spectrum on a screen. Upon use, Wollaston realized that the colors were not spread uniformly, but instead had missing patches of colors, which appeared as dark bands in the spectrum. Later, in 1815, German physicist Joseph Fraunhofer also examined the solar spectrum, and found about 600 such dark lines (missing colors), which are now known as Fraunhofer lines, or Absorption lines."

Introduction to entropy

From Wikipedia, the free encyclopedia https://en.wikipedia.org/wiki/Introduct...