Search This Blog

Wednesday, May 21, 2025

Ethology

From Wikipedia, the free encyclopedia
https://en.wikipedia.org/wiki/Ethology
Honeybee workers perform the waggle dance to indicate the range and direction of food.
Great crested grebes perform a complex synchronised courtship display.
Male impalas fighting during the rut

Ethology is a branch of zoology that studies the behaviour of non-human animals. It has its scientific roots in the work of Charles Darwin and of American and German ornithologists of the late 19th and early 20th century, including Charles O. Whitman, Oskar Heinroth, and Wallace Craig. The modern discipline of ethology is generally considered to have begun during the 1930s with the work of the Dutch biologist Nikolaas Tinbergen and the Austrian biologists Konrad Lorenz and Karl von Frisch, the three winners of the 1973 Nobel Prize in Physiology or Medicine. Ethology combines laboratory and field science, with a strong relation to neuroanatomy, ecology, and evolutionary biology.

Etymology

The modern term ethology derives from the Greek language: ἦθος, ethos meaning "character" and -λογία, -logia meaning "the study of". The term was first popularized by the American entomologist William Morton Wheeler in 1902.

History

The beginnings of ethology

Charles Darwin (1809–1882) explored the expression of emotions in animals.

Ethologists have been concerned particularly with the evolution of behaviour and its understanding in terms of natural selection. In one sense, the first modern ethologist was Charles Darwin, whose 1872 book The Expression of the Emotions in Man and Animals influenced many ethologists. He pursued his interest in behaviour by encouraging his protégé George Romanes, who investigated animal learning and intelligence using an anthropomorphic method, anecdotal cognitivism, that did not gain scientific support.

Other early ethologists, such as Eugène Marais, Charles O. Whitman, Oskar Heinroth, Wallace Craig and Julian Huxley, instead concentrated on behaviours that can be called instinctive in that they occur in all members of a species under specified circumstances. Their starting point for studying the behaviour of a new species was to construct an ethogram, a description of the main types of behaviour with their frequencies of occurrence. This provided an objective, cumulative database of behaviour.

Growth of the field

Due to the work of Konrad Lorenz and Niko Tinbergen, ethology developed strongly in continental Europe during the years prior to World War II. After the war, Tinbergen moved to the University of Oxford, and ethology became stronger in the UK, with the additional influence of William Thorpe, Robert Hinde, and Patrick Bateson at the University of Cambridge.

Lorenz, Tinbergen, and von Frisch were jointly awarded the Nobel Prize in Physiology or Medicine in 1973 for their work of developing ethology.

Ethology is now a well-recognized scientific discipline, with its own journals such as Animal Behaviour, Applied Animal Behaviour Science, Animal Cognition, Behaviour, Behavioral Ecology and Ethology. In 1972, the International Society for Human Ethology was founded along with its journal, Human Ethology.

Social ethology

In 1972, the English ethologist John H. Crook distinguished comparative ethology from social ethology, and argued that much of the ethology that had existed so far was really comparative ethology—examining animals as individuals—whereas, in the future, ethologists would need to concentrate on the behaviour of social groups of animals and the social structure within them.

E. O. Wilson's book Sociobiology: The New Synthesis appeared in 1975, and since that time, the study of behaviour has been much more concerned with social aspects. It has been driven by the Darwinism associated with Wilson, Robert Trivers, and W. D. Hamilton. The related development of behavioural ecology has helped transform ethology. Furthermore, a substantial rapprochement with comparative psychology has occurred, so the modern scientific study of behaviour offers a spectrum of approaches. In 2020, Tobias Starzak and Albert Newen from the Institute of Philosophy II at the Ruhr University Bochum postulated that animals may have beliefs.

Determinants of behaviour

Behaviour is determined by three major factors, namely inborn instincts, learning, and environmental factors. The latter include abiotic and biotic factors. Abiotic factors such as temperature or light conditions have dramatic effects on animals, especially if they are ectothermic or nocturnal. Biotic factors include members of the same species (e.g. sexual behavior), predators (fight or flight), or parasites and diseases.

Instinct

Kelp gull chicks peck at red spot on mother's beak to stimulate regurgitating reflex

Webster's Dictionary defines instinct as "A largely inheritable and unalterable tendency of an organism to make a complex and specific response to environmental stimuli without involving reason". This covers fixed action patterns like beak movements of bird chicks, and the waggle dance of honeybees.

Fixed action patterns

An important development, associated with the name of Konrad Lorenz though probably due more to his teacher, Oskar Heinroth, was the identification of fixed action patterns. Lorenz popularized these as instinctive responses that would occur reliably in the presence of identifiable stimuli called sign stimuli or "releasing stimuli". Fixed action patterns are now considered to be instinctive behavioural sequences that are relatively invariant within the species and that almost inevitably run to completion.

One example of a releaser is the beak movements of many bird species performed by newly hatched chicks, which stimulates the mother to regurgitate food for her offspring. Other examples are the classic studies by Tinbergen on the egg-retrieval behaviour and the effects of a "supernormal stimulus" on the behaviour of graylag geese.

One investigation of this kind was the study of the waggle dance ("dance language") in bee communication by Karl von Frisch.

Learning

Habituation

Habituation is a simple form of learning and occurs in many animal taxa. It is the process whereby an animal ceases responding to a stimulus. Often, the response is an innate behavior. Essentially, the animal learns not to respond to irrelevant stimuli. For example, prairie dogs (Cynomys ludovicianus) give alarm calls when predators approach, causing all individuals in the group to quickly scramble down burrows. When prairie dog towns are located near trails used by humans, giving alarm calls every time a person walks by is expensive in terms of time and energy. Habituation to humans is therefore an important behavior in this context.

Associative learning

Associative learning in animal behaviour is any learning process in which a new response becomes associated with a particular stimulus. The first studies of associative learning were made by the Russian physiologist Ivan Pavlov, who observed that dogs trained to associate food with the ringing of a bell would salivate on hearing the bell.

Imprinting

Imprinting in a moose.

Imprinting enables the young to discriminate the members of their own species, vital for reproductive success. This important type of learning only takes place in a very limited period of time. Konrad Lorenz observed that the young of birds such as geese and chickens followed their mothers spontaneously from almost the first day after they were hatched, and he discovered that this response could be imitated by an arbitrary stimulus if the eggs were incubated artificially and the stimulus were presented during a critical period that continued for a few days after hatching.

Cultural learning

Observational learning
Imitation

Imitation is an advanced behavior whereby an animal observes and exactly replicates the behavior of another. The National Institutes of Health reported that capuchin monkeys preferred the company of researchers who imitated them to that of researchers who did not. The monkeys not only spent more time with their imitators but also preferred to engage in a simple task with them even when provided with the option of performing the same task with a non-imitator. Imitation has been observed in recent research on chimpanzees; not only did these chimps copy the actions of another individual, when given a choice, the chimps preferred to imitate the actions of the higher-ranking elder chimpanzee as opposed to the lower-ranking young chimpanzee.

Stimulus and local enhancement

Animals can learn using observational learning but without the process of imitation. One way is stimulus enhancement in which individuals become interested in an object as the result of observing others interacting with the object. Increased interest in an object can result in object manipulation which allows for new object-related behaviours by trial-and-error learning. Haggerty (1909) devised an experiment in which a monkey climbed up the side of a cage, placed its arm into a wooden chute, and pulled a rope in the chute to release food. Another monkey was provided an opportunity to obtain the food after watching a monkey go through this process on four occasions. The monkey performed a different method and finally succeeded after trial-and-error. In local enhancement, a demonstrator attracts an observer's attention to a particular location. Local enhancement has been observed to transmit foraging information among birds, rats and pigs. The stingless bee (Trigona corvina) uses local enhancement to locate other members of their colony and food resources.

Social transmission

A well-documented example of social transmission of a behaviour occurred in a group of macaques on Hachijojima Island, Japan. The macaques lived in the inland forest until the 1960s, when a group of researchers started giving them potatoes on the beach: soon, they started venturing onto the beach, picking the potatoes from the sand, and cleaning and eating them. About one year later, an individual was observed bringing a potato to the sea, putting it into the water with one hand, and cleaning it with the other. This behaviour was soon expressed by the individuals living in contact with her; when they gave birth, this behaviour was also expressed by their young—a form of social transmission.

Teaching

Teaching is a highly specialized aspect of learning in which the "teacher" (demonstrator) adjusts their behaviour to increase the probability of the "pupil" (observer) achieving the desired end-result of the behaviour. For example, orcas are known to intentionally beach themselves to catch pinniped prey. Mother orcas teach their young to catch pinnipeds by pushing them onto the shore and encouraging them to attack the prey. Because the mother orca is altering her behaviour to help her offspring learn to catch prey, this is evidence of teaching. Teaching is not limited to mammals. Many insects, for example, have been observed demonstrating various forms of teaching to obtain food. Ants, for example, will guide each other to food sources through a process called "tandem running," in which an ant will guide a companion ant to a source of food. It has been suggested that the pupil ant is able to learn this route to obtain food in the future or teach the route to other ants. This behaviour of teaching is also exemplified by crows, specifically New Caledonian crows. The adults (whether individual or in families) teach their young adolescent offspring how to construct and utilize tools. For example, Pandanus branches are used to extract insects and other larvae from holes within trees.

Mating and the fight for supremacy

Courtship display of a sarus crane

Individual reproduction is the most important phase in the proliferation of individuals or genes within a species: for this reason, there exist complex mating rituals, which can be very complex even if they are often regarded as fixed action patterns. The stickleback's complex mating ritual, studied by Tinbergen, is regarded as a notable example.

Often in social life, animals fight for the right to reproduce, as well as social supremacy. A common example of fighting for social and sexual supremacy is the so-called pecking order among poultry. Every time a group of poultry cohabitate for a certain time length, they establish a pecking order. In these groups, one chicken dominates the others and can peck without being pecked. A second chicken can peck all the others except the first, and so on. Chickens higher in the pecking order may at times be distinguished by their healthier appearance when compared to lower level chickens. While the pecking order is establishing, frequent and violent fights can happen, but once established, it is broken only when other individuals enter the group, in which case the pecking order re-establishes from scratch.

Social behaviour

Several animal species, including humans, tend to live in groups. Group size is a major aspect of their social environment. Social life is probably a complex and effective survival strategy. It may be regarded as a sort of symbiosis among individuals of the same species: a society is composed of a group of individuals belonging to the same species living within well-defined rules on food management, role assignments and reciprocal dependence.

When biologists interested in evolution theory first started examining social behaviour, some apparently unanswerable questions arose, such as how the birth of sterile castes, like in bees, could be explained through an evolving mechanism that emphasizes the reproductive success of as many individuals as possible, or why, amongst animals living in small groups like squirrels, an individual would risk its own life to save the rest of the group. These behaviours may be examples of altruism. Not all behaviours are altruistic, as indicated by the table below. For example, revengeful behaviour was at one point claimed to have been observed exclusively in Homo sapiens. However, other species have been reported to be vengeful including chimpanzees, as well as anecdotal reports of vengeful camels.

Classification of social behaviours
Type of behaviour Effect on the donor Effect on the receiver
Egoistic Neutral to Increases fitness Decreases fitness
Cooperative Neutral to Increases fitness Neutral to Increases fitness
Altruistic Decreases fitness Neutral to Increases fitness
Revengeful Decreases fitness Decreases fitness

Altruistic behaviour has been explained by the gene-centred view of evolution.

Benefits and costs of group living

One advantage of group living is decreased predation. If the number of predator attacks stays the same despite increasing prey group size, each prey has a reduced risk of predator attacks through the dilution effect. Further, according to the selfish herd theory, the fitness benefits associated with group living vary depending on the location of an individual within the group. The theory suggests that conspecifics positioned at the centre of a group will reduce the likelihood predations while those at the periphery will become more vulnerable to attack. In groups, prey can also actively reduce their predation risk through more effective defence tactics, or through earlier detection of predators through increased vigilance.

Another advantage of group living is an increased ability to forage for food. Group members may exchange information about food sources, facilitating the process of resource location. Honeybees are a notable example of this, using the waggle dance to communicate the location of flowers to the rest of their hive. Predators also receive benefits from hunting in groups, through using better strategies and being able to take down larger prey.

Some disadvantages accompany living in groups. Living in close proximity to other animals can facilitate the transmission of parasites and disease, and groups that are too large may also experience greater competition for resources and mates.

Group size

Theoretically, social animals should have optimal group sizes that maximize the benefits and minimize the costs of group living. However, in nature, most groups are stable at slightly larger than optimal sizes. Because it generally benefits an individual to join an optimally-sized group, despite slightly decreasing the advantage for all members, groups may continue to increase in size until it is more advantageous to remain alone than to join an overly full group.

Tinbergen's four questions for ethologists

Tinbergen argued that ethology needed to include four kinds of explanation in any instance of behaviour:

  • Function – How does the behaviour affect the animal's chances of survival and reproduction? Why does the animal respond that way instead of some other way?
  • Causation – What are the stimuli that elicit the response, and how has it been modified by recent learning?
  • Development – How does the behaviour change with age, and what early experiences are necessary for the animal to display the behaviour?
  • Evolutionary history – How does the behaviour compare with similar behaviour in related species, and how might it have begun through the process of phylogeny?

These explanations are complementary rather than mutually exclusive—all instances of behaviour require an explanation at each of these four levels. For example, the function of eating is to acquire nutrients (which ultimately aids survival and reproduction), but the immediate cause of eating is hunger (causation). Hunger and eating are evolutionarily ancient and are found in many species (evolutionary history), and develop early within an organism's lifespan (development). It is easy to confuse such questions—for example, to argue that people eat because they are hungry and not to acquire nutrients—without realizing that the reason people experience hunger is because it causes them to acquire nutrients.

Tuesday, May 20, 2025

DNA Valley

From Wikipedia, the free encyclopedia
https://en.wikipedia.org/wiki/DNA_Valley

DNA Valley (or DNA Alley) is a region in Maryland that serves as a biotechnology hub with a focus on genetic medicine. Roughly traced by Rockville, Frederick, and Baltimore, DNA Valley includes the innovation companies in the Maryland I-270 technology corridor, the various campuses of federal entities such as the FDA and NIH, as well as The University of Maryland, Johns Hopkins University, The Institute for Human Virology, and various laboratories with high biosafety levels such as Fort Detrick. Major DNA valley cities include: Baltimore, Columbia, Germantown, Silver Spring, Rockville, Bethesda, Gaithersburg, College Park, and Frederick. The counties that make up DNA valley are Montgomery County, Frederick County, Howard County, Baltimore County, Anne Arundel County, and Carroll County. According to the Bureau of Economic Analysis, these counties contributed a combined GDP of $310,407,270 in 2021, higher than several nations. Local business leaders like Jeff Galvin expect this figure to increase in step with the growth of the biotechnology sector.

DNA Valley is home to many of Maryland's biotechnology, pharmaceutical, and life science companies including AstraZeneca, BioNTech, GeneDx, Qiagen, American Gene Technologies, and GlaxoSmithKline. A defining feature of the region is its staggering concentration of scientists and doctors. According to New Scientist, "There are more MDs and PhDs per capita in a 10-mile radius of DC than anywhere else in the country".

Etymology

The name "DNA Valley" is championed by American Gene TechnologiesⓇ CEO, Jeff Galvin. Galvin came to Maryland and the life science industry after a successful career in Silicon Valley and immediately saw the similarities between the early days of the tech industry in Silicon Valley and the life science industry in Maryland. The earliest documented use of the name came from an article written by Alison George at New Scientist in 2004, as she recounted a cab ride where her driver referred to the D.C. area as "DNA Valley" because of the concentration of biotech companies in the area.

DNA valley is not an actual geographical valley and is instead named as such because of the similarities between the biotechnology and life science boom in Maryland and the tech boom that occurred in Silicon Valley in the 1970s and 1980s. Previous to the growth of the biotechnology industry, Maryland and the surrounding regions were predominantly focused on the seafood, agriculture, and logistics industries due to the abundant waterways available in the state.

History

Role of the NIH

The National Institute of Health (NIH) played a central role in the emergence of DNA Valley, through its role in the Human Genome project, its central location in Bethesda, Maryland, and its investment into life sciences in the local area.

The National Institutes of Health (NIH) have played a major role in the development of the life science industry boom in Maryland, and thus the creation of DNA Valley. The NIH originally moved its headquarters from the Old Naval Observatory to Bethesda, Maryland in 1938. In 1989, as part of the launch of the Human Genome Project, the National Center for Human Genome Research (now known as The National Human Genome Research Institute) was founded in Bethesda.[11] This made Bethesda the national hub for genetic research as genetic researchers from around the country came to help sequence the human genome.[12] This project, being one of the most influential scientific projects of the last century, planted the seeds for the eventual biotechnology hub that has formed in the area since. The infrastructure and attention to the industry that the NCHGR and the HGP brought to Maryland are what opened the door to the extensive cell and gene therapy industries that Maryland and DNA Valley are now home to.

The NHGRI is not the only NIH subsidiary that has led to DNA Valley becoming such a major life science hub. The NIH as a whole has fueled the biotech industry in Maryland as the research done at the federally funded facilities has resulted in new fields of research, new tools, and highly trained researchers that often remain in the area and create their own life science companies. For example, the work done by Roscoe Brady, MD, PhD on viral vectors caught the attention of entrepreneur Jeff Galvin, inspiring him to found American Gene Technologies and pursue potential cures for diseases like HIV, PKU, and certain cancers.. The NIH also funds outside research in the area, which further allows for the industry to flourish as more companies want to be based near the NIH headquarters in Bethesda.

A variety of life science-related conferences are held annually at the NIH headquarters in Bethesda, such as workshops, trainings, and professional conferences, all of which not only bring attention and prestige to the life science industry in Maryland, but also result in a better trained and educated population in the area, allowing for the further success of the industry.

The NIH is not exclusively located in Bethesda and has a variety of campuses in Maryland. The Bayview Campus in Baltimore contains the research programs of the National Institute of Aging and the National Institute of Drug Abuse. The Frederick National Laboratory and Riverside Research Park are home to the National Cancer Institute, which includes the Center for Cancer Research. The widespread footprint of the NIH in Maryland directly correlates to the biotech boom that resulted in DNA Valley, as the highest concentrations of life science companies are located in the same locations of Rockville, Frederick, and Baltimore.

Rise of genetic medicine

Scientists R. Michael Blaese, W. French Anderson, and Kenneth Culver at the press conference that announced the start of the first ever gene therapy trial for severe combined immunodeficiency (SCID) in 1990.

The first speculation about the plausibility of introducing DNA sequences into patient's cells to cure diseases occurred in the 1960s. Then in 1972, Theodore Friedman and Richard Roblin published a paper in Science named "Gene Therapy for Human Genetic Diseases?", which detailed the possibility of inserting unmutated or healthy DNA to cure patients with genetic diseases. However, this paper also urged that the technology be furthered with caution as a result of the lack of understanding of the technology and its potential effects. They were primarily worried about the lack of knowledge about genetic recombination and gene regulation, lack of understanding about the relationship between genetic mutations and diseases, and the lack of understanding of the potential side effects of gene therapy.

For 18 years after that paper was published, further research was conducted to help limit the risks detailed by Theodore Friedman and Richard Roblin. Then in 1990, the first successful gene therapy trial was launched. A four-year-old girl named Ashanthi De Silva with severe combined immunodeficiency (SCID) was treated with gene therapy. Ashanthi was lacking the enzyme adenosine deaminase (ADA), which caused her T-cells to die, leaving her with little to no protection against infection. To treat this, Dr. W. French Anderson from the National Heart, Lung, and Blood Institute in Bethesda, Maryland, delivered the correct ADA gene, using a disabled virus, to white blood cells that had been removed from her body, and then injected the cells back into her body.

The rise of gene therapy was not easy as it suffered a major setback in 1999 with the trials at the University of Pennsylvania. During the trials, an 18-year-old named Jesse Gelsinger who had the genetic disease ornithine transcarbamylase deficiency, died from an immune response after being treated with a working gene carried by an adenovirus.

The early 2010s brought back the evolution of gene therapy as a potential cure to many different diseases. New delivery methods for the gene therapies were discovered, thus making the techniques significantly safer. Researchers also added enhancers and promoters, which allowed for better control of the gene as they could decide when and where it would be turned on and to what extent. These discoveries, along with others made during this period, allowed gene therapy to regain its momentum and move to the forefront of Medical Technology development. There was then a wave of approvals for gene therapy techniques from 2003 to 2012, including therapies for cancer, artery disease, and others. Since then, the rate of development and approval of gene therapies has increased, with the FDA expecting to approve between 10 and 20 gene therapies each year until 2025.

Economy

The D.C. / Maryland area has the second-highest rated life science hub in the United States, with Maryland alone providing 44,260 jobs in life science. Maryland life science businesses generated over $18.6 billion in 2018, paid over $4.9 billion in wages, with an average salary of $110,690. Maryland also boasted the 5th highest concentration of doctoral scientists and engineers and the highest STEM concentration in the country in 2022. Between 2017 and 2022, the life science research jobs increased by 19%, which was larger than the national growth rate of 16%, indicating a particular focus on the industry in Maryland.

The region has more than double the amount of federal research labs than any other state, partly due to the presence of the NIH headquarters in Bethesda, Maryland. Maryland also has the 11th lowest unemployment rate at 2.5% in 2023, which is partly a result of the booming biotech and life science industry in the area.

Housing

Maryland, and by association DNA Valley, has a severe affordable housing shortage, with only approximately 30 affordable and available rental units for every 100 extremely low income families and a total housing shortage of 120,000 units. This is possibly due to the boom in life science jobs in the area, while the creation of housing units has remained constant, leading to the imbalance. DNA Valley also includes some of the highest cost of living areas in the country, with D.C. having the second highest and Maryland having the sixth highest.

Notable companies

Thousands of life science companies are headquartered in DNA Valley. The following are some of the notable companies based in the area:

  • 20/20 Gene Systems
  • 3CPM AAVnerGene
  • AAVogen
  • ACell
  • Adaptive Phage Therapeutics
  • Adjuvant Partners
  • Advanced BioScience Labs
  • Advanced Biotechnologies
  • AgeneBio Akonni Biosystems
  • Allucent Alphyn Biologics
  • Altimmune
  • Amarex Clinical Research
  • American Gene Technologies
  • Amethyst Technologies
  • AnGes
  • Antidote Therapeutics
  • Aphena Pharma Solutions
  • Arcellx
  • Arraystar
  • Ascentage Pharma
  • AscentGene
  • AsclepiX Therapeutics
  • Asklepion Pharmaceuticals
  • AssayGate
  • AstraZeneca
  • Ataia Medical
  • Autonomous Therapeutics
  • Avalo Therapeutics
  • Aziyo Biologics
  • Becton Dickinson
  • Bioassay Works
  • Biofactura
  • Biojo Sciences
  • Biological Mimetics
  • Biologics Resources
  • Biomarker Strategies
  • Bionavigen
  • BiOneCure Therapeutics
  • BioNTech
  • Bioqual
  • BioReliance
  • Biostorage Lab Services
  • BioStorage LLC
  • BLA Regulatory
  • BondTrue
  • BrainCool
  • BrainScope
  • Cage Pharma
  • Cartesian Therapeutics
  • CASI Pharmaceuticals
  • Cellomics
  • Cellphire Therapeutics
  • Cellular Biomedicine Group
  • CentryMed Pharmaceutical
  • Cerium Pharmaceuticals
  • Charles River Laboratories
  • Charles River Laboratories
  • ChemPacific
  • ChiRhoClin
  • CiVi Biopharma
  • CNBX Pharmaceuticals
  • CoapTech
  • Codex Biosolutions
  • Cogentis Therapeutics
  • Consortium AI
  • CosmosID
  • CraniUS
  • Creatv MicroTech
  • CRScube
  • CSSi LifeSciences
  • Cytimmune
  • Deka Biosciences
  • Delfi Diagnostics
  • Diagnostic Biochips
  • DNA Analytics
  • DP Clinical
  • EliteImmune
  • Elixirgen Scientific
  • Elixirgen Therapeutics
  • Emergent Biosolutions
  • Eminent Services
  • Emmes
  • ExeGi Pharma
  • ExoLytics
  • Eyedea Medical
  • Fina Biosolutions
  • Firma Clinical Research
  • Flavocure Biotech
  • Forecyte Bio
  • Fyodor Biotechnologies
  • FZata
  • Galen Robotics
  • GeneCopoeia
  • GeneDx
  • Gliknik
  • GlycoMimetics
  • Glyscend Therapeutics
  • Haystack Oncology
  • Hemagen Diagnostics
  • HeMemics Biotechnologies
  • i-Cordis Ibex Biosciences
  • IBT Bioservices
  • Immunodiagnostic Systems
  • Immunomic Therapeutics
  • ImQuest BioSciences
  • Innovative Cellular Therapeutics
  • Integrated BioTherapeutics
  • Integrated Pharma Services
  • Interbiome
  • IZI Medical
  • Jubilant Cadista
  • KaloCyte
  • KCRN Research
  • Kemp Proteins
  • Key Tech
  • Kolon TissueGene
  • Leadiant Biosciences
  • Leidos Biomedical Research
  • LKC Technologies
  • Longhorn Vaccines
  • Lonza Lung Biotechnology
  • Lupin
  • MacroGenics
  • MAGBIO Genomics
  • Maxcyte
  • Maxim Biomedical
  • Medcura
  • Medifocus
  • Medigen
  • Meso Scale Discovery
  • miRecule
  • Moss Bio
  • MyMD Pharmaceuticals
  • NeoDiagnostix
  • NeoImmuneTech
  • Neuraly
  • Neuronascent
  • Newzen Pharma
  • NexImmune
  • NextCure
  • Noble Life Sciences
  • Northwest Biotherapeutics
  • Novavax
  • Noxilizer
  • OncoC4
  • OpGen
  • Orgenesis
  • Origene
  • OS Therapies
  • Otomagnetics
  • OTraces
  • Otsuka
  • Paradigm Shift Therapeutics
  • Parexel
  • PathoVax
  • PepVax
  • PeriCor
  • Personal Genome Diagnostics
  • Pharmaceutics International
  • Pharmaron
  • Pinney Associates
  • Polaris Genomics
  • Poochon
  • Proteomics Solutions
  • Precigen Precision Biologics
  • Precision for Medicine
  • Previse
  • Primera Therapeutics
  • Processa Pharmaceuticals
  • Propagenix
  • Protein Potential
  • Psomagen
  • Qiagen
  • RareMoon Consulting
  • Ravgen
  • ReGelTec
  • RegeneRx Biopharmaceuticals
  • ReGenX Biosciences
  • Relavo
  • Restorative Therapies
  • ReveraGen BioPharma
  • Rise Therapeutics
  • Rithim Biologics
  • RNAimmune
  • Robin Medical
  • RoosterBio
  • RRD International
  • RS BioTherapeutics
  • Salubris Biotherapeutics
  • Sanaria
  • Sapio Sciences
  • Scanogen
  • Sensei Biotherapeutics
  • Senseonics
  • Sequella
  • Seracare Life Sciences
  • Seraxis
  • Shuttle Pharmaceuticals
  • Sigmovir Biosystems
  • SilcsBio
  • Sirnaomics
  • Sonavex
  • SPEED BioSystems
  • SriSai Biopharmaceutical Solutions
  • Supernus Pharmaceuticals
  • SYNAPS Dx
  • Syngene
  • Sysmex
  • Tailored Therapeutics
  • Tasly Pharmaceutical
  • TCR2 Therapeutics
  • TeraImmune
  • Terumo Medical
  • Tetracore
  • Texcell
  • Theradaptive
  • Theriva Biologics
  • Thermo Fisher
  • Tonix Pharmaceuticals
  • TrimGen
  • Trophogen
  • uBriGene
  • United Therapeutics
  • US Medical Innovations
  • Valneva
  • ValtedSeq
  • Vasoptic Medical
  • Vector BioMed
  • VeraChem
  • Veralox Therapeutics
  • Vici Health Sciences
  • Vigilant Bioservices
  • Vita Therapeutics
  • VLP Therapeutics
  • Wellstat Group
  • Westat
  • WindMIL Therapeutics
  • X-Cor Therapeutics
  • Xcision Medical Systems
  • xMD Diagnostics
  • XpressBio
  • Zalgen Labs
  • Zeteo Tech
  • Zylacta
  • ZyMot fertility

Demographics

Depending on what geographic regions (particularly parts of Washington, D.C.) are included in the meaning of the term, the population of DNA Valley is between 2 million and 3.5 million. According to the U.S. Census Bureau, almost a third of DNA Valley's population is Black or of African descent, 11% are of Hispanic descent and 6.9% is of Asian descent.

Diversity

DNA Valley is one of the most diverse areas in the country, with 3 of the 10 most diverse communities in the area, those being Gaithersburg, Germantown, and Silver Spring. Biotechnology as a whole is not a typically diverse field, being overwhelmingly dominated by white (56%) and Asian (21%) employees. Even greater disparity is seen among executives, with 72% of execs being White and 15% being Asian. The biotech hub in DNA Valley tends to differ from this norm, likely due to the diversity of the area.

Gender

Similarly to race, gender disparity is quite significant in the field of biotechnology, with males dominating the space, particularly in positions of power. 66% of executives and 79% of CEOs are men. DNA Valley follows this trend, as in 2021, women only made up around 22% of the executive positions at biotechnology companies. One possible explanation for this, as proposed by Harvard Senior Research Associate Vivek Wadhwa, is that parents tend to not encourage their daughters to pursue a career in science and engineering as much as they would with their sons. Wadhwa also cites the lack of potential role models for women in the science and engineering fields in comparison to men.

However, interestingly, Maryland has the highest average salary for female CEOS, at around $280,000, which may be in part due to the higher average salaries in Maryland in general. Washington D.C. also has the second-highest female CEO percentage in the country at 47.5%, which would change the DNA Valley numbers depending on whether you include D.C. in the geographical boundaries of the region. There have been concerted efforts to fix the current lack of females in Maryland life science fields, including the founding of a Women in Bio (WIB) chapter in the D.C. region in 2011. The focus of this chapter is to promote diversity and inclusion for all women in life science-related fields. WIB also sponsors the Herstory Gala, in Rockville, Maryland every year to celebrate the women trailblazers in life sciences that have had an impact on the field in the DNA Valley area.

Statistics

Maryland, and thus DNA Valley, is considered one of the most diverse states in the country, based both on religious and ethnic group diversity. DNA Valley's population is made up of 32% Black, 7% Asian, 12% Hispanic or Latino, and 1% Native American people. In terms of religious affiliations, DNA Valley's population is divided into 69% Christian-based faiths (mostly made up of equal percentages of Evangelical Protestant, Mainline Protestant, Historically Black Protestant, and Catholic), 23% not affiliated with any faith, and 8% having non-Christian-based faiths, primarily made up of Jewish, Muslim, Buddhist, and Hindu faiths

Education

The funding for public schools in DNA Valley varies drastically depending on the area as a result of increased grants from private foundations in wealthier areas such as Montgomery County and particularly Bethesda. Less wealthy areas such as Garret County rely on state funding.

Hugo de Vries

From Wikipedia, the free encyclopedia
Hugo de Vries
de Vries c. 1907
Born
Hugo Marie de Vries

16 February 1848
Haarlem, Netherlands
Died21 May 1935 (aged 87)
Lunteren, Netherlands
Scientific career
FieldsBotany
InstitutionsLeiden University
Author abbrev. (botany)de Vries

Hugo Marie de Vries (Dutch: [ˈɦyɣoː ˈvris]; 16 February 1848 – 21 May 1935) was a Dutch botanist and one of the first geneticists. He is known chiefly for suggesting the concept of genes, rediscovering the laws of heredity in the 1890s while apparently unaware of Gregor Mendel's work, for introducing the term "mutation", and for developing a mutation theory of evolution.

Early life

De Vries was born in 1848, the eldest son of Gerrit de Vries (1818–1900), a lawyer and deacon in the Mennonite congregation in Haarlem and later Prime Minister of the Netherlands from 1872 until 1874, and Maria Everardina Reuvens (1823–1914), daughter of a professor in archaeology at Leiden University. His father became a member of the Dutch Council of State in 1862 and moved his family over to The Hague. From an early age Hugo showed much interest in botany, winning several prizes for his herbariums while attending gymnasium in Haarlem and The Hague.

In 1866 he enrolled at the Leiden University to major in botany. He enthusiastically took part in W.F.R. Suringar's classes and excursions, but was mostly drawn to the experimental botany outlined in Julius von Sachs' 'Lehrbuch der Botanik' from 1868. He was also deeply impressed by Charles Darwin's evolution theory, despite Suringar's skepticism. He wrote a dissertation on the effect of heat on plant roots, including several statements by Darwin to provoke his professor, and graduated in 1870.

Early career

After a short period of teaching, de Vries left in September 1870 to take classes in chemistry and physics at the Heidelberg University and work in the laboratory of Wilhelm Hofmeister. In the second semester of that school year he joined the lab of the esteemed Julius Sachs in Würzburg to study plant growth. From September 1871 until 1875 he taught botany, zoology and geology at schools in Amsterdam. During each vacation he returned to the lab in Heidelberg to continue his research.

In 1875, the Prussian Ministry of Agriculture offered de Vries a position as professor at the still to be constructed Landwirtschaftliche Hochschule ("Royal Agricultural College") in Berlin. In anticipation, he moved back to Würzburg, where he studied agricultural crops and collaborated with Sachs. By 1877, Berlin's College was still only a plan, and he briefly took up a position teaching at the University of Halle-Wittenberg. The same year he was offered a position as lecturer in plant physiology at the newly founded University of Amsterdam. He was made adjunct professor in 1878 and full professor on his birthday in 1881, partly to keep him from moving to the Berlin College, which finally opened that year. De Vries was also professor and director of Amsterdam's Botanical Institute and Garden from 1885 to 1918.

Definition of the gene

In 1889, de Vries published his book Intracellular Pangenesis, in which, based on a modified version of Charles Darwin's theory of Pangenesis of 1868, he postulated that different characters have different hereditary carriers. He specifically postulated that inheritance of specific traits in organisms comes in particles. He called these units pangenes, a term 20 years later to be shortened to genes by Wilhelm Johannsen.

Rediscovery of genetics

Hugo de Vries in the 1890s

To support his theory of pangenes, which was not widely noticed at the time, de Vries conducted a series of experiments hybridising varieties of multiple plant species in the 1890s. Unaware of Mendel's work, de Vries used the laws of dominance and recessiveness, segregation, and independent assortment to explain the 3:1 ratio of phenotypes in the second generation. His observations also confirmed his hypothesis that inheritance of specific traits in organisms comes in particles.

He further speculated that genes could cross the species barrier, with the same gene being responsible for hairiness in two different species of flower. Although generally true in a sense (orthologous genes, inherited from a common ancestor of both species, tend to stay responsible for similar phenotypes), de Vries meant a physical cross between species. This actually also happens, though very rarely in higher organisms (see horizontal gene transfer). De Vries' work on genetics inspired the research of Jantina Tammes, who worked with him for a period in 1898.

In the late 1890s, de Vries became aware of Mendel's obscure paper of thirty years earlier and he altered some of his terminology to match. When he published the results of his experiments in the French journal Comptes rendus de l'Académie des Sciences in 1900, he neglected to mention Mendel's work, but after criticism by Carl Correns he conceded Mendel's priority.

Correns and Erich von Tschermak now share credit for the rediscovery of Mendel's laws. Correns was a student of Nägeli, a renowned botanist with whom Mendel corresponded about his work with peas but who failed to understand its significance, while, coincidentally, Tschermak's grandfather taught Mendel botany during his student days in Vienna.

Mutation theory

In his own time, de Vries was best known for his mutation theory. In 1886, he had discovered new forms among a group of Oenothera lamarckiana, a species of evening primrose, growing wild in an abandoned potato field near Hilversum, having escaped a nearby garden. Taking seeds from these, he found that they produced many new varieties in his experimental gardens; he introduced the term mutations for these suddenly appearing variations. In his two-volume publication The Mutation Theory (1900–1903) he postulated that evolution, especially the origin of species, might occur more frequently with such large-scale changes than via Darwinian gradualism, basically suggesting a form of saltationism. De Vries's theory was one of the chief contenders for the explanation of how evolution worked, leading, for example, Thomas Hunt Morgan to study mutations in the fruit fly, until the modern evolutionary synthesis became the dominant model in the 1930s. During the early decades of the twentieth century, de Vries' theory was enormously influential and continued to fascinate non-biologists long after the scientific community had abandoned much of it (while retaining the idea of mutations as a crucial source of natural variation). The large-scale primrose variations turned out to be the result of various chromosomal abnormalities, including ring chromosomes, balanced lethals and chromosome duplications (polyploidy), while the term mutation now generally is restricted to discrete changes in the DNA sequence. However, the popular understanding of "mutation" as a sudden leap to a new species has remained a staple theme of science fiction, e.g. the X-Men movies (and the comic books that preceded them).

In a published lecture of 1903 (Befruchtung und Bastardierung, Veit, Leipzig), De Vries was also the first to suggest the occurrence of recombinations between homologous chromosomes, now known as chromosomal crossovers, within a year after chromosomes were implicated in Mendelian inheritance by Walter Sutton.

Botanist Daniel Trembly MacDougal attended his lectures in United States on Mutation Theory. In 1905 he helped published these lectures into a book Species and Varieties: Their Origin by Mutation.

Honors and retirement

Hugo de Vries at his retirement (Thérèse Schwartze, 1918)

In 1878 de Vries became member of the Royal Netherlands Academy of Arts and Sciences. He was elected to the American Philosophical Society in 1903 and the United States National Academy of Sciences in 1904. In May 1905, de Vries was elected Foreign Member of the Royal Society. In 1910, he was elected a member of the Royal Swedish Academy of Sciences. In 1921, he was elected to the American Academy of Arts and Sciences. He was awarded the Darwin Medal in 1906 and the Linnean Medal in 1929.

He retired in 1918 from the University of Amsterdam and withdrew to his estate De Boeckhorst in Lunteren where he had large experimental gardens. He continued his studies with new forms until his death in 1935.

Books

His best known works are:

Monday, May 19, 2025

Student's t-test

From Wikipedia, the free encyclopedia

Student's t-test is a statistical test used to test whether the difference between the response of two groups is statistically significant or not. It is any statistical hypothesis test in which the test statistic follows a Student's t-distribution under the null hypothesis. It is most commonly applied when the test statistic would follow a normal distribution if the value of a scaling term in the test statistic were known (typically, the scaling term is unknown and is therefore a nuisance parameter). When the scaling term is estimated based on the data, the test statistic—under certain conditions—follows a Student's t distribution. The t-test's most common application is to test whether the means of two populations are significantly different. In many cases, a Z-test will yield very similar results to a t-test because the latter converges to the former as the size of the dataset increases.

History

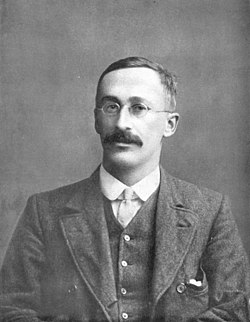
William Sealy Gosset, who developed the "t-statistic" and published it under the pseudonym of "Student"

The term "t-statistic" is abbreviated from "hypothesis test statistic". In statistics, the t-distribution was first derived as a posterior distribution in 1876 by Helmert and Lüroth. The t-distribution also appeared in a more general form as Pearson type IV distribution in Karl Pearson's 1895 paper. However, the t-distribution, also known as Student's t-distribution, gets its name from William Sealy Gosset, who first published it in English in 1908 in the scientific journal Biometrika using the pseudonym "Student" because his employer preferred staff to use pen names when publishing scientific papers. Gosset worked at the Guinness Brewery in Dublin, Ireland, and was interested in the problems of small samples – for example, the chemical properties of barley with small sample sizes. Hence a second version of the etymology of the term Student is that Guinness did not want their competitors to know that they were using the t-test to determine the quality of raw material. Although it was William Gosset after whom the term "Student" is penned, it was actually through the work of Ronald Fisher that the distribution became well known as "Student's distribution" and "Student's t-test".

Gosset devised the t-test as an economical way to monitor the quality of stout. The t-test work was submitted to and accepted in the journal Biometrika and published in 1908.

Guinness had a policy of allowing technical staff leave for study (so-called "study leave"), which Gosset used during the first two terms of the 1906–1907 academic year in Professor Karl Pearson's Biometric Laboratory at University College London. Gosset's identity was then known to fellow statisticians and to editor-in-chief Karl Pearson.

Uses

One-sample t-test

A one-sample Student's t-test is a location test of whether the mean of a population has a value specified in a null hypothesis. In testing the null hypothesis that the population mean is equal to a specified value μ0, one uses the statistic

where is the sample mean, s is the sample standard deviation and n is the sample size. The degrees of freedom used in this test are n − 1. Although the parent population does not need to be normally distributed, the distribution of the population of sample means is assumed to be normal.

By the central limit theorem, if the observations are independent and the second moment exists, then will be approximately normal .

Two-sample t-tests

Type I error of unpaired and paired two-sample t-tests as a function of the correlation. The simulated random numbers originate from a bivariate normal distribution with a variance of 1. The significance level is 5% and the number of cases is 60.
Power of unpaired and paired two-sample t-tests as a function of the correlation. The simulated random numbers originate from a bivariate normal distribution with a variance of 1 and a deviation of the expected value of 0.4. The significance level is 5% and the number of cases is 60.

A two-sample location test of the null hypothesis such that the means of two populations are equal. All such tests are usually called Student's t-tests, though strictly speaking that name should only be used if the variances of the two populations are also assumed to be equal; the form of the test used when this assumption is dropped is sometimes called Welch's t-test. These tests are often referred to as unpaired or independent samples t-tests, as they are typically applied when the statistical units underlying the two samples being compared are non-overlapping.

Two-sample t-tests for a difference in means involve independent samples (unpaired samples) or paired samples. Paired t-tests are a form of blocking, and have greater power (probability of avoiding a type II error, also known as a false negative) than unpaired tests when the paired units are similar with respect to "noise factors" (see confounder) that are independent of membership in the two groups being compared. In a different context, paired t-tests can be used to reduce the effects of confounding factors in an observational study.

Independent (unpaired) samples

The independent samples t-test is used when two separate sets of independent and identically distributed samples are obtained, and one variable from each of the two populations is compared. For example, suppose we are evaluating the effect of a medical treatment, and we enroll 100 subjects into our study, then randomly assign 50 subjects to the treatment group and 50 subjects to the control group. In this case, we have two independent samples and would use the unpaired form of the t-test.

Paired samples

Paired samples t-tests typically consist of a sample of matched pairs of similar units, or one group of units that has been tested twice (a "repeated measures" t-test).

A typical example of the repeated measures t-test would be where subjects are tested prior to a treatment, say for high blood pressure, and the same subjects are tested again after treatment with a blood-pressure-lowering medication. By comparing the same patient's numbers before and after treatment, we are effectively using each patient as their own control. That way the correct rejection of the null hypothesis (here: of no difference made by the treatment) can become much more likely, with statistical power increasing simply because the random interpatient variation has now been eliminated. However, an increase of statistical power comes at a price: more tests are required, each subject having to be tested twice. Because half of the sample now depends on the other half, the paired version of Student's t-test has only n/2 − 1 degrees of freedom (with n being the total number of observations). Pairs become individual test units, and the sample has to be doubled to achieve the same number of degrees of freedom. Normally, there are n − 1 degrees of freedom (with n being the total number of observations).

A paired samples t-test based on a "matched-pairs sample" results from an unpaired sample that is subsequently used to form a paired sample, by using additional variables that were measured along with the variable of interest. The matching is carried out by identifying pairs of values consisting of one observation from each of the two samples, where the pair is similar in terms of other measured variables. This approach is sometimes used in observational studies to reduce or eliminate the effects of confounding factors.

Paired samples t-tests are often referred to as "dependent samples t-tests".

Assumptions

Most test statistics have the form t = Z/s, where Z and s are functions of the data.

Z may be sensitive to the alternative hypothesis (i.e., its magnitude tends to be larger when the alternative hypothesis is true), whereas s is a scaling parameter that allows the distribution of t to be determined.

As an example, in the one-sample t-test

where is the sample mean from a sample X1, X2, …, Xn, of size n, s is the standard error of the mean, is the estimate of the standard deviation of the population, and μ is the population mean.

The assumptions underlying a t-test in the simplest form above are that:

  • X follows a normal distribution with mean μ and variance σ2/n.
  • s2(n − 1)/σ2 follows a χ2 distribution with n − 1 degrees of freedom. This assumption is met when the observations used for estimating s2 come from a normal distribution (and i.i.d. for each group).
  • Z and s are independent.

In the t-test comparing the means of two independent samples, the following assumptions should be met:

  • The means of the two populations being compared should follow normal distributions. Under weak assumptions, this follows in large samples from the central limit theorem, even when the distribution of observations in each group is non-normal.
  • If using Student's original definition of the t-test, the two populations being compared should have the same variance (testable using F-test, Levene's test, Bartlett's test, or the Brown–Forsythe test; or assessable graphically using a Q–Q plot). If the sample sizes in the two groups being compared are equal, Student's original t-test is highly robust to the presence of unequal variances. Welch's t-test is insensitive to equality of the variances regardless of whether the sample sizes are similar.
  • The data used to carry out the test should either be sampled independently from the two populations being compared or be fully paired. This is in general not testable from the data, but if the data are known to be dependent (e.g. paired by test design), a dependent test has to be applied. For partially paired data, the classical independent t-tests may give invalid results as the test statistic might not follow a t distribution, while the dependent t-test is sub-optimal as it discards the unpaired data.

Most two-sample t-tests are robust to all but large deviations from the assumptions.

For exactness, the t-test and Z-test require normality of the sample means, and the t-test additionally requires that the sample variance follows a scaled χ2 distribution, and that the sample mean and sample variance be statistically independent. Normality of the individual data values is not required if these conditions are met. By the central limit theorem, sample means of moderately large samples are often well-approximated by a normal distribution even if the data are not normally distributed. However, the sample size required for the sample means to converge to normality depends on the skewness of the distribution of the original data. The sample can vary from 30 to 100 or higher values depending on the skewness.

For non-normal data, the distribution of the sample variance may deviate substantially from a χ2 distribution.

However, if the sample size is large, Slutsky's theorem implies that the distribution of the sample variance has little effect on the distribution of the test statistic. That is, as sample size increases:

as per the Central limit theorem,
as per the law of large numbers,
.

Calculations

Explicit expressions that can be used to carry out various t-tests are given below. In each case, the formula for a test statistic that either exactly follows or closely approximates a t-distribution under the null hypothesis is given. Also, the appropriate degrees of freedom are given in each case. Each of these statistics can be used to carry out either a one-tailed or two-tailed test.

Once the t value and degrees of freedom are determined, a p-value can be found using a table of values from Student's t-distribution. If the calculated p-value is below the threshold chosen for statistical significance (usually the 0.10, the 0.05, or 0.01 level), then the null hypothesis is rejected in favor of the alternative hypothesis.

Slope of a regression line

Suppose one is fitting the model

where x is known, α and β are unknown, ε is a normally distributed random variable with mean 0 and unknown variance σ2, and Y is the outcome of interest. We want to test the null hypothesis that the slope β is equal to some specified value β0 (often taken to be 0, in which case the null hypothesis is that x and y are uncorrelated).

Let

Then

has a t-distribution with n − 2 degrees of freedom if the null hypothesis is true. The standard error of the slope coefficient:

can be written in terms of the residuals. Let

Then tscore is given by

Another way to determine the tscore is

where r is the Pearson correlation coefficient.

The tscore, intercept can be determined from the tscore, slope:

where sx2 is the sample variance.

Independent two-sample t-test

Equal sample sizes and variance

Given two groups (1, 2), this test is only applicable when:

  • the two sample sizes are equal,
  • it can be assumed that the two distributions have the same variance.

Violations of these assumptions are discussed below.

The t statistic to test whether the means are different can be calculated as follows:

where

Here sp is the pooled standard deviation for n = n1 = n2, and s 2
X1
and s 2
X2
are the unbiased estimators of the population variance. The denominator of t is the standard error of the difference between two means.

For significance testing, the degrees of freedom for this test is 2n − 2, where n is sample size.

Equal or unequal sample sizes, similar variances (1/2 < sX1/sX2 < 2)

This test is used only when it can be assumed that the two distributions have the same variance (when this assumption is violated, see below). The previous formulae are a special case of the formulae below, one recovers them when both samples are equal in size: n = n1 = n2.

The t statistic to test whether the means are different can be calculated as follows:

where

is the pooled standard deviation of the two samples: it is defined in this way so that its square is an unbiased estimator of the common variance, whether or not the population means are the same. In these formulae, ni − 1 is the number of degrees of freedom for each group, and the total sample size minus two (that is, n1 + n2 − 2) is the total number of degrees of freedom, which is used in significance testing.

The minimum detectable effect (MDE) is:

Equal or unequal sample sizes, unequal variances (sX1 > 2sX2 or sX2 > 2sX1)

This test, also known as Welch's t-test, is used only when the two population variances are not assumed to be equal (the two sample sizes may or may not be equal) and hence must be estimated separately. The t statistic to test whether the population means are different is calculated as

where

Here si2 is the unbiased estimator of the variance of each of the two samples with ni = number of participants in group i (i = 1 or 2). In this case is not a pooled variance. For use in significance testing, the distribution of the test statistic is approximated as an ordinary Student's t-distribution with the degrees of freedom calculated using

This is known as the Welch–Satterthwaite equation. The true distribution of the test statistic actually depends (slightly) on the two unknown population variances (see Behrens–Fisher problem).

Exact method for unequal variances and sample sizes

The test deals with the famous Behrens–Fisher problem, i.e., comparing the difference between the means of two normally distributed populations when the variances of the two populations are not assumed to be equal, based on two independent samples.

The test is developed as an exact test that allows for unequal sample sizes and unequal variances of two populations. The exact property still holds even with extremely small and unbalanced sample sizes (e.g. vs. ).

The statistic to test whether the means are different can be calculated as follows:

Let and be the i.i.d. sample vectors (for ) from and separately.

Let be an orthogonal matrix whose elements of the first row are all similarly, let be the first rows of an orthogonal matrix (whose elements of the first row are all ).

Then is an n-dimensional normal random vector:

From the above distribution we see that the first element of the vector Z is

hence the first element is distributed as

and the squares of the remaining elements of Z are chi-squared distributed

and by construction of the orthogonal matricies P and Q we have

so Z1, the first element of Z, is statistically independent of the remaining elements by orthogonality. Finally, take for the test statistic

Dependent t-test for paired samples

This test is used when the samples are dependent; that is, when there is only one sample that has been tested twice (repeated measures) or when there are two samples that have been matched or "paired". This is an example of a paired difference test. The t statistic is calculated as

where and are the average and standard deviation of the differences between all pairs. The pairs are e.g. either one person's pre-test and post-test scores or between-pairs of persons matched into meaningful groups (for instance, drawn from the same family or age group: see table). The constant μ0 is zero if we want to test whether the average of the difference is significantly different. The degree of freedom used is n − 1, where n represents the number of pairs.

Example of matched pairs
Pair Name Age Test
1 John 35 250
1 Jane 36 340
2 Jimmy 22 460
2 Jessy 21 200
Example of repeated measures
Number Name Test 1 Test 2
1 Mike 35% 67%
2 Melanie 50% 46%
3 Melissa 90% 86%
4 Mitchell 78% 91%

Worked examples

Let A1 denote a set obtained by drawing a random sample of six measurements:

and let A2 denote a second set obtained similarly:

These could be, for example, the weights of screws that were manufactured by two different machines.

We will carry out tests of the null hypothesis that the means of the populations from which the two samples were taken are equal.

The difference between the two sample means, each denoted by Xi, which appears in the numerator for all the two-sample testing approaches discussed above, is

The sample standard deviations for the two samples are approximately 0.05 and 0.11, respectively. For such small samples, a test of equality between the two population variances would not be very powerful. Since the sample sizes are equal, the two forms of the two-sample t-test will perform similarly in this example.

Unequal variances

If the approach for unequal variances (discussed above) is followed, the results are

and the degrees of freedom

The test statistic is approximately 1.959, which gives a two-tailed test p-value of 0.09077.

Equal variances

If the approach for equal variances (discussed above) is followed, the results are

and the degrees of freedom

The test statistic is approximately equal to 1.959, which gives a two-tailed p-value of 0.07857.

Alternatives to the t-test for location problems

The t-test provides an exact test for the equality of the means of two i.i.d. normal populations with unknown, but equal, variances. (Welch's t-test is a nearly exact test for the case where the data are normal but the variances may differ.) For moderately large samples and a one tailed test, the t-test is relatively robust to moderate violations of the normality assumption. In large enough samples, the t-test asymptotically approaches the z-test, and becomes robust even to large deviations from normality.

If the data are substantially non-normal and the sample size is small, the t-test can give misleading results. See Location test for Gaussian scale mixture distributions for some theory related to one particular family of non-normal distributions.

When the normality assumption does not hold, a non-parametric alternative to the t-test may have better statistical power. However, when data are non-normal with differing variances between groups, a t-test may have better type-1 error control than some non-parametric alternatives. Furthermore, non-parametric methods, such as the Mann-Whitney U test discussed below, typically do not test for a difference of means, so should be used carefully if a difference of means is of primary scientific interest. For example, Mann-Whitney U test will keep the type 1 error at the desired level alpha if both groups have the same distribution. It will also have power in detecting an alternative by which group B has the same distribution as A but after some shift by a constant (in which case there would indeed be a difference in the means of the two groups). However, there could be cases where group A and B will have different distributions but with the same means (such as two distributions, one with positive skewness and the other with a negative one, but shifted so to have the same means). In such cases, MW could have more than alpha level power in rejecting the Null hypothesis but attributing the interpretation of difference in means to such a result would be incorrect.

In the presence of an outlier, the t-test is not robust. For example, for two independent samples when the data distributions are asymmetric (that is, the distributions are skewed) or the distributions have large tails, then the Wilcoxon rank-sum test (also known as the Mann–Whitney U test) can have three to four times higher power than the t-test. The nonparametric counterpart to the paired samples t-test is the Wilcoxon signed-rank test for paired samples. For a discussion on choosing between the t-test and nonparametric alternatives, see Lumley, et al. (2002).

One-way analysis of variance (ANOVA) generalizes the two-sample t-test when the data belong to more than two groups.

A design which includes both paired observations and independent observations

When both paired observations and independent observations are present in the two sample design, assuming data are missing completely at random (MCAR), the paired observations or independent observations may be discarded in order to proceed with the standard tests above. Alternatively making use of all of the available data, assuming normality and MCAR, the generalized partially overlapping samples t-test could be used.

Multivariate testing

A generalization of Student's t statistic, called Hotelling's t-squared statistic, allows for the testing of hypotheses on multiple (often correlated) measures within the same sample. For instance, a researcher might submit a number of subjects to a personality test consisting of multiple personality scales (e.g. the Minnesota Multiphasic Personality Inventory). Because measures of this type are usually positively correlated, it is not advisable to conduct separate univariate t-tests to test hypotheses, as these would neglect the covariance among measures and inflate the chance of falsely rejecting at least one hypothesis (Type I error). In this case a single multivariate test is preferable for hypothesis testing. Fisher's Method for combining multiple tests with alpha reduced for positive correlation among tests is one. Another is Hotelling's T2 statistic follows a T2 distribution. However, in practice the distribution is rarely used, since tabulated values for T2 are hard to find. Usually, T2 is converted instead to an F statistic.

For a one-sample multivariate test, the hypothesis is that the mean vector (μ) is equal to a given vector (μ0). The test statistic is Hotelling's t2:

where n is the sample size, x is the vector of column means and S is an m × m sample covariance matrix.

For a two-sample multivariate test, the hypothesis is that the mean vectors (μ1, μ2) of two samples are equal. The test statistic is Hotelling's two-sample t2:

The two-sample t-test is a special case of simple linear regression

The two-sample t-test is a special case of simple linear regression as illustrated by the following example.

A clinical trial examines 6 patients given drug or placebo. Three (3) patients get 0 units of drug (the placebo group). Three (3) patients get 1 unit of drug (the active treatment group). At the end of treatment, the researchers measure the change from baseline in the number of words that each patient can recall in a memory test.

Scatter plot with six point. Three points on the left and are aligned vertically at the drug dose of 0 units. And the other three points on the right and are aligned vertically at the drug dose of 1 unit.

A table of the patients' word recall and drug dose values are shown below.

Patient drug.dose word.recall
1 0 1
2 0 2
3 0 3
4 1 5
5 1 6
6 1 7

Data and code are given for the analysis using the R programming language with the t.test and lmfunctions for the t-test and linear regression. Here are the same (fictitious) data above generated in R.

> word.recall.data=data.frame(drug.dose=c(0,0,0,1,1,1), word.recall=c(1,2,3,5,6,7))

Perform the t-test. Notice that the assumption of equal variance, var.equal=T, is required to make the analysis exactly equivalent to simple linear regression.

> with(word.recall.data, t.test(word.recall~drug.dose, var.equal=T))

Running the R code gives the following results.

  • The mean word.recall in the 0 drug.dose group is 2.
  • The mean word.recall in the 1 drug.dose group is 6.
  • The difference between treatment groups in the mean word.recall is 6 – 2 = 4.
  • The difference in word.recall between drug doses is significant (p=0.00805).

Perform a linear regression of the same data. Calculations may be performed using the R function lm() for a linear model.

> word.recall.data.lm =  lm(word.recall~drug.dose, data=word.recall.data)
> summary(word.recall.data.lm)

The linear regression provides a table of coefficients and p-values.

Coefficient Estimate Std. Error t value P-value
Intercept 2 0.5774 3.464 0.02572
drug.dose 4 0.8165 4.899 0.000805

The table of coefficients gives the following results.

  • The estimate value of 2 for the intercept is the mean value of the word recall when the drug dose is 0.
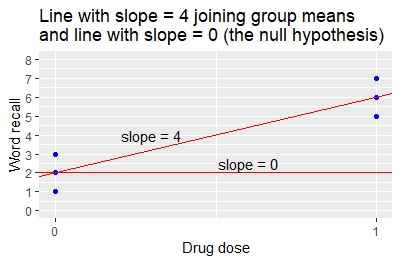
  • The estimate value of 4 for the drug dose indicates that for a 1-unit change in drug dose (from 0 to 1) there is a 4-unit change in mean word recall (from 2 to 6). This is the slope of the line joining the two group means.
  • The p-value that the slope of 4 is different from 0 is p = 0.00805.

The coefficients for the linear regression specify the slope and intercept of the line that joins the two group means, as illustrated in the graph. The intercept is 2 and the slope is 4.

Regression lines

Compare the result from the linear regression to the result from the t-test.

  • From the t-test, the difference between the group means is 6-2=4.
  • From the regression, the slope is also 4 indicating that a 1-unit change in drug dose (from 0 to 1) gives a 4-unit change in mean word recall (from 2 to 6).
  • The t-test p-value for the difference in means, and the regression p-value for the slope, are both 0.00805. The methods give identical results.

This example shows that, for the special case of a simple linear regression where there is a single x-variable that has values 0 and 1, the t-test gives the same results as the linear regression. The relationship can also be shown algebraically.

Recognizing this relationship between the t-test and linear regression facilitates the use of multiple linear regression and multi-way analysis of variance. These alternatives to t-tests allow for the inclusion of additional explanatory variables that are associated with the response. Including such additional explanatory variables using regression or anova reduces the otherwise unexplained variance, and commonly yields greater power to detect differences than do two-sample t-tests.

Direction of fit

From Wikipedia, the free encyclopedia The term " direction of fit "...