Search This Blog

Saturday, May 11, 2024

Nylon

From Wikipedia, the free encyclopedia
Nylon Nylon 6,6 Nylon 6,6 unit
Density 1.15 g/cm3
Electrical conductivity (σ) 10−12 S/m
Thermal conductivity 0.25 W/(m·K)
Melting point 463–624 K
190–350 °C
374–663 °F

Nylon is a family of synthetic polymers with amide backbones, usually linking aliphatic or semi-aromatic groups.

Nylons are white or colorless and soft; some are silk-like. They are thermoplastic, which means that they can be melt-processed into fibers, films, and diverse shapes. The properties of nylons are often modified by blending with a wide variety of additives.

Many kinds of nylon are known. One family, designated nylon-XY, is derived from diamines and dicarboxylic acids of carbon chain lengths X and Y, respectively. An important example is nylon-6,6. Another family, designated nylon-Z, is derived from aminocarboxylic acids of with carbon chain length Z. An example is nylon-[6].

Nylon polymers have significant commercial applications in fabric and fibers (apparel, flooring and rubber reinforcement), in shapes (molded parts for cars, electrical equipment, etc.), and in films (mostly for food packaging).

History

Wallace Carothers

DuPont and the invention of nylon

Researchers at DuPont began developing cellulose-based fibers, culminating in the synthetic fiber rayon. DuPont's experience with rayon was an important precursor to its development and marketing of nylon.

DuPont's invention of nylon spanned an eleven-year period, ranging from the initial research program in polymers in 1927 to its announcement in 1938, shortly before the opening of the 1939 New York World's Fair. The project grew from a new organizational structure at DuPont, suggested by Charles Stine in 1927, in which the chemical department would be composed of several small research teams that would focus on "pioneering research" in chemistry and would "lead to practical applications". Harvard instructor Wallace Hume Carothers was hired to direct the polymer research group. Initially he was allowed to focus on pure research, building on and testing the theories of German chemist Hermann Staudinger. He was very successful, as research he undertook greatly improved the knowledge of polymers and contributed to the science.

Nylon was the first commercially successful synthetic thermoplastic polymer. DuPont began its research project in 1927. The first nylon, nylon 66, was synthesized on February 28, 1935, by Wallace Hume Carothers at DuPont's research facility at the DuPont Experimental Station. In response to Carothers' work, Paul Schlack at IG Farben developed nylon 6, a different molecule based on caprolactam, on January 29, 1938.

In the spring of 1930, Carothers and his team had already synthesized two new polymers. One was neoprene, a synthetic rubber greatly used during World War II. The other was a white elastic but strong paste that would later become nylon. After these discoveries, Carothers' team was made to shift its research from a more pure research approach investigating general polymerization to a more practically focused goal of finding "one chemical combination that would lend itself to industrial applications".

It was not until the beginning of 1935 that a polymer called "polymer 6-6" was finally produced. Carothers' coworker, Washington University alumnus Julian W. Hill had used a cold drawing method to produce a polyester in 1930. This cold drawing method was later used by Carothers in 1935 to fully develop nylon. The first example of nylon (nylon 6.6) was produced on February 28, 1935, at DuPont's research facility at the DuPont Experimental Station. It had all the desired properties of elasticity and strength. However, it also required a complex manufacturing process that would become the basis of industrial production in the future. DuPont obtained a patent for the polymer in September 1938, and quickly achieved a monopoly of the fiber. Carothers died 16 months before the announcement of nylon, therefore he was never able to see his success.

Nylon was first used commercially in a nylon-bristled toothbrush in 1938, followed more famously in women's stockings or "nylons" which were shown at the 1939 New York World's Fair and first sold commercially in 1940, whereupon they became an instant commercial success with 64 million pairs sold during their first year on the market. During World War II, almost all nylon production was diverted to the military for use in parachutes and parachute cord. Wartime uses of nylon and other plastics greatly increased the market for the new materials.

The production of nylon required interdepartmental collaboration between three departments at DuPont: the Department of Chemical Research, the Ammonia Department, and the Department of Rayon. Some of the key ingredients of nylon had to be produced using high pressure chemistry, the main area of expertise of the Ammonia Department. Nylon was considered a "godsend to the Ammonia Department", which had been in financial difficulties. The reactants of nylon soon constituted half of the Ammonia Department's sales and helped them come out of the period of the Great Depression by creating jobs and revenue at DuPont.

DuPont's nylon project demonstrated the importance of chemical engineering in industry, helped create jobs, and furthered the advancement of chemical engineering techniques. In fact, it developed a chemical plant that provided 1800 jobs and used the latest technologies of the time, which are still used as a model for chemical plants today. The ability to acquire a large number of chemists and engineers quickly was a huge contribution to the success of DuPont's nylon project. The first nylon plant was located at Seaford, Delaware, beginning commercial production on December 15, 1939. On October 26, 1995, the Seaford plant was designated a National Historic Chemical Landmark by the American Chemical Society.

Early marketing strategies

An important part of nylon's popularity stems from DuPont's marketing strategy. DuPont promoted the fiber to increase demand before the product was available to the general market. Nylon's commercial announcement occurred on October 27, 1938, at the final session of the Herald Tribune's yearly "Forum on Current Problems", on the site of the approaching New York City world's fair. The "first man-made organic textile fiber" which was derived from "coal, water and air" and promised to be "as strong as steel, as fine as the spider's web" was received enthusiastically by the audience, many of them middle-class women, and made the headlines of most newspapers. Nylon was introduced as part of "The world of tomorrow" at the 1939 New York World's Fair and was featured at DuPont's "Wonder World of Chemistry" at the Golden Gate International Exposition in San Francisco in 1939. Actual nylon stockings were not shipped to selected stores in the national market until May 15, 1940. However, a limited number were released for sale in Delaware before that. The first public sale of nylon stockings occurred on October 24, 1939, in Wilmington, Delaware. 4,000 pairs of stockings were available, all of which were sold within three hours.

Another added bonus to the campaign was that it meant reducing silk imports from Japan, an argument that won over many wary customers. Nylon was even mentioned by President Roosevelt's cabinet, which addressed its "vast and interesting economic possibilities" five days after the material was formally announced.

However, the early excitement over nylon also caused problems. It fueled unreasonable expectations that nylon would be better than silk, a miracle fabric as strong as steel that would last forever and never run. Realizing the danger of claims such as "New Hosiery Held Strong as Steel" and "No More Runs", DuPont scaled back the terms of the original announcement, especially those stating that nylon would possess the strength of steel.

Also, DuPont executives marketing nylon as a revolutionary man-made material did not at first realize that some consumers experienced a sense of unease and distrust, even fear, towards synthetic fabrics. A particularly damaging news story, drawing on DuPont's 1938 patent for the new polymer, suggested that one method of producing nylon might be to use cadaverine (pentamethylenediamine), a chemical extracted from corpses. Although scientists asserted that cadaverine was also extracted by heating coal, the public often refused to listen. A woman confronted one of the lead scientists at DuPont and refused to accept that the rumour was not true.

DuPont changed its campaign strategy, emphasizing that nylon was made from "coal, air and water", and started focusing on the personal and aesthetic aspects of nylon, rather than its intrinsic qualities. Nylon was thus domesticated, and attention shifted to the material and consumer aspect of the fiber with slogans like "If it's nylon, it's prettier, and oh! How fast it dries!".

Production of nylon fabric

Nylon stockings being inspected in Malmö, Sweden, in 1954

After nylon's nationwide release in 1940, production was increased. 1300 tons of the fabric were produced during 1940. During their first year on the market, 64 million pairs of nylon stockings were sold. In 1941, a second plant was opened in Martinsville, Virginia, due to the success of the fabric.

Close-up photograph of the knitted nylon fabric used in stockings
Nylon fibers visualized using scanning electron microscopy

While nylon was marketed as the durable and indestructible material of the people, it was sold at about one-and-a-half times the price of silk stockings ($4.27 per pound of nylon versus $2.79 per pound of silk). Sales of nylon stockings were strong in part due to changes in women's fashion. As Lauren Olds explains: "by 1939 [hemlines] had inched back up to the knee, closing the decade just as it started off". The shorter skirts were accompanied by a demand for stockings that offered fuller coverage without the use of garters to hold them up.

However, as of February 11, 1942, nylon production was redirected from being a consumer material to one used by the military. DuPont's production of nylon stockings and other lingerie stopped, and most manufactured nylon was used to make parachutes and tents for World War II. Although nylon stockings already made before the war could be purchased, they were generally sold on the black market for as high as $20.

Once the war ended, the return of nylon was awaited with great anticipation. Although DuPont projected yearly production of 360 million pairs of stockings, there were delays in converting back to consumer rather than wartime production. In 1946, the demand for nylon stockings could not be satisfied, which led to the Nylon riots. In one instance, an estimated 40,000 people lined up in Pittsburgh to buy 13,000 pairs of nylons. In the meantime, women cut up nylon tents and parachutes left from the war in order to make blouses and wedding dresses. Between the end of the war and 1952, production of stockings and lingerie used 80% of the world's nylon. DuPont put focus on catering to the civilian demand, and continually expanded its production.

Introduction of nylon blends

As pure nylon hosiery was sold in a wider market, problems became apparent. Nylon stockings were found to be fragile, in the sense that the thread often tended to unravel lengthwise, creating 'runs'. People also reported that pure nylon textiles could be uncomfortable due to nylon's lack of absorbency. Moisture stayed inside the fabric near the skin under hot or moist conditions instead of being "wicked" away. Nylon fabric could also be itchy and tended to cling and sometimes spark as a result of static electrical charge built up by friction. Also, under some conditions, stockings could decompose turning back into nylon's original components of air, coal, and water. Scientists explained this as a result of air pollution, attributing it to London smog in 1952, as well as poor air quality in New York and Los Angeles.

The solution found to problems with pure nylon fabric was to blend nylon with other existing fibers or polymers such as cotton, polyester, and spandex. This led to the development of a wide array of blended fabrics. The new nylon blends retained the desirable properties of nylon (elasticity, durability, ability to be dyed) and kept clothes prices low and affordable. As of 1950, the New York Quartermaster Procurement Agency (NYQMPA), which developed and tested textiles for the Army and Navy, had committed to developing a wool-nylon blend. They were not the only ones to introduce blends of both natural and synthetic fibers. America's Textile Reporter referred to 1951 as the "Year of the blending of the fibers". Fabric blends included mixes like "Bunara" (wool-rabbit-nylon) and "Casmet" (wool-nylon-fur). In Britain, in November 1951, the inaugural address of the 198th session of the Royal Society for the Encouragement of Arts, Manufactures and Commerce focused on the blending of textiles.

DuPont's Fabric Development Department cleverly targeted French fashion designers, supplying them with fabric samples. In 1955, designers such as Coco Chanel, Jean Patou, and Christian Dior showed gowns created with DuPont fibers, and fashion photographer Horst P. Horst was hired to document their use of DuPont fabrics. American Fabrics credited blends with providing "creative possibilities and new ideas for fashions which had been hitherto undreamed of."

Etymology

DuPont went through an extensive process to generate names for its new product. In 1940, John W. Eckelberry of DuPont stated that the letters "nyl" were arbitrary, and the "on" was copied from the suffixes of other fibers such as cotton and rayon. A later publication by DuPont (Context, vol. 7, no. 2, 1978) explained that the name was originally intended to be "No-Run" ("run" meaning "unravel") but was modified to avoid making such an unjustified claim. Since the products were not really run-proof, the vowels were swapped to produce "nuron", which was changed to "nilon" "to make it sound less like a nerve tonic". For clarity in pronunciation, the "i" was changed to "y".

A persistent urban legend exists that the name is derived from "New York" and "London"; however, no organisation in London was ever involved in the research and production of nylon.

Longer-term popularity

Nylon’s popularity soared in the 1940s and 1950s due to its durability and sheerness. In the 1970s, it became more popular due to its flexibility and price.

In spite of oil shortages in the 1970s, consumption of nylon textiles continued to grow by 7.5% per year between the 1960s and 1980s. Overall production of synthetic fibers, however, dropped from 63% of the worlds textile production in 1965, to 45% of the world's textile production in early 1970s. The appeal of "new" technologies wore off, and nylon fabric "was going out of style in the 1970s". Also, consumers became concerned about environmental costs throughout the production cycle: obtaining the raw materials (oil), energy use during production, waste produced during creation of the fiber, and eventual waste disposal of materials that were not biodegradable. Synthetic fibers have not dominated the market since the 1950s and 1960s. As of 2020, the worldwide production of nylon is estimated at 8.9 million tons.

Although pure nylon has many flaws and is now rarely used, its derivatives have greatly influenced and contributed to society. From scientific discoveries relating to the production of plastics and polymerization, to economic impact during the depression and the changing of women's fashion, nylon was a revolutionary product. The Lunar Flag Assembly, the first flag planted on the moon in a symbolic gesture of celebration, was made of nylon. The flag itself cost $5.50 but had to have a specially designed flagpole with a horizontal bar so that it would appear to "fly". One historian describes nylon as "an object of desire", comparing the invention to Coca-Cola in the eyes of 20th century consumers.

Chemistry

In common usage, the prefix "PA" (polyamide) or the name "Nylon" are used interchangeably and are equivalent in meaning.

The nomenclature used for nylon polymers was devised during the synthesis of the first simple aliphatic nylons and uses numbers to describe the number of carbons in each monomer unit, including the carbon(s) of the carboxylic acid(s). Subsequent use of cyclic and aromatic monomers required the use of letters or sets of letters. One number after "PA" or "Nylon" indicates a homopolymer which is monadic or based on one amino acid (minus H2O) as monomer:

PA 6 or Nylon 6: [NH−(CH2)5−CO]n made from ε-caprolactam.

Two numbers or sets of letters indicate a dyadic homopolymer formed from two monomers: one diamine and one dicarboxylic acid. The first number indicates the number of carbons in the diamine. The two numbers should be separated by a comma for clarity, but the comma is often omitted.

PA or Nylon 6,10 (or 610): [NH−(CH2)6−NH−CO−(CH2)8−CO]n made from hexamethylenediamine and sebacic acid;

For copolymers the comonomers or pairs of comonomers are separated by slashes:

PA 6/66: [NH−(CH2)6−NH−CO−(CH2)4−CO]n−[NH−(CH2)5−CO]m made from caprolactam, hexamethylenediamine and adipic acid;
PA 66/610: [NH−(CH2)6−NH−CO−(CH2)4−CO]n−[NH−(CH2)6−NH−CO−(CH2)8−CO]m made from hexamethylenediamine, adipic acid and sebacic acid.

The term polyphthalamide (abbreviated to PPA) is used when 60% or more moles of the carboxylic acid portion of the repeating unit in the polymer chain is composed of a combination of terephthalic acid (TPA) and isophthalic acid (IPA).

Types

Nylon 66 and related heteropolymers

Nylon 66 and related polyamides are condensation polymers forms from equal parts of diamine and dicarboxylic acids. In the first case, the "repeating unit" has the ABAB structure, as also seen in many polyesters and polyurethanes. Since each monomer in this copolymer has the same reactive group on both ends, the direction of the amide bond reverses between each monomer, unlike natural polyamide proteins, which have overall directionality: C terminal → N terminal. In the second case (so called AA), the repeating unit corresponds to the single monomer.

Wallace Carothers at DuPont patented nylon 66. In the case of nylons that involve reaction of a diamine and a dicarboxylic acid, it is difficult to get the proportions exactly correct, and deviations can lead to chain termination at molecular weights less than a desirable 10,000 daltons (u). To overcome this problem, a crystalline, solid "nylon salt" can be formed at room temperature, using an exact 1:1 ratio of the acid and the base to neutralize each other. The salt is crystallized to purify it and obtain the desired precise stoichiometry. Heated to 285 °C (545 °F), the salt reacts to form nylon polymer with the production of water.

Nylon 510, made from pentamethylene diamine and sebacic acid, was included in the Carothers patent to nylon 66 Nylon 610 is produced similarly using hexamethylene diamine. These materials are more expensive because of the relatively high cost of sebacic acid. Owing to the high hydrocarbon content, nylon 610 is more hydrophobic and finds applications suited for this property, such as bristles.

Commercial heteropolymer polyamides

1,4-diamino­butane 1,5-diamino­pentane MPMD HMD MXD Nonane­diamine Decane­diamine Dodecane­diamine Bis­(para-amino­cyclohexyl)­methane Trimethyl­hexamethylene­diamine
Adipic acid 46
D6 66 MXD6


Sebacic acid 410 510
610

1010


Dodecanedioic acid


612


1212 PACM12
Terephthalic acid 4T
DT 6T
9T 10T 12T
TMDT
Isophthalic acid

DI 6I


Examples of these polymers that are or were commercially available:

  • PA46 DSM Stanyl
  • PA410 DSM Ecopaxx
  • PA4T DSM Four Tii
  • PA66 DuPont Zytel

Nylon 6 and related homopolymers

These polymers are made from a lactam or amino acid. The synthetic route using lactams (cyclic amides) was developed by Paul Schlack at IG Farben, leading to nylon 6, or polycaprolactam—formed by a ring-opening polymerization. The peptide bond within the caprolactam is broken with the exposed active groups on each side being incorporated into two new bonds as the monomer becomes part of the polymer backbone.

The 428 °F (220 °C) melting point of nylon 6 is lower than the 509 °F (265 °C) melting point of nylon 66. Homopolymer nylons are derived from one monomer.

Monomer Polymer
Caprolactam 6
11-aminoundecanoic acid 11
ω-aminolauric acid 12

Examples of these polymers that are or were commercially available:

  • PA6 Lanxess Durethan B
  • PA11 Arkema Rilsan
  • PA12 Evonik Vestamid L

Nylon 1,6

Nylons can also be synthesized from dinitriles using acid catalysis. For example, this method is applicable for preparation of nylon 1,6 from adiponitrile, formaldehyde and water. Additionally, nylons can be synthesized from diols and dinitriles using this method as well.

Copolymers

It is easy to make mixtures of the monomers or sets of monomers used to make nylons to obtain copolymers. This lowers crystallinity and can therefore lower the melting point.

Some copolymers that have been or are commercially available are listed below:

  • PA6/66 DuPont Zytel
  • PA6/6T BASF Ultramid T (6/6T copolymer)
  • PA6I/6T DuPont Selar PA
  • PA66/6T DuPont Zytel HTN
  • PA12/MACMI EMS Grilamid TR

Blends

Most nylon polymers are miscible with each other allowing a range of blends to be made. The two polymers can react with one another by transamidation to form random copolymers.

According to their crystallinity, polyamides can be:

  • semi-crystalline:
    • high crystallinity: PA46 and PA66;
    • low crystallinity: PAMXD6 made from m-xylylenediamine and adipic acid;
  • amorphous: PA6I made from hexamethylenediamine and isophthalic acid.

According to this classification, PA66, for example, is an aliphatic semi-crystalline homopolyamide.

Environmental impact

The general chemical reaction involving hydrolysis of an amide to form a carboxylic acid and an amine

All nylons are susceptible to hydrolysis, especially by strong acids, a reaction essentially the reverse of their synthesis. The molecular weight of nylon products so attacked drops, and cracks form quickly at the affected zones. Lower members of the nylons (such as nylon 6) are affected more than higher members such as nylon 12. This means that nylon parts cannot be used in contact with sulfuric acid for example, such as the electrolyte used in lead–acid batteries.

When being molded, nylon must be dried to prevent hydrolysis in the molding machine barrel since water at high temperatures can also degrade the polymer. The reaction is shown above.

The average greenhouse gas footprint of nylon in manufacturing carpets is estimated at 5.43 kg CO2 equivalent per kg, when produced in Europe. This gives it almost the same carbon footprint as wool, but with greater durability and therefore a lower overall carbon footprint.

Data published by PlasticsEurope indicates for nylon 66 a greenhouse gas footprint of 6.4 kg CO2 equivalent per kg, and an energy consumption of 138 kJ/kg. When considering the environmental impact of nylon, it is important to consider the use phase.

Various nylons break down in fire and form hazardous smoke, and toxic fumes or ash, typically containing hydrogen cyanide. Incinerating nylons to recover the high energy used to create them is usually expensive, so most nylons reach the garbage dumps, decaying slowly. Discarded nylon fabric takes 30–40 years to decompose. Nylon used in discarded fishing gear such as fishing nets is a contributor to debris in the ocean. Nylon is a robust polymer and lends itself well to recycling. Much nylon resin is recycled directly in a closed loop at the injection molding machine, by grinding sprues and runners and mixing them with the virgin granules being consumed by the molding machine.

Because of the expense and difficulties of the nylon recycling process, few companies utilize it while most favor using cheaper, newly made plastics for their products instead. US clothing company Patagonia has products containing recycled nylon and in the mid-2010s invested in Bureo, a company that recycles nylon from used fishing nets to use in sunglasses and skateboards. The Italian company Aquafil also has demonstrated recycling fishing nets lost in the ocean into apparel. Vanden Recycling recycles nylon and other polyamides (PA) and has operations in the UK, Australia, Hong Kong, the UAE, Turkey and Finland.

Nylon is the most popular fiber type in the residential carpet industry today. The US EPA estimates that 9.2% of carpet fiber, backing and padding was recycled in 2018, 17.8% was incinerated in waste-to-energy facilities, and 73% was discarded in landfills. Some of the world's largest carpet and rug companies are promoting "cradle to cradle"—the re-use of non-virgin materials including ones not historically recycled—as the industry's pathway forward.

Properties

Above their melting temperatures, Tm, thermoplastics like nylon are amorphous solids or viscous fluids in which the chains approximate random coils. Below Tm, amorphous regions alternate with regions which are lamellar crystals. The amorphous regions contribute elasticity, and the crystalline regions contribute strength and rigidity. The planar amide (-CO-NH-) groups are very polar, so nylon forms multiple hydrogen bonds among adjacent strands. Because the nylon backbone is so regular and symmetrical, especially if all the amide bonds are in the trans configuration, nylons often have high crystallinity and make excellent fibers. The amount of crystallinity depends on the details of formation, as well as on the kind of nylon.
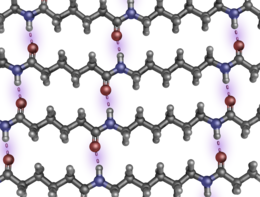
Hydrogen bonding in Nylon 66 (in mauve)

Nylon 66 can have multiple parallel strands aligned with their neighboring peptide bonds at coordinated separations of exactly six and four carbons for considerable lengths, so the carbonyl oxygens and amide hydrogens can line up to form interchain hydrogen bonds repeatedly, without interruption (see the figure opposite). Nylon 510 can have coordinated runs of five and eight carbons. Thus parallel (but not antiparallel) strands can participate in extended, unbroken, multi-chain β-pleated sheets, a strong and tough supermolecular structure similar to that found in natural silk fibroin and the β-keratins in feathers. (Proteins have only an amino acid α-carbon separating sequential -CO-NH- groups.) Nylon 6 will form uninterrupted H-bonded sheets with mixed directionalities, but the β-sheet wrinkling is somewhat different. The three-dimensional disposition of each alkane hydrocarbon chain depends on rotations about the 109.47° tetrahedral bonds of singly bonded carbon atoms.

When extruded into fibers through pores in an industry spinneret, the individual polymer chains tend to align because of viscous flow. If subjected to cold drawing afterwards, the fibers align further, increasing their crystallinity, and the material acquires additional tensile strength. In practice, nylon fibers are most often drawn using heated rolls at high speeds.

Block nylon tends to be less crystalline, except near the surfaces due to shearing stresses during formation. Nylon is clear and colorless, or milky, but is easily dyed. Multistranded nylon cord and rope is slippery and tends to unravel. The ends can be melted and fused with a heat source such as a flame or electrode to prevent this.

Nylons are hygroscopic and will absorb or desorb moisture as a function of the ambient humidity. Variations in moisture content have several effects on the polymer. Firstly, the dimensions will change, but more importantly moisture acts as a plasticizer, lowering the glass transition temperature (Tg), and consequently the elastic modulus at temperatures below the Tg

When dry, polyamide is a good electrical insulator. However, polyamide is hygroscopic. The absorption of water will change some of the material's properties such as its electrical resistance. Nylon is less absorbent than wool or cotton.

The characteristic features of nylon 66 include:

  • Pleats and creases can be heat-set at higher temperatures
  • More compact molecular structure
  • Better weathering properties; better sunlight resistance
  • Softer "Hand"
  • High melting point (256 °C, 492.8 °F)
  • Superior colorfastness
  • Excellent abrasion resistance

On the other hand, nylon 6 is easy to dye, more readily fades; it has a higher impact resistance, a more rapid moisture absorption, greater elasticity, and elastic recovery.

  • Variation of luster: nylon has the ability to be very lustrous, semi-lustrous, or dull.
  • Durability: its high tenacity fibers are used for seatbelts, tire cords, ballistic cloth, and other uses.
  • High elongation
  • Excellent abrasion resistance
  • Highly resilient (nylon fabrics are heat-set)
  • Paved the way for easy-care garments
  • High resistance to insects, fungi, animals, as well as molds, mildew, rot, and many chemicals
  • Used in carpets and nylon stockings
  • Melts instead of burning
  • Used in many military applications
  • Good specific strength
  • Transparent to infrared light (−12 dB)

Nylon clothing tends to be less flammable than cotton and rayon, but nylon fibers may melt and stick to skin.

Uses

Nylon was first used commercially in a nylon-bristled toothbrush in 1938, followed more famously in women's stockings or "nylons" which were shown at the 1939 New York World's Fair and first sold commercially in 1940. Its use increased dramatically during World War II, when the need for fabrics increased dramatically.

Fibers

These worn out nylon stockings will be reprocessed and made into parachutes for army fliers c. 1942
Blue Nylon fabric ball gown by Emma Domb, Science History Institute

Bill Pittendreigh, DuPont, and other individuals and corporations worked diligently during the first few months of World War II to find a way to replace Asian silk and hemp with nylon in parachutes. It was also used to make tires, tents, ropes, ponchos, and other military supplies. It was even used in the production of a high-grade paper for U.S. currency. At the outset of the war, cotton accounted for more than 80% of all fibers used and manufactured, and wool fibers accounted for nearly all of the rest. By August 1945, manufactured fibers had taken a market share of 25%, at the expense of cotton. After the war, because of shortages of both silk and nylon, nylon parachute material was sometimes repurposed to make dresses.

Nylon 6 and 66 fibers are used in carpet manufacture.

Nylon is one kind of fiber used in tire cord. Herman E. Schroeder pioneered application of nylon in tires.

Molds and resins

Nylon resins are widely used in the automobile industry especially in the engine compartment.

Molded nylon is used in hair combs and mechanical parts such as machine screws, gears, gaskets, and other low- to medium-stress components previously cast in metal. Engineering-grade nylon is processed by extrusion, casting, and injection molding. Type 6,6 Nylon 101 is the most common commercial grade of nylon, and Nylon 6 is the most common commercial grade of molded nylon. For use in tools such as spudgers, nylon is available in glass-filled variants which increase structural and impact strength and rigidity, and molybdenum disulfide-filled variants which increase lubricity. Nylon can be used as the matrix material in composite materials, with reinforcing fibers like glass or carbon fiber; such a composite has a higher density than pure nylon. Such thermoplastic composites (25% to 30% glass fiber) are frequently used in car components next to the engine, such as intake manifolds, where the good heat resistance of such materials makes them feasible competitors to metals.

Nylon was used to make the stock of the Remington Nylon 66 rifle. The frame of the modern Glock pistol is made of a nylon composite.

Food packaging

Nylon resins are used as a component of food packaging films where an oxygen barrier is needed. Some of the terpolymers based upon nylon are used every day in packaging. Nylon has been used for meat wrappings and sausage sheaths. The high temperature resistance of nylon makes it useful for oven bags.

Filaments

Nylon filaments are primarily used in brushes especially toothbrushes and string trimmers. They are also used as monofilaments in fishing line. Nylon 610 and 612 are the most used polymers for filaments.

Its various properties also make it very useful as a material in additive manufacturing; specifically, as a filament in consumer and professional grade fused deposition modeling 3D printers.

Other forms

Nylon resins can be extruded into rods, tubes, and sheets.

Nylon powders are used to powder coat metals. Nylon 11 and nylon 12 are the most widely used.

In the mid-1940s, classical guitarist Andrés Segovia mentioned the shortage of good guitar strings in the United States, particularly his favorite Pirastro catgut strings, to a number of foreign diplomats at a party, including General Lindeman of the British Embassy. A month later, the General presented Segovia with some nylon strings which he had obtained via some members of the DuPont family. Segovia found that although the strings produced a clear sound, they had a faint metallic timbre which he hoped could be eliminated. Nylon strings were first tried on stage by Olga Coelho in New York in January 1944. In 1946, Segovia and string maker Albert Augustine were introduced by their mutual friend Vladimir Bobri, editor of Guitar Review. On the basis of Segovia's interest and Augustine's past experiments, they decided to pursue the development of nylon strings. DuPont, skeptical of the idea, agreed to supply the nylon if Augustine would endeavor to develop and produce the actual strings. After three years of development, Augustine demonstrated a nylon first string whose quality impressed guitarists, including Segovia, in addition to DuPont. Wound strings, however, were more problematic. Eventually, however, after experimenting with various types of metal and smoothing and polishing techniques, Augustine was also able to produce high quality nylon wound strings.
Vapor pressure

From Wikipedia, the free encyclopedia
https://en.wikipedia.org/wiki/Vapor_pressure
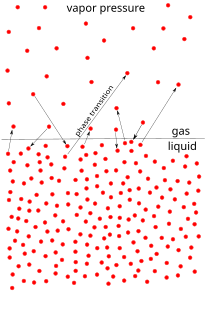
The microscopic process of evaporation and condensation at the liquid surface.
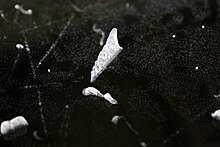
If vapor pressure exceeds the thermodynamic equilibrium value, condensation occurs in presence of nucleation sites. This principle is indigenous in cloud chambers, where ionized particles form condensation tracks when passing through.
The pistol test tube experiment. The tube contains alcohol and is closed with a piece of cork. By heating the alcohol, the vapors fill in the space, increasing the pressure in the tube to the point of the cork popping out.

Vapor pressure or equilibrium vapor pressure is the pressure exerted by a vapor in thermodynamic equilibrium with its condensed phases (solid or liquid) at a given temperature in a closed system. The equilibrium vapor pressure is an indication of a liquid's thermodynamic tendency to evaporate. It relates to the balance of particles escaping from the liquid (or solid) in equilibrium with those in a coexisting vapor phase. A substance with a high vapor pressure at normal temperatures is often referred to as volatile. The pressure exhibited by vapor present above a liquid surface is known as vapor pressure. As the temperature of a liquid increases, the attractive interactions between liquid molecules become less significant in comparison to the entropy of those molecules in the gas phase, increasing the vapor pressure. Thus, liquids with strong intermolecular interactions are likely to have smaller vapor pressures, with the reverse true for weaker interactions.

The vapor pressure of any substance increases non-linearly with temperature, often described by the Clausius–Clapeyron relation. The atmospheric pressure boiling point of a liquid (also known as the normal boiling point) is the temperature at which the vapor pressure equals the ambient atmospheric pressure. With any incremental increase in that temperature, the vapor pressure becomes sufficient to overcome atmospheric pressure and cause the liquid to form vapor bubbles. Bubble formation in high liquid depths requires a slightly higher temperature due to the higher fluid pressure, due to hydrostatic pressure of the fluid mass above. More important at shallow depths is the higher temperature required to start bubble formation. The surface tension of the bubble wall leads to an overpressure in the very small, initial bubbles.

The vapor pressure that a single component in a mixture contributes to the total pressure in the system is called partial pressure. For example, air at sea level, and saturated with water vapor at 20 °C, has partial pressures of about 2.3 kPa of water, 78 kPa of nitrogen, 21 kPa of oxygen and 0.9 kPa of argon, totaling 102.2 kPa, making the basis for standard atmospheric pressure.

Measurement and units

Vapor pressure is measured in the standard units of pressure. The International System of Units (SI) recognizes pressure as a derived unit with the dimension of force per area and designates the pascal (Pa) as its standard unit. One pascal is one newton per square meter (N·m−2 or kg·m−1·s−2).

Experimental measurement of vapor pressure is a simple procedure for common pressures between 1 and 200 kPa.[1] Most accurate results are obtained near the boiling point of substances and large errors result for measurements smaller than 1kPa. Procedures often consist of purifying the test substance, isolating it in a container, evacuating any foreign gas, then measuring the equilibrium pressure of the gaseous phase of the substance in the container at different temperatures. Better accuracy is achieved when care is taken to ensure that the entire substance and its vapor are at the prescribed temperature. This is often done, as with the use of an isoteniscope, by submerging the containment area in a liquid bath.

Very low vapor pressures of solids can be measured using the Knudsen effusion cell method.

In a medical context, vapor pressure is sometimes expressed in other units, specifically millimeters of mercury (mmHg). This is important for volatile inhalational anesthetics, most of which are liquids at body temperature, but with a relatively high vapor pressure.

Estimating vapor pressures with Antoine equation

The Antoine equation is a pragmatic mathematical expression of the relation between the vapor pressure and the temperature of pure liquid or solid substances. It is obtained by curve-fitting and is adapted to the fact that vapor pressure is usually increasing and concave as a function of temperature. The basic form of the equation is:

and it can be transformed into this temperature-explicit form:

where:

  • is the absolute vapor pressure of a substance
  • is the temperature of the substance
  • , and are substance-specific coefficients (i.e., constants or parameters)
  • is typically either or

A simpler form of the equation with only two coefficients is sometimes used:

which can be transformed to:

Sublimations and vaporizations of the same substance have separate sets of Antoine coefficients, as do components in mixtures. Each parameter set for a specific compound is only applicable over a specified temperature range. Generally, temperature ranges are chosen to maintain the equation's accuracy of a few up to 8–10 percent. For many volatile substances, several different sets of parameters are available and used for different temperature ranges. The Antoine equation has poor accuracy with any single parameter set when used from a compound's melting point to its critical temperature. Accuracy is also usually poor when vapor pressure is under 10 Torr because of the limitations of the apparatus used to establish the Antoine parameter values.

The Wagner equation gives "one of the best" fits to experimental data but is quite complex. It expresses reduced vapor pressure as a function of reduced temperature.

Relation to boiling point of liquids

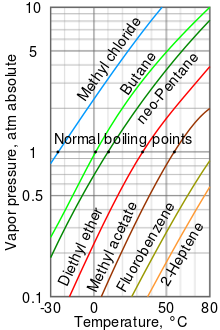
A log-lin vapor pressure chart for various liquids

As a general trend, vapor pressures of liquids at ambient temperatures increase with decreasing boiling points. This is illustrated in the vapor pressure chart (see right) that shows graphs of the vapor pressures versus temperatures for a variety of liquids. At the normal boiling point of a liquid, the vapor pressure is equal to the standard atmospheric pressure defined as 1 atmosphere, 760 Torr, 101.325 kPa, or 14.69595 psi.

For example, at any given temperature, methyl chloride has the highest vapor pressure of any of the liquids in the chart. It also has the lowest normal boiling point at −24.2 °C (−11.6 °F), which is where the vapor pressure curve of methyl chloride (the blue line) intersects the horizontal pressure line of one atmosphere (atm) of absolute vapor pressure.

Although the relation between vapor pressure and temperature is non-linear, the chart uses a logarithmic vertical axis to produce slightly curved lines, so one chart can graph many liquids. A nearly straight line is obtained when the logarithm of the vapor pressure is plotted against 1/(T + 230) where T is the temperature in degrees Celsius. The vapor pressure of a liquid at its boiling point equals the pressure of its surrounding environment.

Liquid mixtures: Raoult's law

Raoult's law gives an approximation to the vapor pressure of mixtures of liquids. It states that the activity (pressure or fugacity) of a single-phase mixture is equal to the mole-fraction-weighted sum of the components' vapor pressures:

where is the mixture's vapor pressure, is the mole fraction of component in the liquid phase and is the mole fraction of component in the vapor phase respectively. is the vapor pressure of component . Raoult's law is applicable only to non-electrolytes (uncharged species); it is most appropriate for non-polar molecules with only weak intermolecular attractions (such as London forces).

Systems that have vapor pressures higher than indicated by the above formula are said to have positive deviations. Such a deviation suggests weaker intermolecular attraction than in the pure components, so that the molecules can be thought of as being "held in" the liquid phase less strongly than in the pure liquid. An example is the azeotrope of approximately 95% ethanol and water. Because the azeotrope's vapor pressure is higher than predicted by Raoult's law, it boils at a temperature below that of either pure component.

There are also systems with negative deviations that have vapor pressures that are lower than expected. Such a deviation is evidence for stronger intermolecular attraction between the constituents of the mixture than exists in the pure components. Thus, the molecules are "held in" the liquid more strongly when a second molecule is present. An example is a mixture of trichloromethane (chloroform) and 2-propanone (acetone), which boils above the boiling point of either pure component.

The negative and positive deviations can be used to determine thermodynamic activity coefficients of the components of mixtures.

Solids

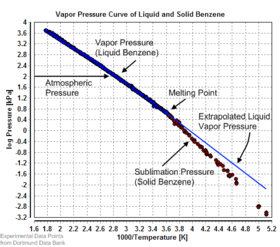
Vapor pressure of liquid and solid benzene

Equilibrium vapor pressure can be defined as the pressure reached when a condensed phase is in equilibrium with its own vapor. In the case of an equilibrium solid, such as a crystal, this can be defined as the pressure when the rate of sublimation of a solid matches the rate of deposition of its vapor phase. For most solids this pressure is very low, but some notable exceptions are naphthalene, dry ice (the vapor pressure of dry ice is 5.73 MPa (831 psi, 56.5 atm) at 20 °C, which causes most sealed containers to rupture), and ice. All solid materials have a vapor pressure. However, due to their often extremely low values, measurement can be rather difficult. Typical techniques include the use of thermogravimetry and gas transpiration.

There are a number of methods for calculating the sublimation pressure (i.e., the vapor pressure) of a solid. One method is to estimate the sublimation pressure from extrapolated liquid vapor pressures (of the supercooled liquid), if the heat of fusion is known, by using this particular form of the Clausius–Clapeyron relation:

where:

  • is the sublimation pressure of the solid component at the temperature .
  • is the extrapolated vapor pressure of the liquid component at the temperature .
  • is the heat of fusion.
  • is the gas constant.
  • is the sublimation temperature.
  • is the melting point temperature.

This method assumes that the heat of fusion is temperature-independent, ignores additional transition temperatures between different solid phases, and it gives a fair estimation for temperatures not too far from the melting point. It also shows that the sublimation pressure is lower than the extrapolated liquid vapor pressure (ΔfusH > 0) and the difference grows with increased distance from the melting point.

Boiling point of water

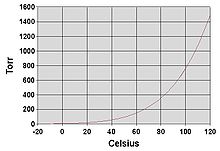
Graph of water vapor pressure versus temperature. At the normal boiling point of 100 °C, it equals the standard atmospheric pressure of 760 torr or 101.325 kPa.

Like all liquids, water boils when its vapor pressure reaches its surrounding pressure. In nature, the atmospheric pressure is lower at higher elevations and water boils at a lower temperature. The boiling temperature of water for atmospheric pressures can be approximated by the Antoine equation:

or transformed into this temperature-explicit form:

where the temperature is the boiling point in degrees Celsius and the pressure is in torr.

Dühring's rule

Dühring's rule states that a linear relationship exists between the temperatures at which two solutions exert the same vapor pressure.

Examples

The following table is a list of a variety of substances ordered by increasing vapor pressure (in absolute units).

Substance Vapor pressure Temperature
(°C)
(Pa) (bar) (mmHg)
Octaethylene glycol 9.2×10⁻⁸ Pa 9.2×10⁻¹³ 6.9×10⁻¹⁰ 89.85
Glycerol 0.4 Pa 0.000004 0.003 50
Mercury 1 Pa 0.00001 0.0075 41.85
Tungsten 1 Pa 0.00001 0.0075 3203
Xenon difluoride 600 Pa 0.006 4.50 25
Water (H2O) 2.3 kPa 0.023 17.5 20
Propanol 2.4 kPa 0.024 18.0 20
Methyl isobutyl ketone 2.66 kPa 0.0266 19.95 25
Iron pentacarbonyl 2.80 kPa 0.028 21 20
Ethanol 5.83 kPa 0.0583 43.7 20
Freon 113 37.9 kPa 0.379 284 20
Acetaldehyde 98.7 kPa 0.987 740 20
Butane 220 kPa 2.2 1650 20
Formaldehyde 435.7 kPa 4.357 3268 20
Propane 997.8 kPa 9.978 7584 26.85
Carbonyl sulfide 1.255 MPa 12.55 9412 25
Nitrous oxide 5.660 MPa 56.60 42453 25
Carbon dioxide 5.7 MPa 57 42753 20

Estimating vapor pressure from molecular structure

Several empirical methods exist to estimate the vapor pressure from molecular structure for organic molecules. Some examples are SIMPOL.1 method, the method of Moller et al., and EVAPORATION (Estimation of VApour Pressure of ORganics, Accounting for Temperature, Intramolecular, and Non-additivity effects).

Meaning in meteorology

In meteorology, the term vapor pressure means the partial pressure of water vapor in the atmosphere, even if it is not in equilibrium. This differs from its meaning in other sciences. According to the American Meteorological Society Glossary of Meteorology, saturation vapor pressure properly refers to the equilibrium vapor pressure of water above a flat surface of liquid water or solid ice, and is a function only of temperature and whether the condensed phase is liquid or solid. Relative humidity is defined relative to saturation vapor pressure. Equilibrium vapor pressure does not require the condensed phase to be a flat surface; it might consist of tiny droplets possibly containing solutes (impurities), such as a cloud. Equilibrium vapor pressure may differ significantly from saturation vapor pressure depending on the size of droplets and presence of other particles which act as cloud condensation nuclei.

However, these terms are used inconsistently, and some authors use "saturation vapor pressure" outside the narrow meaning given by the AMS Glossary. For example, a text on atmospheric convection states, "The Kelvin effect causes the saturation vapor pressure over the curved surface of the droplet to be greater than that over a flat water surface" (emphasis added).

The still-current term saturation vapor pressure derives from the obsolete theory that water vapor dissolves into air, and that air at a given temperature can only hold a certain amount of water before becoming "saturated". Actually, as stated by Dalton's law (known since 1802), the partial pressure of water vapor or any substance does not depend on air at all, and the relevant temperature is that of the liquid. Nevertheless, the erroneous belief persists among the public and even meteorologists, aided by the misleading terms saturation pressure and supersaturation and the related definition of relative humidity.

Subject-oriented programming

In computing, subject-oriented programming is an object-oriented software paradigm in which the state (fields) and behavior (methods) of objects are not seen as intrinsic to the objects themselves, but are provided by various subjective perceptions ("subjects") of the objects. The term and concepts were first published in September 1993 in a conference paper which was later recognized as being one of the three most influential papers to be presented at the conference between 1986 and 1996. As illustrated in that paper, an analogy is made with the contrast between the philosophical views of Plato and Kant with respect to the characteristics of "real" objects, but applied to software ones. For example, while we may all perceive a tree as having a measurable height, weight, leaf-mass, etc., from the point of view of a bird, a tree may also have measures of relative value for food or nesting purposes, or from the point of view of a tax-assessor, it may have a certain taxable value in a given year. Neither the bird's nor the tax-assessor's additional state information need be seen as intrinsic to the tree, but are added by the perceptions of the bird and tax-assessor, and from Kant's analysis, the same may be true even of characteristics we think of as intrinsic.

Subject-oriented programming advocates the organization of the classes that describe objects into "subjects", which may be composed to form larger subjects. At points of access to fields or methods, several subjects' contributions may be composed. These points were characterized as the join-points of the subjects. For example, if a tree is cut down, the methods involved may need to join behavior in the bird and tax-assessor's subjects with that of the tree's own. It is therefore fundamentally a view of the compositional nature of software development, as opposed to the algorithmic (procedural) or representation-hiding (object) nature.

Relationships

Relationship to aspect-oriented programming

The introduction of aspect-oriented programming in 1997 raised questions about its relationship to subject-oriented programming, and about the difference between subjects and aspects. These questions were unanswered for some time, but were addressed in the patent on Aspect-oriented programming filed in 1999 in which two points emerge as characteristic differences from earlier art:

  • the aspect program comprises both a) a cross-cut that comprises a point in the execution where cross-cutting behavior is to be included; and b) a cross-cut action comprising a piece of implementation associated with the cross-cut, the piece of implementation comprising computer readable program code that implements the cross-cutting behavior.
  • the aspect transparently forces the cross-cutting behavior on object classes and other software entities

In the subject-oriented view, the cross-cut may be placed separately from the aspect (subject) and the behavior is not forced by the aspect, but governed by rules of composition. Hindsight makes it also possible to distinguish aspect-oriented programming by its introduction and exploitation of the concept of a query-like pointcut to externally impose the join-points used by aspects in general ways.

In the presentation of subject-oriented programming, the join-points were deliberately restricted to field access and method call on the grounds that those were the points at which well-designed frameworks were designed to admit functional extension. The use of externally imposed pointcuts is an important linguistic capability, but remains one of the most controversial features of aspect-oriented programming.

Relationship to aspect-oriented software development

By the turn of the millennium, it was clear that a number of research groups were pursuing different technologies that employed the composition or attachment of separately packaged state and function to form objects. To distinguish the common field of interest from Aspect-Oriented Programming with its particular patent definitions and to emphasize that the compositional technology deals with more than just the coding phase of software development, these technologies were organized together under the term Aspect-Oriented Software Development, and an organization and series on international conferences begun on the subject. Like aspect-oriented programming, subject-oriented programming, composition filters, feature-oriented programming and adaptive methods are considered to be aspect-oriented software development approaches.

Dimensions

Multi-dimensional separation of concerns, Hyper/J, and the Concern Manipulation Environment

The original formulation of subject-oriented programming deliberately envisioned it as a packaging technology – allowing the space of functions and data types to be extended in either dimension. The first implementations had been for C++, and Smalltalk. These implementations exploited the concepts of software labels and composition rules to describe the joining of subjects.

To address the concern that a better foundation should be provided for the analysis and composition of software not just in terms of its packaging but in terms of the various concerns these packages addressed, an explicit organization of the material was developed in terms of a multi-dimensional "matrix" in which concerns are related to the software units that implement them. This organization is called multi-dimensional separation of concerns, and the paper describing it has been recognized as the most influential paper of the ICSE 1999 Conference.

This new concept was implemented for composing Java software, using the name Hyper/J for the tool.

Composition and the concept of subject can be applied to software artifacts that have no executable semantics, like requirement specifications or documentation. A research vehicle for Eclipse, called the Concern Manipulation Environment (CME), has been described in which tools for query, analysis, modelling, and composition are applied to artifacts in any language or representation, through the use of appropriate plug-in adapters to manipulate the representation.

A successor to the Hyper/J composition engine was developed as part of CME which uses a general approach for the several elements of a composition engine:

  • a query language with unification to identify join points,
  • a flexible structural-attachment model,
  • a nested-graph specification for ordering identified elements,
  • and a priority ordering specification to resolve conflicts among conflicting rules.

Both Hyper/J and CME are available, from alphaWorks or sourceforge, respectively, but neither is actively supported.

Subject-oriented programming as a "third dimension"

Method dispatch in object oriented programming can be thought of as "two dimensional" in the sense that the code executed depends on both the method name and the object in question. This can be contrasted with procedural programming, where a procedure name resolves directly, or one dimensionally, onto a subroutine, and also to subject oriented programming, where the sender or subject is also relevant to dispatch, constituting a third dimension.

Volcanic gas

From Wikipedia, the free encyclopedia
Volcanic gases entering the atmosphere with tephra during eruption of Augustine Volcano, Alaska, 2006

Volcanic gases are gases given off by active (or, at times, by dormant) volcanoes. These include gases trapped in cavities (vesicles) in volcanic rocks, dissolved or dissociated gases in magma and lava, or gases emanating from lava, from volcanic craters or vents. Volcanic gases can also be emitted through groundwater heated by volcanic action.

The sources of volcanic gases on Earth include:

Substances that may become gaseous or give off gases when heated are termed volatile substances.

Composition

Sketch showing typical carbon dioxide emission patterns from volcanic and magmatic systems
Average carbon dioxide (CO2) emissions of subaerial volcanoes globally from the time period of 2005 to 2017
Degassing at the summit crater of Villarrica, Chile

The principal components of volcanic gases are water vapor (H2O), carbon dioxide (CO2), sulfur either as sulfur dioxide (SO2) (high-temperature volcanic gases) or hydrogen sulfide (H2S) (low-temperature volcanic gases), nitrogen, argon, helium, neon, methane, carbon monoxide and hydrogen. Other compounds detected in volcanic gases are oxygen (meteoric), hydrogen chloride, hydrogen fluoride, hydrogen bromide, sulfur hexafluoride, carbonyl sulfide, and organic compounds. Exotic trace compounds include mercury, halocarbons (including CFCs), and halogen oxide radicals.

The abundance of gases varies considerably from volcano to volcano, with volcanic activity and with tectonic setting. Water vapour is consistently the most abundant volcanic gas, normally comprising more than 60% of total emissions. Carbon dioxide typically accounts for 10 to 40% of emissions.

Volcanoes located at convergent plate boundaries emit more water vapor and chlorine than volcanoes at hot spots or divergent plate boundaries. This is caused by the addition of seawater into magmas formed at subduction zones. Convergent plate boundary volcanoes also have higher H2O/H2, H2O/CO2, CO2/He and N2/He ratios than hot spot or divergent plate boundary volcanoes.

Magmatic gases and high-temperature volcanic gases

Magma contains dissolved volatile components, as described above. The solubilities of the different volatile constituents are dependent on pressure, temperature and the composition of the magma. As magma ascends towards the surface, the ambient pressure decreases, which decreases the solubility of the dissolved volatiles. Once the solubility decreases below the volatile concentration, the volatiles will tend to come out of solution within the magma (exsolve) and form a separate gas phase (the magma is super-saturated in volatiles).

The gas will initially be distributed throughout the magma as small bubbles, that cannot rise quickly through the magma. As the magma ascends the bubbles grow through a combination of expansion through decompression and growth as the solubility of volatiles in the magma decreases further causing more gas to exsolve. Depending on the viscosity of the magma, the bubbles may start to rise through the magma and coalesce, or they remain relatively fixed in place until they begin to connect and form a continuously connected network. In the former case, the bubbles may rise through the magma and accumulate at a vertical surface, e.g. the 'roof' of a magma chamber. In volcanoes with an open path to the surface, e.g. Stromboli in Italy, the bubbles may reach the surface and as they pop small explosions occur. In the latter case, the gas can flow rapidly through the continuous permeable network towards the surface. This mechanism has been used to explain activity at Santiaguito, Santa Maria volcano, Guatemala and Soufrière Hills Volcano, Montserrat. If the gas cannot escape fast enough from the magma, it will fragment the magma into small particles of ash. The fluidised ash has a much lower resistance to motion than the viscous magma, so accelerates, causing further expansion of the gases and acceleration of the mixture. This sequence of events drives explosive volcanism. Whether gas can escape gently (passive eruptions) or not (explosive eruptions) is determined by the total volatile contents of the initial magma and the viscosity of the magma, which is controlled by its composition.

The term 'closed system' degassing refers to the case where gas and its parent magma ascend together and in equilibrium with each other. The composition of the emitted gas is in equilibrium with the composition of the magma at the pressure, temperature where the gas leaves the system. In 'open system' degassing, the gas leaves its parent magma and rises up through the overlying magma without remaining in equilibrium with that magma. The gas released at the surface has a composition that is a mass-flow average of the magma exsolved at various depths and is not representative of the magma conditions at any one depth.

Molten rock (either magma or lava) near the atmosphere releases high-temperature volcanic gas (>400 °C). In explosive volcanic eruptions, the sudden release of gases from magma may cause rapid movements of the molten rock. When the magma encounters water, seawater, lake water or groundwater, it can be rapidly fragmented. The rapid expansion of gases is the driving mechanism of most explosive volcanic eruptions. However, a significant portion of volcanic gas release occurs during quasi-continuous quiescent phases of active volcanism.

Low-temperature volcanic gases and hydrothermal systems

As magmatic gas travelling upward encounters meteoric water in an aquifer, steam is produced. Latent magmatic heat can also cause meteoric waters to ascend as a vapour phase. Extended fluid-rock interaction of this hot mixture can leach constituents out of the cooling magmatic rock and also the country rock, causing volume changes and phase transitions, reactions and thus an increase in ionic strength of the upward percolating fluid. This process also decreases the fluid's pH. Cooling can cause phase separation and mineral deposition, accompanied by a shift toward more reducing conditions. At the surface expression of such hydrothermal systems, low-temperature volcanic gases (<400 °C) are either emanating as steam-gas mixtures or in dissolved form in hot springs. At the ocean floor, such hot supersaturated hydrothermal fluids form gigantic chimney structures called black smokers, at the point of emission into the cold seawater.

Over geological time, this process of hydrothermal leaching, alteration, and/or redeposition of minerals in the country rock is an effective process of concentration that generates certain types of economically valuable ore deposits.

Non-explosive volcanic gas release

The gas release can occur by advection through fractures, or via diffuse degassing through large areas of permeable ground as diffuse degassing structures (DDS). At sites of advective gas loss, precipitation of sulfur and rare minerals forms sulfur deposits and small sulfur chimneys, called fumaroles. Very low-temperature (below 100 °C) fumarolic structures are also known as solfataras. Sites of cold degassing of predominantly carbon dioxide are called mofettes. Hot springs on volcanoes often show a measurable amount of magmatic gas in dissolved form.

Current emissions of volcanic gases to the atmosphere

Present day global emissions of volcanic gases to the atmosphere can be classified as eruptive or non-eruptive. Although all volcanic gas species are emitted to the atmosphere, the emissions of CO2 (a greenhouse gas) and SO2 have received the most study.

It has long been recognized that eruptions contribute much lower total SO2 emissions than passive degassing does. Fischer et al (2019) estimated that, from 2005 to 2015, SO2 emissions during eruptions were 2.6 teragrams (Tg or 1012g or 0.907 gigatons Gt) per year and during non-eruptive periods of passive degassing were 23.2 ± 2Tg per year. During the same time interval, CO2 emissions from volcanoes during eruptions were estimated to be 1.8 ± 0.9 Tg per year and during non-eruptive activity were 51.3 ± 5.7 Tg per year. Therefore, CO2 emissions during volcanic eruptions are less than 10% of CO2 emissions released during non-eruptive volcanic activity.

The 15 June 1991 eruption of Mount Pinatubo (VEI 6) in the Philippines released a total of 18 ± 4 Tg of SO2. Such large VEI 6 eruptions are rare and only occur once every 50 – 100 years. The 2010 eruptions of Eyjafjallajökull (VEI 4) in Iceland emitted a total of 5.1 Tg CO2. VEI 4 eruptions occur about once per year.

For comparison, Le Quéré, C. et al estimates that human burning of fossil fuels and production of cement processed 9.3 Gt carbon per year from 2006 through 2015, creating up to 34.1 Gt CO2 annually.

Some recent volcanic CO2 emission estimates are higher than Fischer et al (2019). The estimates of Burton et al. (2013) of 540 Tg CO2/year and of Werner et al. (2019) of 220 - 300 Tg CO2/year take into account diffuse CO2 emissions from volcanic regions.

Sensing, collection and measurement

Volcanic gases were collected and analysed as long ago as 1790 by Scipione Breislak in Italy. The composition of volcanic gases is dependent on the movement of magma within the volcano. Therefore, sudden changes in gas composition often presage a change in volcanic activity. Accordingly, a large part of hazard monitoring of volcanoes involves regular measurement of gaseous emissions. For example, an increase in the CO2 content of gases at Stromboli has been ascribed to injection of fresh volatile-rich magma at depth within the system. 

Volcanic gases can be sensed (measured in-situ) or sampled for further analysis. Volcanic gas sensing can be:

Sulphur dioxide (SO2) absorbs strongly in the ultraviolet wavelengths and has low background concentrations in the atmosphere. These characteristics make sulphur dioxide a good target for volcanic gas monitoring. It can be detected by satellite-based instruments, which allow for global monitoring, and by ground-based instruments such as DOAS. DOAS arrays are placed near some well-monitored volcanoes and used to estimate the flux of SO2 emitted. The Multi-Component Gas Analyzer System (Multi-GAS) is also used to remotely measure CO2, SO2 and H2S. The fluxes of other gases are usually estimated by measuring the ratios of different gases within the volcanic plume, e.g. by FTIR, electrochemical sensors at the volcano crater rim, or direct sampling, and multiplying the ratio of the gas of interest to SO2 by the SO2 flux.

Direct sampling of volcanic gas sampling is often done by a method involving an evacuated flask with caustic solution, first used by Robert W. Bunsen (1811-1899) and later refined by the German chemist Werner F. Giggenbach (1937-1997), dubbed Giggenbach-bottle. Other methods include collection in evacuated empty containers, in flow-through glass tubes, in gas wash bottles (cryogenic scrubbers), on impregnated filter packs and on solid adsorbent tubes.

Analytical techniques for gas samples comprise gas chromatography with thermal conductivity detection (TCD), flame ionization detection (FID) and mass spectrometry (GC-MS) for gases, and various wet chemical techniques for dissolved species (e.g., acidimetric titration for dissolved CO2, and ion chromatography for sulfate, chloride, fluoride). The trace metal, trace organic and isotopic composition is usually determined by different mass spectrometric methods.

Volcanic gases and volcano monitoring

Certain constituents of volcanic gases may show very early signs of changing conditions at depth, making them a powerful tool to predict imminent unrest. Used in conjunction with monitoring data on seismicity and deformation, correlative monitoring gains great efficiency. Volcanic gas monitoring is a standard tool of any volcano observatory. Unfortunately, the most precise compositional data still require dangerous field sampling campaigns. However, remote sensing techniques have advanced tremendously through the 1990s. The Deep Earth Carbon Degassing Project is employing Multi-GAS remote sensing to monitor 9 volcanoes on a continuous basis.

Hazards

Volcanic gases were directly responsible for approximately 3% of all volcano-related deaths of humans between 1900 and 1986. Some volcanic gases kill by acidic corrosion; others kill by asphyxiation. Some volcanic gases including sulfur dioxide, hydrogen chloride, hydrogen sulfide and hydrogen fluoride react with other atmospheric particles to form aerosols.

Inequality (mathematics)

From Wikipedia, the free encyclopedia https://en.wikipedia.org/wiki/Inequality...