Smoking Gun Evidence of an Ancient Earth: GPS Data Confirms Radiometric Dating
September 10, 2014 by
Original link: http://thenaturalhistorian.com/2014/09/10/smoking-gun-evidence-of-an-ancient-earth-gps-data-confirms-radiometric-dating/
My last post, on the tectonic origins of the Dead Sea and Jordan Valley, brought me face-to-face once again with one of the most striking pieces of evidence for an ancient earth that I am aware of. Take a look at this graph.
This graph shows the smoking gun.
Smoking gun evidence of what? That the earth’s plates have been moving slowly for millions of years.
Therefore the Earth is very, very old.
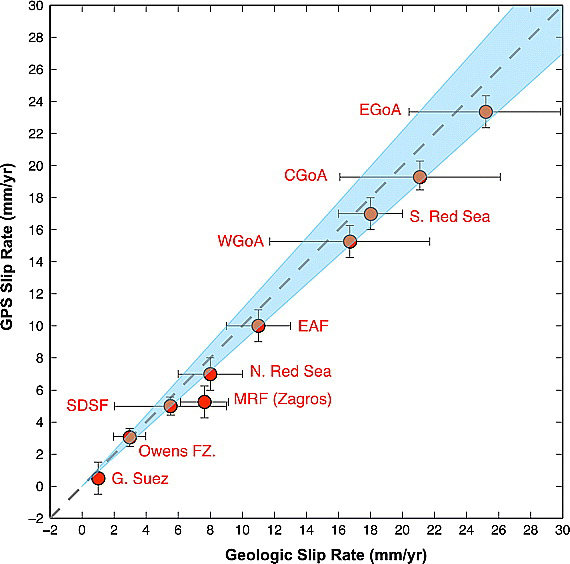
Radiometric/Geological estimates vs Geodetic/GPS estimates of continental plate motions. Figure from AlReheji et al. 2010.
This graph should cause creationists to lose sleep at night, wondering why God provided such contrary data to a young earth. Some will grasp for an escape chute and claim that these data are the result of God’s creating with the appearance of age while others will cast doubts on the data themselves but at the end of the day, both of these claims are without theological or scientific merit.
This graph shows that the so-called historical sciences and observational sciences that Ken Ham touts can both reach the same conclusions.
The graph includes data that are far from novel. The data don’t reveal anything that hasn’t been common knowledge among geologists for a long time. But this graph won’t make an appearance in your recent issue of Creation Magazine or be highlighted on the Answers in Genesis website.
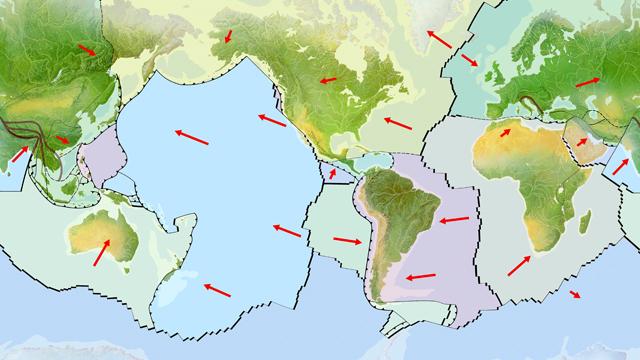
Basic
diagram of the crustal plates of the Earth and their general direction
of motion. Plates are moving at different speeds with some moving away
from each other and other running into each other. How the plates
interact explains much about the origins of earthquakes and volcanoes.
So what is this a graph of?
It compares two different estimates of how quickly the earth’s plates are moving in the Middle East. The first method of measurement (X axis) employs radiometric dating of rocks (that are millions of years old) to calculate the average rate of plate motion over that time. The second method measures the rate of plate motion based on GPS readings of the precise locations of the plates (Y axis). These GPS measurements were recorded over a 10 year period. This allowed the rates of plate motions to be directly measured as well as an average estimated over that time period.
Plates that move a few millimeters in a few years? Yes, initially this may seem a rather dull finding. But these data are remarkable for one reason: In almost all cases the estimates derived from these independent methods are in full agreement!
Why is this agreement significant and how does it prove that the world is ancient?
It is significant because it shows how predictions in science can provide powerful confirmation of a theory, when those predictions are confirmed by future observations. The geological slip rates were determined by several methods, involving multiple research teams over the past 50 years. I could spend 5000 words describing exactly how these rates were calculated, but it makes no difference how this was done or that your understand the methods. All that matters is that estimates of rates have been produced by multiple labs over decades. These rates were calculated using conventional – old earth – assumptions about radiometric dating. This includes producing dates for for 1 to 20 million years were obtained and used to back-calculate rates in millimeters per year movement. These studies produced rates of plate motion that represent the speed of plates over millions of years in the past but were predicted to represent the present day motion of the plates.
When these millions of years rates were calculated, there were no instruments precise enough to measure the present-day motion of the plates. But now we have lasers and global positioning satellites that can track precise movements of the earth’s crust down to hundredths of millimeters per day. This allowed geologists to directly test the rates predicted by radiometric dating of millions of year old rocks.
The key results: dates based on old rocks predict the same rates as GPS measurements of real-time plate motions. What does this mean?
It means that current plate motions are the same, or nearly the same, as plate motions from 100, 10,000 or 1 million years ago. The probability that these rate numbers, based on two independent methods of estimation, happen to be the same as a result of chance alone is so small that it makes winning the PowerBall look like a sure bet. This is as confident as one can be that tectonic plates have been slowly moving for vast periods of time. This is smoking gun evidence that these processes have been occurring continually for millions of years.
How does this fit a young earth model of the earth?
It doesn’t. The evidence against the young-earth model, based on this data alone, is very compelling. Please think about this for a minute and let the significance set in. Young earth creationists (YECs) have long railed against the validity of radiometric dating. They have argued that the method is unreliable and can’t give accurate dates and always overestimate because of erroneous assumptions.
But in this case, YECs can make up any excuse they want for why they don’t believe those dating methods and why the estimates of rates based on them are flawed. It doesn’t matter. In fact, the more problems they say they find with radiometric dating methods, the worse their problem becomes. This is because if the dating methods and rate estimates are bogus, then there should be no correlation with rate estimates based on real-time GPS measurements.
What young earth model would predict that rates based on “bogus” million-year old dates should yield the same rates measured by technology that we have in our cell phones? None. In fact most young earth models include some sort of accelerated plate motions in the past, with plate motions only slowing to their current rates in the past several thousand years.
So, according to current YEC hypotheses, estimates of past plate-movement rates should not equal rates measured in the present. These data falsify the accelerated plate tectonics model of flood geology.
Radiometric/Geological
estimates vs Geodetic/GPS estimates of continental plate motions.
Labels indicate names of places where rates have been estimated using
both methods. Figure from AlRaheji et al. 2010.
Back to the graph, I want to highlight just one of the data points on this graph as an example. I have been writing about the Dead Sea and the origin of the Jordan Valley (The Origins of the Dead Sea Part III: The Levant – a Land Literally Ripped Apart). I mentioned there that the Dead Sea is formed by a rift fault between two plates and that the plates are sliding past each other at a bit over 4 mm/year.
On the graph, this is the SDSF (South Dead Sea Fault) point. The vertical bar represents the variance possible (sort of a confidence interval) of the estimates based on geological estimates (radiometric mostly). These standard deviation bars are wider than the vertical bars, which represent the possible range of error for the GPS estimates, because the latter is so much more precise. Nonetheless, what you can see is that the GPS and geological estimates overlap for all the sites included in this study, including the Dead Sea fault. If the Dead Sea fault had moved hundreds or thousands of feet in a year even just a few thousand years ago, as YECs might expect, then the estimate based on GPS should not be close to the estimate based on movements averaged over long periods of time. But they do match and so we know beyond reasonable doubt that the Arabian plate on the east side of the Dead Sea valley has been slowly moving north for millions of years.
Lets widen our view a bit. Below (fig 2) is another example of the same type of data but this is for plate motions of plates from all over the earth.
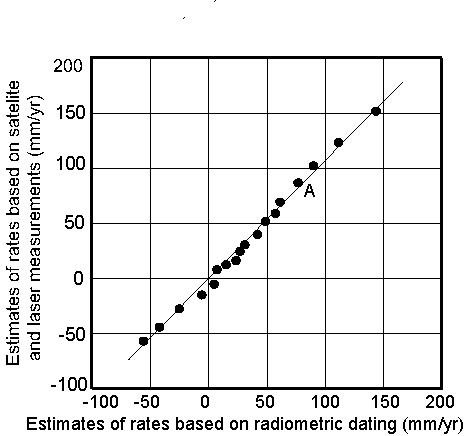
Figure
2. Rates of plate motions based on GPS and laser methods vs
radiometric dating methods for all of the plates of the world. Figure
modified from Robbins et al. 1993.
Plates predicted to have fast motions away from each other in the past have the same rate of motion today. Plates running into each other at a particular speed, measured in negative values, are moving toward each other at the same rates today.
I risk being redundant, but this point is important to emphasize. These values should NOT be the same if the worlds tectonic plates are only 4500 years old as predicted by flood geology.
Why would radiometric dating, which supposedly is a useless tool for estimating the true age of the earth by YEC reckoning, provide near-precise estimates of current plate motions, which are confirmed by a completely unrelated form of measurement?
For the YEC hypothesis, they shouldn’t. And yet they do.
The only reasonable explanation for what we see here is that the radiometric dating methods provide faithful estimates of the real ages of the rocks. The GPS data are yet another independent confirmation of the validity of radiometric dating. The fact that radiometric based dates predicted rates that were confirmed later by another method serve to confirm the former method.
This is no conspiracy. Forty years ago, scientists could not have faked the radiometric dating to derive estimates of plate motions that they knew we would find in the future. How could anyone have known that one plate should move 120 mm/year and another one only 2 mm/year? They simply calculated ages, did simple division, and derived a rate. Because no one could have known the modern rate of plate motion, there was no way for any scientists to fudge numbers and bend dates to particular assumptions about rates, as YECs have long claimed. The plate-movement rates are unbiased, and I think we can be reasonably sure that satellite measurements are unbiased recordings of the rates as well. The fact that any of the dates, much less the majority of them, match one another is very strong confirmation of the constant motion of the plates over long periods of time.
Technology found in our cell phones has pounded a rather strong nail—among the thousands already there—in the young earth creationist’s coffin.
An Addendum:
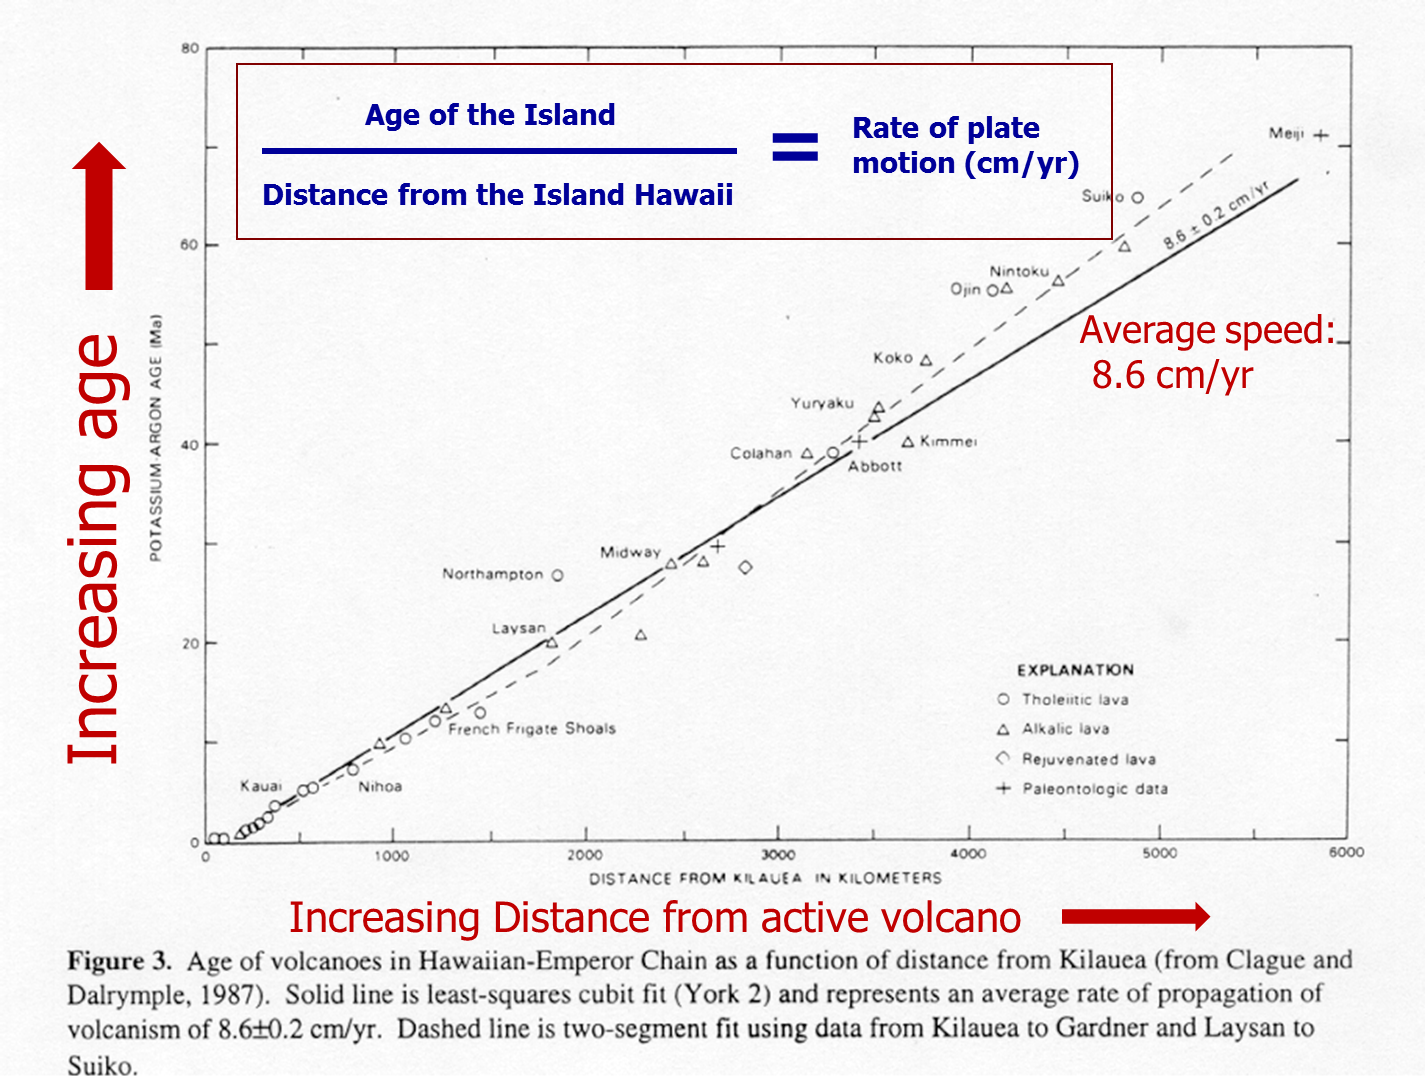
Let me provide another example to further show this is not just some cherry-picked data. Below (Fig. 3) is one additional example that I have used in one of my lectures. It shows the relationship between the distance of an Hawaiian Island or seamount from the active volcano. By dividing the age of the island as determined by radiometric dating by the distance you can estimate the speed at which the pacific plate is moving toward the northwest. This was done more than 40 years ago. In the past decade we have been able to measure the current rate of motion via GPS technology and it is very close to 8.6 cm/year. This is an incredible coincidence if radiometric dating methods are unreliable or if there has been accelerated decay of nucleotides as some YECs have claimed. Rather than a coincidence these similar estimates are a powerful testimony to the accuracy plate tectonic models and of the accuracy of radiometric dating techniques.
References:
Figure 1: ArRajehi, A., McClusky, S., Reilinger, R., Daoud, M., Alchalbi, A., Ergintav, S., … & Kogan, L. (2010). Geodetic constraints on present‐day motion of the Arabian Plate: Implications for Red Sea and Gulf of Aden rifting. Tectonics,29(3).
Figure 2: Two sets of plate motion rates compared. The vertical (left) axis shows rates averaged over a few to a dozen years of increasing (positive) or decreasing (negative) distance (some continents are being pushed toward each other and thus the negative rate) on 149 lines between 20 space geodetic sites (very long baseline inferometry or satellite laser ranging). The bottom axis shows rates predicted from a global plate motion model called NUVEL-1 which averages motion over about 3 million year time periods. These modeled time estimates were determined using the ages of geomagnetic reversals from the timescale of Harland et al. 1982 A geological time scale. Cambridge University Press. Estimates of plate motion in the past are also determined by radiometric dating of island chains such as Hawaii seen in Figure 9. The line represents where data points should be if estimates of past and present motions were identical. Large deviations from that line would signify very different rates in the past and the present. Figure modified from: Robbins, J. W., D. E. Smith, and C. Ma, Horizontal crustal deformation and large scale plate motions inferred from space geodetic techniques, in Contributions of Space Geodesy to Geodynamics: Crustal Dynamics, edited by D. Smith and D. Turcotte, pp. 21-36, AGU, Washington D.C., 1993.
Figure 3: Clague, D. A. and G. B. Dalrymple. 1987. The Hawaiian-Emperor volcanic chain Part I: Geologic evolution. U.S. Geological Survey Professional Paper 1350:5-54.


