Search This Blog

Sunday, May 27, 2018

Seafloor spreading

From Wikipedia, the free encyclopedia

Age of oceanic lithosphere; youngest (red) is along spreading centers.

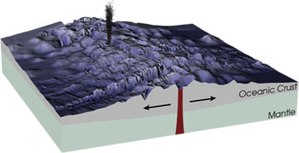
Seafloor spreading is a process that occurs at mid-ocean ridges, where new oceanic crust is formed through volcanic activity and then gradually moves away from the ridge.

History of study

Earlier theories (e.g. by Alfred Wegener and Alexander du Toit) of continental drift postulated that continents "ploughed" through the sea. The idea that the seafloor itself moves (and also carries the continents with it) as it expands from a central axis was proposed by Harry Hess from Princeton University in the 1960s.[1] The theory is well accepted now, and the phenomenon is known to be caused by convection currents in the asthenosphere, which is ductile, or plastic, and the brittle lithosphere (crust and upper mantle).[2]

Significance

Seafloor spreading helps explain continental drift in the theory of plate tectonics. When oceanic plates diverge, tensional stress causes fractures to occur in the lithosphere. The motivating force for seafloor spreading ridges is tectonic plate pull rather than magma pressure, although there is typically significant magma activity at spreading ridges.[3] At a spreading center basaltic magma rises up the fractures and cools on the ocean floor to form new seabed. Hydrothermal vents are common at spreading centers. Older rocks will be found farther away from the spreading zone while younger rocks will be found nearer to the spreading zone. Additionally spreading rates determine if the ridge is a fast, intermediate, or slow. As a general rule, fast ridges have spreading (opening) rates of more than 9 cm/year. Intermediate ridges have a spreading rate of 5–9 cm/year while slow spreading ridges have a rate less than 5 cm/year.[4][5]:2

Spreading center

Seafloor spreading occurs at spreading centers, distributed along the crests of mid-ocean ridges. Spreading centers end in transform faults or in overlapping spreading center offsets. A spreading center includes a seismically active plate boundary zone a few kilometers to tens of kilometers wide, a crustal accretion zone within the boundary zone where the ocean crust is youngest, and an instantaneous plate boundary - a line within the crustal accretion zone demarcating the two separating plates.[6] Within the crustal accretion zone is a 1-2 km-wide neovolcanic zone where active volcanism occurs.[7][8]

Incipient spreading


Plates in the crust of the earth, according to the plate tectonics theory

In the general case, sea floor spreading starts as a rift in a continental land mass, similar to the Red Sea-East Africa Rift System today.[9] The process starts by heating at the base of the continental crust which causes it to become more plastic and less dense. Because less dense objects rise in relation to denser objects, the area being heated becomes a broad dome (see isostasy). As the crust bows upward, fractures occur that gradually grow into rifts. The typical rift system consists of three rift arms at approximately 120 degree angles. These areas are named triple junctions and can be found in several places across the world today. The separated margins of the continents evolve to form passive margins. Hess' theory was that new seafloor is formed when magma is forced upward toward the surface at a mid-ocean ridge.

If spreading continues past the incipient stage described above, two of the rift arms will open while the third arm stops opening and becomes a 'failed rift'. As the two active rifts continue to open, eventually the continental crust is attenuated as far as it will stretch. At this point basaltic oceanic crust begins to form between the separating continental fragments. When one of the rifts opens into the existing ocean, the rift system is flooded with seawater and becomes a new sea. The Red Sea is an example of a new arm of the sea. The East African rift was thought to be a "failed" arm that was opening somewhat more slowly than the other two arms, but in 2005 the Ethiopian Afar Geophysical Lithospheric Experiment[10] reported that in the Afar region, September 2005, a 60 km fissure opened as wide as eight meters.[11] During this period of initial flooding the new sea is sensitive to changes in climate and eustasy. As a result, the new sea will evaporate (partially or completely) several times before the elevation of the rift valley has been lowered to the point that the sea becomes stable. During this period of evaporation large evaporite deposits will be made in the rift valley. Later these deposits have the potential to become hydrocarbon seals and are of particular interest to petroleum geologists.

Sea floor spreading can stop during the process, but if it continues to the point that the continent is completely severed, then a new ocean basin is created. The Red Sea has not yet completely split Arabia from Africa, but a similar feature can be found on the other side of Africa that has broken completely free. South America once fit into the area of the Niger Delta. The Niger River has formed in the failed rift arm of the triple junction.

Continued spreading and subduction


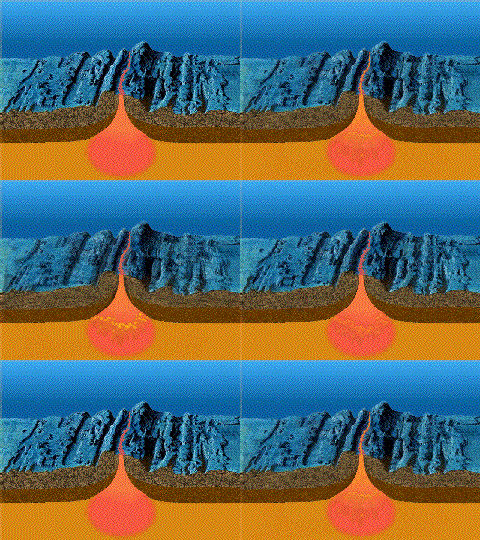
Spreading at a mid-ocean ridge

As new seafloor forms and spreads apart from the mid-ocean ridge it slowly cools over time. Older seafloor is therefore colder than new seafloor, and older oceanic basins deeper than new oceanic basins due to isostasy. If the diameter of the earth remains relatively constant despite the production of new crust, a mechanism must exist by which crust is also destroyed. The destruction of oceanic crust occurs at subduction zones where oceanic crust is forced under either continental crust or oceanic crust. Today, the Atlantic basin is actively spreading at the Mid-Atlantic Ridge. Only a small portion of the oceanic crust produced in the Atlantic is subducted. However, the plates making up the Pacific Ocean are experiencing subduction along many of their boundaries which causes the volcanic activity in what has been termed the Ring of Fire of the Pacific Ocean. The Pacific is also home to one of the world's most active spreading centers (the East Pacific Rise) with spreading rates of up to 13 cm/yr. The Mid-Atlantic Ridge is a "textbook" slow-spreading center, while the East Pacific Rise is used as an example of fast spreading. Spreading centers at slow and intermediate rates exhibit a rift valley while at fast rates an axial high is found within the crustal accretion zone.[4] The differences in spreading rates affect not only the geometries of the ridges but also the geochemistry of the basalts that are produced.[12]

Since the new oceanic basins are shallower than the old oceanic basins, the total capacity of the world's ocean basins decreases during times of active sea floor spreading. During the opening of the Atlantic Ocean, sea level was so high that a Western Interior Seaway formed across North America from the Gulf of Mexico to the Arctic Ocean.

Debate and search for mechanism

At the Mid-Atlantic Ridge (and in other areas), material from the upper mantle rises through the faults between oceanic plates to form new crust as the plates move away from each other, a phenomenon first observed as continental drift. When Alfred Wegener first presented a hypothesis of continental drift in 1912, he suggested that continents ploughed through the ocean crust. This was impossible: oceanic crust is both more dense and more rigid than continental crust. Accordingly, Wegener's theory wasn't taken very seriously, especially in the United States.

Since then, it has been shown that the motion of the continents is linked to seafloor spreading by the theory of plate tectonics. In the 1960s, the past record of geomagnetic reversals was noticed by observing the magnetic stripe "anomalies" on the ocean floor.[13] This results in broadly evident "stripes" from which the past magnetic field polarity can be inferred by looking at the data gathered from simply towing a magnetometer on the sea surface or from an aircraft. The stripes on one side of the mid-ocean ridge were the mirror image of those on the other side. The seafloor must have originated on the Earth's great fiery welts, like the Mid-Atlantic Ridge and the East Pacific Rise.

The driver for seafloor spreading in plates with active margins is the weight of the cool, dense, subducting slabs that pull them along. The magmatism at the ridge is considered to be "passive upswelling", which is caused by the plates being pulled apart under the weight of their own slabs.[14][15] This can be thought of as analogous to a rug on a table with little friction: when part of the rug is off of the table, its weight pulls the rest of the rug down with it.

Sea floor global topography: half-space model

The depth of the seafloor (or the height of a location on a mid-ocean ridge above a baselevel) is closely correlated with its age (age of the lithosphere where depth is measured). The age-depth relation can be modeled by the cooling of a lithosphere plate[16][17] or mantle half-space in areas without significant subduction.[18]

In the half-space model,[18] the seabed height is determined by the oceanic lithosphere temperature, due to thermal expansion. Oceanic lithosphere is continuously formed at a constant rate at the mid-ocean ridges. The source of the lithosphere has a half-plane shape (x = 0, z < 0) and a constant temperature T1. Due to its continuous creation, the lithosphere at x > 0 is moving away from the ridge at a constant velocity v, which is assumed large compared to other typical scales in the problem. The temperature at the upper boundary of the lithosphere (z=0) is a constant T0 = 0. Thus at x = 0 the temperature is the Heaviside step function T_{1}\cdot \Theta (-z). Finally, we assume the system is at a quasi-steady state, so that the temperature distribution is constant in time, i.e. T=T(x,z).

By calculating in the frame of reference of the moving lithosphere (velocity v), which have spatial coordinate x' = x-vt, we may write T = T(x',z,t) and use the heat equation:

{\frac  {\partial T}{\partial t}}=\kappa \nabla ^{2}T=\kappa {\frac  {\partial ^{2}T}{\partial ^{2}z}}+\kappa {\frac  {\partial ^{2}T}{\partial ^{2}x'}} where \kappa is the thermal diffusivity of the mantle lithosphere.

Since T depends on x' and t only through the combination x=x'+vt, we have: {\frac  {\partial T}{\partial x'}}={\frac  {1}{v}}\cdot {\frac  {\partial T}{\partial t}}

Thus: {\frac  {\partial T}{\partial t}}=\kappa \nabla ^{2}T=\kappa {\frac  {\partial ^{2}T}{\partial ^{2}z}}+{\frac  {\kappa }{v^{2}}}{\frac  {\partial ^{2}T}{\partial ^{2}t}}

We now use the assumption that v is large compared to other scales in the problem; we therefore neglect the last term in the equation, and get a 1-dimensional diffusion equation: {\frac  {\partial T}{\partial t}}=\kappa {\frac  {\partial ^{2}T}{\partial ^{2}z}} with the initial conditions T(t=0)=T_{1}\cdot \Theta (-z).

The solution for z\leq 0 is given by the error function \operatorname {erf} :
T(x',z,t) = T_1 \cdot \operatorname{erf} \left(\frac{z}{2\sqrt{\kappa t}}\right).
Due to the large velocity, the temperature dependence on the horizontal direction is negligible, and the height at time t (i.e. of sea floor of age t) can be calculated by integrating the thermal expansion over z:
 h(t) = h_0 + \alpha_\mathrm{eff} \int_0^{\infty} [T(z)-T_1]dz = h_0 - \frac{2}{\sqrt{\pi}}\alpha_\mathrm{eff}T_1\sqrt{\kappa t}
where \alpha_\mathrm{eff} is the effective volumetric thermal expansion coefficient, and h0 is the mid-ocean ridge height (compared to some reference).

Note that the assumption the v is relatively large is equivalently to the assumption that the thermal diffusivity \kappa is small compared to L^{2}/T, where L is the ocean width (from mid-ocean ridges to continental shelf) and T is its age.

The effective thermal expansion coefficient \alpha_\mathrm{eff} is different from the usual thermal expansion coefficient \alpha due to isostasic effect of the change in water column height above the lithosphere as it expands or retracts. Both coefficients are related by:
 \alpha_\mathrm{eff} = \alpha \cdot \frac{\rho}{\rho-\rho_w}
where \rho \sim 3.3g/cm^{3} is the rock density and \rho _{0}=1g/cm^{3} is the density of water.

By substituting the parameters by their rough estimates: \kappa \sim 8\cdot 10^{{-7}} m2/s, \alpha \sim 4\cdot 10^{{-5}} °C−1 and T1 ~1220 °C (for the Atlantic and Indian oceans) or ~1120 °C (for the eastern Pacific), we have:
h(t)\sim h_{0}-350{\sqrt  {t}}
for the eastern Pacific Ocean, and:
h(t)\sim h_{0}-390{\sqrt  {t}}
for the Atlantic and the Indian Ocean, where the height is in meters and time is in millions of years. To get the dependence on x, one must substitute t = x/v ~ Tx/L, where L is the distance between the ridge to the continental shelf (roughly half the ocean width), and T is the ocean age.

Mid-ocean ridge

From Wikipedia, the free encyclopedia

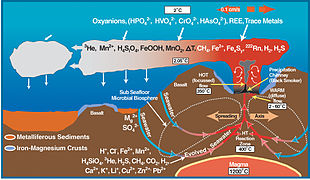
Mid-oceanic ridge, including a black smoker

A mid-ocean ridge (MOR) is an underwater mountain system formed by plate tectonics.[1] It consists of various mountains linked in chains, typically having a valley known as a rift running along its spine. This type of oceanic mountain ridge is characteristic of what is known as an 'oceanic spreading center', which is responsible for seafloor spreading.[2] The production of new seafloor results from mantle upwelling in response to plate spreading; this isentropic upwelling solid mantle material eventually exceeds the solidus and melts. The buoyant melt rises as magma at a linear weakness in the oceanic crust, and emerges as lava, creating new crust upon cooling. A mid-ocean ridge demarcates the boundary between two tectonic plates, and consequently is termed a divergent plate boundary.

Description


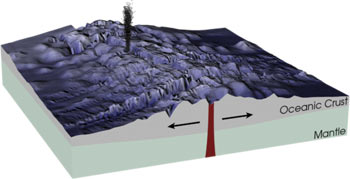
Graphic shows a mid-ocean ridge, with magma rising from a chamber below, forming new ocean plate that spreads away from the ridge.

Mid-ocean ridge in Þingvellir National Park, Iceland.

Volcanism

Mid-ocean ridges are geologically active, with continuing volcanism and seismicity. New magma steadily emerges onto the ocean floor and intrudes into the ocean crust at and near rifts along the ridge axes. The crystallized magma forms new crust of basalt (known as MORB for mid-ocean ridge basalt) and below it (in the lower oceanic crust), gabbro.[3] MORs are formed by two oceanic plates moving away from each other. Hydrothermal vents are a common feature at oceanic spreading centers.[4]

The rocks making up the crust below the seafloor are youngest along the axis of the ridge and age with increasing distance from that axis. New magma of basalt composition emerges at and near the axis because of decompression melting in the underlying Earth's mantle.[5]

The oceanic crust is made up of rocks much younger than the Earth itself. Most oceanic crust in the ocean basins is less than 200 million years old. The crust is in a constant state of "renewal" at the ocean ridges. Moving away from the mid-ocean ridge, ocean depth progressively increases; the greatest depths are in ocean trenches. As the oceanic crust moves away from the ridge axis, the peridotite in the underlying mantle cools and becomes more rigid. The crust and the relatively rigid peridotite below it make up the oceanic lithosphere.

Morphology

The bathymetry, or profile of a MOR is largely determined by the seafloor spreading rate at the ridge.[6] Slow spreading ridges (< 5 cm/yr) like the Mid-Atlantic Ridge (MAR) generally have large, wide rift valleys, sometimes as wide as 10–20 km (6.2–12.4 mi), and very rugged terrain at the ridge crest that can have relief of up to a 1,000 m (3,300 ft). By contrast, fast spreading ridges (>8 cm/yr) like the East Pacific Rise (EPR) are narrow, sharp incisions surrounded by generally flat topography that slopes away from the ridge over many hundreds of miles.[6] Ultra-slow spreading ridges (< 2 cm/yr), like the Southwest India and the Arctic Ridges form both magmatic and amagmatic ridge segments without transform faults.[7]

The spreading center or axis, commonly connects to a transform fault oriented at right angles to the axis. The flanks of Mid-coean ridges are in many places marked by the inactive scars of transform faults called fracture zones. At faster spreading rates the axes often display Overlapping Spreading Centers that lack connecting transform faults.[8]

The depth of the seafloor (or the height of a location on a mid-ocean ridge above a baselevel) is closely correlated with its age (age of the lithosphere where depth is measured). The age-depth relation can be modeled by the cooling of a lithosphere plate[9][10] or mantle half-space[11] in areas without significant subduction. The overall shape of ridges results from Pratt isostacy: close to the ridge axis there is hot, low-density mantle supporting the oceanic crust. As the oceanic plates cool, away from the ridge axes, the oceanic mantle lithosphere (the colder, denser part of the mantle that, together with the crust, comprises the oceanic plates) thickens and the density increases. Thus older seafloor is underlain by denser material and is deeper. The width of the ridge is hence a function of spreading rate – slow ridges like the MAR have spread much less far (shower a narrower profile) than faster ridges like the EPR (wider profile) for the same amount of cooling and consequent bathymetric deepening.

Formation processes


Oceanic crust is formed at an oceanic ridge, while the lithosphere is subducted back into the asthenosphere at trenches.

Two processes, ridge-push and slab pull, are thought to be responsible for the spreading seen at mid-ocean ridges, and there is some uncertainty as to which is dominant. Ridge-push occurs when the growing bulk of the ridge pushes the rest of the tectonic plate away from the ridge, often towards a subduction zone. At the subduction zone, "slab-pull" comes into effect. This is simply the weight of the tectonic plate being subducted (pulled) below the overlying plate dragging the rest of the plate along behind it. The slab pull mechanism is considered to be contributing more than the ridge push.[12]

The other process proposed to contribute to the formation of new oceanic crust at mid-ocean ridges is the "mantle conveyor" (see image). However, there have been some studies which have shown that the upper mantle (asthenosphere) is too plastic (flexible) to generate enough friction to pull the tectonic plate along. Moreover, unlike in the image above, mantle upwelling that causes magma to form beneath the ocean ridges appears to involve only its upper 400 km (250 mi), as deduced from seismic tomography and from studies of the seismic discontinuity at about 400 km (250 mi). The relatively shallow depths from which the upwelling mantle rises below ridges are more consistent with the "slab-pull" process. On the other hand, some of the world's largest tectonic plates such as the North American Plate are in motion, yet are nowhere being subducted.

The rate at which the mid-ocean ridge creates new material is known as the spreading rate, and is typically measured in mm/yr. As a general rule, fast ridges have spreading (opening) rates of more than 90 mm/year. Intermediate ridges have a spreading rate of 50–90 mm/year while slow spreading ridges have a rate less than 50 mm/year.[6][13]:2 The spreading rate of the North Atlantic Ocean is ~ 25 mm/yr, while in the Pacific region, it is 80–120 mm/yr. Ridges that spread at rates <20 are="" as="" class="reference" id="cite_ref-:2_13-1" mm="" nbsp="" referred="" ridges="" spreading="" sup="" to="" ultraslow="" yr="">[13]
:2 (e.g., the Gakkel Ridge in the Arctic Ocean and the Southwest Indian Ridge) and they provide a much different perspective on crustal formation than their faster spreading brethren.

The mid-ocean ridge systems form new oceanic crust. As crystallized basalt extruded at a ridge axis cools below Curie points of appropriate iron-titanium oxides, magnetic field directions parallel to the Earth's magnetic field are recorded in those oxides. The orientations of the field in the oceanic crust preserve a record of directions of the Earth's magnetic field with time. Because the field has reversed directions at irregular intervals throughout its history, the pattern of geomagnetic reversals in the ocean crust can be used as an indicator of age.[14] Likewise, the pattern of reversals together with age measurements of the crust is used to help establish the history of the Earth's magnetic field.

Global system


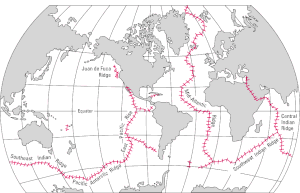
World distribution of mid-oceanic ridges; USGS

The mid-ocean ridges of the world are connected and form the Ocean Ridge, a single global mid-oceanic ridge system that is part of every ocean, making it the longest mountain range in the world. The continuous mountain range is 65,000 km (40,400 mi) long (several times longer than the Andes, the longest continental mountain range), and the total length of the oceanic ridge system is 80,000 km (49,700 mi) long.[15]

Increased rates of sea-floor spreading (i.e. the expansion of the mid-ocean ridge) has caused global (eustatic) sea-level to rise over very long timescales (millions of years).[16]

The high sea levels that occurred during the Cretaceous period (144–65 Ma) can only be attributed to plate tectonics since thermal expansion and the absence of ice sheets by themselves cannot account for the fact that sea levels were 100–170 meters higher than today.[17]

Increased sea-floor spreading means that the hot young crust at the mid-ocean ridge will form at a faster rate than it can be destroyed at subduction zones. The mid-ocean ridge will then expand and form a broader ridge, taking up more space in the ocean basin and causing sea levels to rise.[17]

Sea-level change can be attributed to other factors (thermal expansion, ice melting). Over very long timescales, however, it is the result of changes in the volume of the ocean basins which are, in turn, affected by rates of sea-floor spreading along the mid-ocean ridges.[18]

Seawater Chemistry


Mg/Ca Ratio Changes at Mid-Ocean Ridges

Mid-ocean ridges are global scale ion-exchange systems.[19]

Rapid spreading rates will expand the mid-ocean ridge causing basalt reactions with seawater to happen faster. The Magnesium/Calcium ratio will be lower because more magnesium ions are being removed from seawater and consumed by the rock, and more calcium ions are being removed from the rock and released to seawater. A lower Mg/Ca ratio favors the precipitation of Low-Mg calcite polymorphs of calcium carbonate (calcite seas).[19]

Slow spreading at mid-ocean ridges has the opposite effect and will result in a higher Mg/Ca ratio favoring the precipitation of aragonite and High-Mg calcite polymorphs of calcium carbonate (aragonite seas).[19]

Experiments show that most modern High-Mg calcite organisms would have been Low-Mg calcite in past calcite seas,[20] meaning that the Mg/Ca ratio in an organism's skeleton varies with the Mg/Ca ratio of the seawater in which it was grown.

The mineralogy of reef-building and sediment-producing organisms is thus regulated by chemical reactions occurring along the mid-ocean ridge, the rate of which is controlled by sea-floor spreading.[20]

History

Discovery

Mid-ocean ridges are generally submerged deep in the ocean. It was not until the 1950s, when the ocean floor was surveyed in detail, that their full extent became known.

The Vema, a ship of the Lamont-Doherty Earth Observatory of Columbia University, traversed the Atlantic Ocean, recording data about the ocean floor from the ocean surface. A team led by Marie Tharp and Bruce Heezen analyzed the data and concluded that there was an enormous mountain chain running up the middle. Scientists named it the "Mid-Atlantic Ridge".

At first, the ridge was thought to be a phenomenon specific to the Atlantic Ocean. However, as surveys of the ocean floor continued around the world, it was discovered that every ocean contains parts of the mid-ocean ridge system. Although the ridge system runs down the middle of the Atlantic Ocean, the ridge is located away from the center of other oceans.

Impact

Alfred Wegener proposed the theory of continental drift in 1912. He stated: "the Mid-Atlantic Ridge ... zone in which the floor of the Atlantic, as it keeps spreading, is continuously tearing open and making space for fresh, relatively fluid and hot sima [rising] from depth".[21] However, Wegener did not pursue this observation in his later works and his theory was dismissed by geologists because there was no mechanism to explain how continents could plow through ocean crust, and the theory became largely forgotten.

Following the discovery of the worldwide extent of the mid-ocean ridge in the 1950s, geologists faced a new task: explaining how such an enormous geological structure could have formed. In the 1960s, geologists discovered and began to propose mechanisms for seafloor spreading. The discovery of mid-ocean ridges and the process of seafloor spreading allowed for Wegner's theory to be expanded so that it included the movement of oceanic crust as well as the continents.[22] Plate tectonics was a suitable explanation for seafloor spreading, and the acceptance of plate tectonics by the majority of geologists resulted in a major paradigm shift in geological thinking.

It is estimated that 20 volcanic eruptions occur each year along earth's mid-ocean ridges and that every year 2.5 km2 (0.97 sq mi) of new seafloor is formed by this process. With a crustal thickness of 1 to 2 km (0.62 to 1.24 mi), this amounts to about 4 km3 (0.96 cu mi) of new ocean crust formed every year.[citation needed]

List of oceanic ridges

List of ancient oceanic ridges

Paleocene-Eocene Thermal Maximum Weirdness

gavin @ 10 August 200
Original post:  http://www.realclimate.org/index.php/archives/2009/08/petm-weirdness/

The Paleocene-Eocene Thermal Maximum (PETM) was a very weird period around 55 million years ago. However, the press coverage and discussion of a recent paper on the subject was weirder still.

For those of you not familiar with this period in Earth’s history, the PETM is a very singular event in the Cenozoic (last 65 million years). It was the largest and most abrupt perturbation to the carbon cycle over that whole period, defined by an absolutely huge negative isotope spike (> 3 permil in 13C). Although there are smaller analogs later in the Eocene, the size of the carbon flux that must have been brought into the ocean/atmosphere carbon cycle in that one event, is on a par with the entire reserve of conventional fossil fuels at present. A really big number – but exactly how big?

The story starts off innocently enough with a new paper by Richard Zeebe and colleagues in Nature Geoscience to tackle exactly this question. They use a carbon cycle model, tuned to conditions in the Paleocene, to constrain the amount of carbon that must have come into the system to cause both the sharp isotopic spike and a very clear change in the “carbonate compensation depth” (CCD) – this is the depth at which carbonates dissolve in sea water (a function of the pH, pressure, total carbon amount etc.). There is strong evidence that the the CCD rose hundreds of meters over the PETM – causing clear dissolution events in shallower ocean sediment cores. What Zeebe et al. come up with is that around 3000 Gt carbon must have been added to the system – a significant increase on the original estimates of about half that much made a decade or so ago, though less than some high end speculations.

Temperature changes at the same time as this huge carbon spike were large too. Note that this is happening on a Paleocene background climate that we don’t fully understand either – the polar amplification in very warm paleo-climates is much larger than we’ve been able to explain using standard models. Estimates range from 5 to 9 deg C warming (with some additional uncertainty due to potential problems with the proxy data) – smaller in the tropics than at higher latitudes.

Putting these two bits of evidence together is where it starts to get tricky.

First of all, how much does atmospheric CO2 rise if you add 3000 GtC to the system in a (geologically) short period of time? Zeebe et al. did this calculation and the answer is about 700 ppmv – quite a lot eh? However, that is a perturbation to the Paleocene carbon cycle – which they assume has a base CO2 level of 1000 ppm, and so you only get a 70% increase – i.e. not even a doubling of CO2. And since the forcing that goes along with an increase in CO2 is logarithmic, it is the percent change in CO2 that matters rather than the absolute increase. The radiative forcing associated with that is about 2.6 W/m2. Unfortunately, we don’t (yet) have very good estimates of background CO2 levels in Paleocene. The proxies we do have suggest significantly higher values than today, but they aren’t precise. Levels could have been less than 1000 ppm, or even significantly more.

If (and this is a key assumption that we’ll get to later) this was the only forcing associated with the PETM event, how much warmer would we expect the planet to get? One might be tempted to use the standard ‘Charney’ climate sensitivity (2-4.5ºC per doubling of CO2) that is discussed so much in the IPCC reports. That would give you a mere 1.5-3ºC warming which appears inadequate. However, this is inappropriate for at least two reasons. First, the Charney sensitivity is a quite carefully defined metric that is used to compare a certain class of atmospheric models. It assumes that there are no other changes in atmospheric composition (aerosols, methane, ozone) and no changes in vegetation, ice sheets or ocean circulation. It is not the warming we expect if we just increase CO2 and let everything else adjust.

In fact, the concept we should be looking at is the Earth System Sensitivity (a usage I am trying to get more widely adopted) as we mentioned last year in our discussion of ‘Target CO2‘. The point is that all of those factors left out of the Charney sensitivity are going to change, and we are interested in the response of the whole Earth System – not just an idealised little piece of it that happens to fit with what was included in GCMs in 1979.

Now for the Paleocene, it is unlikely that changes in ice sheets were very relevant (there weren’t any to speak of). But changes in vegetation, ozone, methane and aerosols (of various sorts) would certainly be expected. Estimates of the ESS taken from the Pliocene, or from the changes over the whole Cenozoic imply that the ESS is likely to be larger than the Charney sensitivity since vegetation, ozone and methane feedbacks are all amplifying. I’m on an upcoming paper that suggests a value about 50% bigger, while Jim Hansen has suggested a value about twice as big as Charney. That would give you an expected range of temperature increases of 2-5ºC (our estimate) or 3-6ºC (Hansen) (note that uncertainty bands are increasing here but the ranges are starting to overlap with the observations). ALl of this assumes that there are no huge non-linearities in climate sensitivity in radically different climates – something we aren’t at all sure about either.

But let’s go back to the first key assumption – that CO2 forcing is the only direct impact of the PETM event. The source of all this carbon has to satisfy two key constraints – it must be from a very depleted biogenic source and it needs to be relatively accessible. The leading candidate for this is methane hydrate – a kind of methane ice that is found in cold conditions and under pressure on continental margins – often capping large deposits of methane gas itself. Our information about such deposits in the Paleocene is sketchy to say the least, but there are plenty of ideas as to why a large outgassing of these deposits might have occurred (tectonic uplift in the proto-Indian ocean, volcanic activity in the North Atlantic, switches in deep ocean temperature due to the closure of key gateways into the Arctic etc.).

Putting aside the issue of the trigger though, we have the fascinating question of what happens to the methane that would be released in such a scenario. The standard assumption (used in the Zeebe et al paper) is that the methane would oxidise (to CO2) relatively quickly and so you don’t need to worry about the details. But work that Drew Shindell and I did a few years ago suggested that this might not quite be true. We found that atmospheric chemistry feedbacks in such a circumstance could increase the impact of methane releases by a factor of 4 or so. While this isn’t enough to sustain a high methane concentration for tens of thousands of years following an initial pulse, it might be enough to enhance the peak radiative forcing if the methane was being released continuously over a few thousand years. The increase in the case of a 3000 GtC pulse would be on the order of a couple of W/m2 – for as long as the methane was being released. That would be a significant boost to the CO2-only forcing given above – and enough (at least for relatively short parts of the PETM) to bring the temperature and forcing estimates into line.

Of course, much of this is speculative given the difficulty in working out what actually happened 55 million years ago. The press response to the Zeebe et al paper was, however, very predictable.

The problems probably started with the title of the paper “Carbon dioxide forcing alone insufficient to explain Palaeocene–Eocene Thermal Maximum warming” which on it’s own might have been unproblematic. However, it was paired with a press release from Rice University that was titled “Global warming: Our best guess is likely wrong”, containing the statement from Jerry Dickens that “There appears to be something fundamentally wrong with the way temperature and carbon are linked in climate models”.

Since the know-nothings agree one hundred per cent with these two last statements, it took no time at all for the press release to get passed along by Marc Morano, posted on Drudge, and declared the final nail in the coffin for ‘alarmist’ global warming science on WUWT (Andrew Freedman at WaPo has a good discussion of this). The fact that what was really being said was that climate sensitivity is probably larger than produced in standard climate models seemed to pass almost all of these people by (though a few of their more astute commenters did pick up on it). Regardless, the message went out that ‘climate models are wrong’ with the implicit sub-text that current global warming is nothing to worry about. Almost the exact opposite point that the authors wanted to make (another press release from U. Hawaii was much better in that respect).

What might have been done differently?

First off, headlines and titles that simply confirm someone’s prior belief (even if that belief is completely at odds with the substance of the paper) are a really bad idea. Many people do not go beyond the headline – they read it, they agree with it, they move on. Also one should avoid truisms. All ‘models’ are indeed wrong – they are models, not perfect representations of the real world. The real question is whether they are useful – what do they underestimate? overestimate? and are they sufficiently complete? Thus a much better title for the press release would have been more specific “”Global warming: Our best guess is likely too small” – and much less misinterpretable!

Secondly, a lot of the confusion is related to the use of the word ‘model’ itself. When people hear ‘climate model’, they generally think of the big ocean-atmosphere models run by GISS, NCAR or Hadley Centre etc. for the 20th Century climate and for future scenarios. The model used in Zeebe et al was not one of these, instead it was a relatively sophisticated carbon cycle model that tracks the different elements of the carbon cycle, but not the changes in climate. The conclusions of the study related to the sensitivity of the climate used the standard range of sensitivities from IPCC TAR (1.5 to 4.5ºC for a doubling of CO2), which have been constrained – not by climate models – but by observed climate changes. Thus nothing in the paper related to the commonly accepted ‘climate models’ at all, yet most of the commentary made the incorrect association.

To summarise, there is still a great deal of mystery about the PETM – the trigger, where the carbon came from and what happened to it – and the latest research hasn’t tied up all the many loose ends. Whether the solution lies in something ‘fundamental’ as Dickens surmises (possibly related to our basic inability to explain the latitudinal gradients in any of the very warm climates) , or whether it’s a combination of a different forcing function combined with more inclusive ideas about climate sensitivity, is yet to be determined. However, we can all agree that it remains a tantalisingly relevant episode of Earth history.

Deep sea mining

From Wikipedia, the free encyclopedia

Deep sea mining is a relatively new mineral retrieval process that takes place on the ocean floor. Ocean mining sites are usually around large areas of polymetallic nodules or active and extinct hydrothermal vents at 1,400 to 3,700 metres (4,600 to 12,100 ft) below the ocean’s surface.[1] The vents create globular or massive sulfide deposits, which contain valuable metals such as silver, gold, copper, manganese, cobalt, and zinc.[2][3] The deposits are mined using either hydraulic pumps or bucket systems that take ore to the surface to be processed. As with all mining operations, deep sea mining raises questions about its potential environmental impact. Environmental advocacy groups such as Greenpeace and the Deep sea Mining Campaign[4] have argued that seabed mining should not be permitted in most of the world's oceans because of the potential for damage to deepsea ecosystems and pollution by heavy metal laden plumes.[2]

Brief history

In the 1960s the prospect of deep-sea mining was brought up by the publication of J. L. Mero's Mineral Resources of the Sea.[3] The book claimed that nearly limitless supplies of cobalt, nickel and other metals could be found throughout the planet's oceans. Mero stated that these metals occurred in deposits of manganese nodules, which appear as lumps of compressed flowers on the seafloor at depths of about 5,000 m. Some nations including France, Germany and the United States sent out research vessels in search of nodule deposits. One such vessel was the Glomar Explorer. Initial estimates of deep sea mining viability turned out to be much exaggerated. This overestimate, coupled with depressed metal prices, led to the near abandonment of nodule mining by 1982. From the 1960s to 1984 an estimated US $650 million had been spent on the venture, with little to no return.[3]

Over the past decade a new phase of deep-sea mining has begun. Rising demand for precious metals in Japan, China, Korea and India has pushed these countries in search of new sources. Interest has recently shifted toward hydrothermal vents as the source of metals instead of scattered nodules. The trend of transition towards an electricity-based information and transportation infrastructure currently seen in western societies further pushes demands for precious metals. The current revived interest in phosphorus nodule mining at the seafloor stems from phosphor-based artificial fertilizers being of significant importance for world food production. Growing world population pushes the need for artificial fertilizers or greater incorporation of organic systems within agricultural infrastructure.

Currently, the best potential deep sea site, the Solwara 1 Project, has been found in the waters off Papua New Guinea, a high grade copper-gold resource and the world's first Seafloor Massive Sulphide (SMS) resource.[5] The Solwara 1 Project is located at 1600 metres water depth in the Bismarck Sea, New Ireland Province.[5] Using ROV (remotely operated underwater vehicles) technology developed by UK-based Soil Machine Dynamics, Nautilus Minerals Inc. is first company of its kind to announce plans to begin full-scale undersea excavation of mineral deposits.[6] However a dispute with the government of Papua-New Guinea delayed production and its now scheduled to commence commercial operations in early 2018.[5]

Laws and regulations

The international law–based regulations on deep sea mining are contained in the United Nations Conventions on the Law of the Sea from 1973 to 1982, which came into force in 1994.[2][3] The convention set up the International Seabed Authority (ISA), which regulates nations’ deep sea mining ventures outside each nations’ Exclusive Economic Zone (a 200-nautical-mile (370 km) area surrounding coastal nations). The ISA requires nations interested in mining to explore two equal mining sites and turn one over to the ISA, along with a transfer of mining technology over a 10- to 20-year period. This seemed reasonable at the time because it was widely believed that nodule mining would be extremely profitable. However, these strict requirements led some industrialized countries to refuse to sign the initial treaty in 1982.[3][7]

Within the EEZ of nation states seabed mining comes under the jurisdiction of national laws. Despite extensive exploration both within and outside of EEZs, only a few countries, notably New Zealand, have established legal and institutional frameworks for the future development of deep seabed mining.

Papua New Guinea was the first country to approve a permit for the exploration of minerals in the deep seabed. Solwara 1 was awarded its licence and environmental permits despite three independent reviews of the environmental impact statement mine finding significant gaps and flaws in the underlying science.

The ISA has recently arranged a workshop in Australia where scientific experts, industry representatives, legal specialists and academics worked towards improving existing regulations and ensuring that development of seabed minerals does not cause serious and permanent damage to the marine environment.

Resources mined

The deep sea contains many different resources available for extraction, including silver, gold, copper, manganese, cobalt, and zinc. These raw materials are found in various forms on the sea floor, usually in higher concentrations than terrestrial mines.

Minerals and related depths[1]

Type of mineral deposit Average Depth Resources found
Polymetallic nodules 4,000 – 6,000 m Nickel, copper, cobalt, and manganese
Manganese crusts 800 – 2,400 m Mainly cobalt, some vanadium, molybdenum and platinum
Sulfide deposits 1,400 – 3,700 m Copper, lead and zinc some gold and silver

Diamonds are also mined from the seabed by De Beers and others. Nautilus Minerals Inc and Neptune Minerals are planning to mine the offshore waters of Papua New Guinea and New Zealand.[8]

Extraction methods

Recent technological advancements have given rise to the use remotely operated vehicles (ROVs) to collect mineral samples from prospective mine sites. Using drills and other cutting tools, the ROVs obtain samples to be analyzed for precious materials. Once a site has been located, a mining ship or station is set up to mine the area.[6]

There are two predominant forms of mineral extraction being considered for full scale operations: continuous-line bucket system (CLB) and the hydraulic suction system. The CLB system is the preferred method of nodule collection. It operates much like a conveyor-belt, running from the sea floor to the surface of the ocean where a ship or mining platform extracts the desired minerals, and returns the tailings to the ocean.[7] Hydraulic suction mining lowers a pipe to the seafloor which transfers nodules up to the mining ship. Another pipe from the ship to the seafloor returns the tailings to the area of the mining site.[7]

In recent years, the most promising mining areas have been the Central and Eastern Manus Basin around Papua New Guinea and the crater of Conical Seamount to the east. These locations have shown promising amounts of gold in the area's sulfide deposits (an average of 26 parts per million). The relatively shallow water depth of 1050 m, along with the close proximity of a gold processing plant makes for an excellent mining site.[3]

Deep sea mining project value chain can be differentiated using the criteria of the type of activities where the value is actually added. During prospecting, exploration and resource assessment phases the value is added to intangible assets, for the extraction, processing and distribution phases the value increases with relation to product processing. There is an intermediate phase – the pilot mining test which could be considered to be an inevitable step in the shift from “resources” to “reserves” classification, where the actual value starts.[9]

Exploration phase involves such operations as locating, sea bottom scanning and sampling using technologies such as echo-sounders, side scan sonars, deep-towed photography, ROVs, AUVs. The resource valuation incorporates the examination of data in the context of potential mining feasibility.

Value chain based on product processing involves such operations as actual mining (or extraction), vertical transport, storing, offloading, transport, metallurgical processing for final products. Unlike the exploration phase, the value increases after each operation on processed material eventually delivered to the metal market. Logistics involves technologies analogous to those applied in land mines. This is also the case for the metallurgical processing, although rich and polymetallic mineral composition which distinguishes marine minerals from its land analogs requires special treatment of the deposit. Environmental monitoring and impact assessment analysis relate to the temporal and spatial discharges of the mining system if they occur, sediment plumes, disturbance to the benthic environment and the analysis of the regions affected by seafloor machines. The step involves an examination of disturbances near the seafloor, as well as disturbances near the surface. Observations include baseline comparisons for the sake of quantitative impact assessments for ensuring the sustainability of the mining process.[9]

Environmental impacts

Research shows that polymetallic nodule fields are hotspots of abundance and diversity for a highly vulnerable abyssal fauna.[10] Because deep sea mining is a relatively new field, the complete consequences of full scale mining operations on this ecosystem are unknown. However, some researchers have said they believe that removal of parts of the sea floor will result in disturbances to the benthic layer, increased toxicity of the water column and sediment plumes from tailings.[2][10] Removing parts of the sea floor could disturb the habitat of benthic organisms, with unknown long-term effects.[1] Aside from the direct impact of mining the area, some researchers and environmental activists have raised concerns about leakage, spills and corrosion that could alter the mining area’s chemical makeup.

Among the impacts of deep sea mining, sediment plumes could have the greatest impact. Plumes are caused when the tailings from mining (usually fine particles) are dumped back into the ocean, creating a cloud of particles floating in the water. Two types of plumes occur: near bottom plumes and surface plumes.[1] Near bottom plumes occur when the tailings are pumped back down to the mining site. The floating particles increase the turbidity, or cloudiness, of the water, clogging filter-feeding apparatuses used by benthic organisms.[11] Surface plumes cause a more serious problem. Depending on the size of the particles and water currents the plumes could spread over vast areas.[1][7] The plumes could impact zooplankton and light penetration, in turn affecting the food web of the area.[1][7]

An article in the Harvard Environmental Law Review in April 2018 argued that "the 'new global gold rush' of deep sea mining shares many features with past resource scrambles – including a general disregard for environmental and social impacts, and the marginalisation of indigenous peoples and their rights".[12][13]

Introduction to entropy

From Wikipedia, the free encyclopedia https://en.wikipedia.org/wiki/Introduct...