Marketing strategy is a process that can allow an organization to concentrate its limited resources on the greatest opportunities to increase sales and achieve a sustainable competitive advantage.
Strategic planning involves an analysis of the company's strategic initial situation prior to the formulation, evaluation and selection of market-oriented competitive position that contributes to the company's goals and marketing objectives.
Strategic marketing, as a distinct field of study emerged in the 1970s and 80s, and built on strategic management that preceded it. Marketing strategy highlights the role of marketing as a link between the organization and its customers.
Marketing strategy leverages the combination of resources and capabilities within an organization to achieve a competitive advantage and thus enhances firm performance (Cacciolatti & Lee, 2016).
Definitions of Marketing Strategy
- "The marketing strategy lays out target markets and the value proposition that will be offered based on an analysis of the best market opportunities." (Philip Kotler & Kevin Keller, Marketing Management, Pearson, 14th Edition)
- “An over-riding directional concept that sets out the planned path.” (David Aaker and Michael K. Mills, Strategic Market Management, 2001, p. 11)
- "Essentially a formula for how a business is going to compete, what its goals should be and what policies will be needed to carry out these goals." (Michael Porter, Competitive Strategy: Techniques for Analyzing Industries and Competitors , NY, Free Press, 1980)
- "The pattern of major objectives, purposes and goals and essential policies and plans for achieving those goals, stated in such a way as to define what business the company is in or is to be in. (S. Jain, Marketing Planning and Strategy, 1993)
- "An explicit guide to future Behaviour.” (Henry Mintzberg, “ Crafting Strategy,” Harvard Business Review, July–August, 1987 pp. 66–74)
- Strategy is "reserved for actions aimed directly at altering the strengths of the enterprise relative to that of its competitors... Perfect strategies are not called for. What counts is... performance relative to competitors.” (Kenichi Ohmae, The Mind of the Strategist, 1982, p. 37)
- Strategy formulation is built on "the match between organizational resources and skills and environmental opportunities and risks it faces and the purposes it wishes to accomplish." (Dan Schendel and Charles W. Hofer, Strategy Formulation: Analytical Concepts, South-Western, 1978, p. 11)
Marketing management versus marketing strategy
The distinction between “strategic” and “managerial” marketing is used to distinguish "two phases having different goals and based on different conceptual tools. Strategic marketing concerns the choice of policies aiming at improving the competitive position of the firm, taking account of challenges and opportunities proposed by the competitive environment. On the other hand, managerial marketing is focused on the implementation of specific targets." Marketing strategy is about "lofty visions translated into less lofty and practical goals [while marketing management] is where we start to get our hands dirty and make plans for things to happen." Marketing strategy is sometimes called higher order planning because it sets out the broad direction and provides guidance and structure for the marketing program.
Brief history of strategic marketing
Marketing scholars have suggested that strategic marketing arose in the late 1970s and its origins can be understood in terms of a distinct evolutionary path.
- Budgeting Control (also known as scientific management)
- Date: From late 19th century
- Key Thinkers: Frederick Winslow Taylor, Frank and Lillian Gilbreth, Henry L. Gantt, Harrington Emerson
- Key Ideas: Emphasis on quantification and scientific modelling, reduce work to smallest possible units and assign work to specialists, exercise control through rigid managerial hierarchies, standardize inputs to reduce variation, defects and control costs, use quantitative forecasting methods to predict any changes.
- Long Range Planning
- Date: From 1950s
- Key Thinkers: Herbert A. Simon
- Key Ideas: Managerial focus was to anticipate growth and manage operations in an increasingly complex business world.
- Strategic Planning (also known as corporate planning)
- Date: From the 1960s
- Key Thinkers: Michael Porter
- Key Ideas: Organizations must find the right fit within an industry structure; advantage derives from industry concentration and market power; firms should strive to achieve a monopoly or quasi-monopoly; successful firms should be able to erect barriers to entry.
- Strategic Marketing Management It refers to a business's overall game plan for reaching prospective consumers and turning them into customers of the products or services the business provides.
- Date: from late 1970s
- Key thinkers: R. Buzzell and B. Gale
- Key Ideas: Each business is unique and that there can be no formula for achieving competitive advantage; firms should adopt a flexible planning and review process that aims to cope with strategic surprises and rapidly developing threats; management's focus is on how to deliver superior customer value; highlights the key role of marketing as the link between customers and the organization.
- Resource Based View (RBV) (also known as resource-advantage theory)
- Date: From mid 1990s
- Key Thinkers: Jay B. Barney, George S. Day, Gary Hamel, Shelby D. Hunt, G. Hooley and C.K. Prahalad
- Key Ideas: The firm's resources are financial, legal, human, organizational, informational and relational; resources are heterogeneous and imperfectly mobile, management's key task is to understand and organize resources for sustainable competitive advantage.
Strategic marketing planning: An overview
Marketing strategy involves mapping out the company's direction for the forthcoming planning period, whether that be three, five or ten years. It involves undertaking a 360° review of the firm and its operating environment with a view to identifying new business opportunities that the firm could potentially leverage for competitive advantage. Strategic planning may also reveal market threats that the firm may need to consider for long-term sustainability. Strategic planning makes no assumptions about the firm continuing to offer the same products to the same customers into the future. Instead, it is concerned with identifying the business opportunities that are likely to be successful and evaluates the firm's capacity to leverage such opportunities. It seeks to identify the strategic gap; that is the difference between where a firm is currently situated (the strategic reality or inadvertent strategy) and where it should be situated for sustainable, long-term growth (the strategic intent or deliberate strategy).
Strategic planning seeks to address three deceptively simple questions, specifically:
- * Where are we now? (Situation analysis)
- * What business should we be in? (Vision and mission)
- * How should we get there? (Strategies, plans, goals, and objectives)
A fourth question may be added to the list, namely 'How do we know when we got there?' Due to the increasing need for accountability, many marketing organizations use a variety of marketing metrics to track strategic performance, allowing for corrective action to be taken as required. On the surface, strategic planning seeks to address three simple questions, however, the research and analysis involved in strategic planning is very sophisticated and requires a great deal of skill and judgement.
Strategic analysis: tools and techniques
Strategic analysis is designed to address the first strategic question, "Where are we now?" Traditional market research is less useful for strategic marketing because the analyst is not seeking insights about customer attitudes and preferences. Instead, strategic analysts are seeking insights about the firm's operating environment with a view to identifying possible future scenarios, opportunities, and threats.
Strategic planning focuses on the 3C's, namely: Customer, Corporation, and Competitors. A detailed analysis of each factor is key to the success of strategy formulation. The 'competitors' element refers to an analysis of the strengths of the business relative to close rivals, and consideration of competitive threats that might impinge on the business's ability to move in certain directions. The 'customer' element refers to an analysis of any possible changes in customer preferences that potentially give rise to new business opportunities. The 'corporation' element refers to a detailed analysis of the company's internal capabilities and its readiness to leverage market-based opportunities or its vulnerability to external threats.
Mintzberg suggests that the top planners spend most of their time engaged in analysis and are concerned with industry or competitive analyses as well as internal studies, including the use of computer models to analyze trends in the organization. Strategic planners use a variety of research tools and analytical techniques, depending on the environment complexity and the firm's goals. Fleitcher and Bensoussan, for instance, have identified some 200 qualitative and quantitative analytical techniques regularly used by strategic analysts while a recent publication suggests that 72 techniques are essential. No optimal technique can be identified as useful across all situations or problems. Determining which technique to use in any given situation rests with the skill of the analyst. The choice of tool depends on a variety of factors including: data availability; the nature of the marketing problem; the objective or purpose, the analyst's skill level as well as other constraints such as time or motivation.
The most commonly used tools and techniques include:
Research methods
- Environmental scanning
- Marketing intelligence (also known as competitive intelligence)
- Futures research
Analytical techniques
- Brand Development Index (BDI)/ Category development index (CDI)
- Brand/ Category penetration
- Benchmarking
- Blindspots analysis
- Functional capability and resource analysis
- Impact analysis
- Counterfactual analysis
- Demand analysis
- Emerging Issues Analysis
- Experience curve analysis
- Gap analysis
- Herfindahl index
- Industry Analysis (also known as Porter's five forces analysis)
- Management profiling
- Market segmentation analysis
- Market share analysis
- Perceptual mapping
- PEST analysis and its variants including PESTLE, STEEPLED and STEER (PEST is occasionally known as Six Segment Analysis)
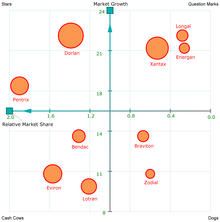
- Portfolio analysis, such as BCG growth-share matrix or GE business screen matrix
- Precursor Analysis or Evolutionary analysis
- Product life cycle analysis and S-curve analysis (also known as technology life cycle or hype cycle analysis)
- Product evolutionary cycle analysis
- Scenario analysis
- Segment Share Analysis
- Situation analysis
- Strategic Group Analysis
- SWOT analysis
- Trend Analysis
- Value chain analysis
Brief description of gap analysis
Gap analysis is a type of higher-order analysis that seeks to identify the difference between the organization's current strategy and its desired strategy. This difference is sometimes known as the strategic gap. Mintzberg identifies two types of strategy namely deliberate strategy and inadvertent strategy. The deliberate strategy represents the firm's strategic intent or its desired path while the inadvertent strategy represents the path that the firm may have followed as it adjusted to environmental, competitive and market changes. Other scholars use the terms realized strategy versus intended strategy to refer to the same concepts. This type of analysis indicates whether an organization has strayed from its desired path during the planning period. The presence of a large gap may indicate the organization has become stuck in the middle; a recipe for strategic mediocrity and potential failure.
Brief description of Category/Brand Development Index
The category/brand development index is a method used to assess the sales potential for a region or market and identify market segments that can be developed (i.e. high CDI and high BDI). In addition, it may be used to identify markets where the category or brand is underperforming and may signal underlying marketing problems such as poor distribution (i.e. high CDI and low BDI).
BDI and CDI are calculated as follows:
- BDI = (Brand Sales (%) in Market A/ Population (%) in Market A) X 100
- CDI = (Category Sales (%) in Market A/ Population (%) in Market A) X 100
Brief description of PEST analysis
Strategic planning typically begins with a scan of the business environment, both internal and external, this includes understanding strategic constraints. An understanding of the external operating environment, including political, economic, social and technological which includes demographic and cultural aspects, is necessary for the identification of business opportunities and threats. This analysis is called PEST; an acronym for Political, Economic, Social and Technological. A number of variants of the PEST analysis can be identified in literature, including: PESTLE analysis (Political, Economic, Social, Technological, Legal and Environmental); STEEPLE (adds ethics); STEEPLED (adds demographics) and STEER (adds regulatory).
The aim of the PEST analysis is to identify opportunities and threats in the wider operating environment. Firms try to leverage opportunities while trying to buffer themselves against potential threats. Basically, the PEST analysis guides strategic decision-making. The main elements of the PEST analysis are:
- Political: political interventions with the potential to disrupt or enhance trading conditions e.g. government statutes, policies, funding or subsidies, support for specific industries, trade agreements, tax rates, and fiscal policy.
- Economic: economic factors with the potential to affect profitability and the prices that can be charged, such as, economic trends, inflation, exchange rates, seasonality and economic cycles, consumer confidence, consumer purchasing power, and discretionary incomes.
- Social: social factors that affect demand for products and services, consumer attitudes, tastes and preferences like demographics, social influencers, role models, shopping habits.
- Technological: Innovation, technological developments or breakthroughs that create opportunities for new products, improved production processes or new ways of transacting business e.g. new materials, new ingredients, new machinery, new packaging solutions, new software, and new intermediaries.
When carrying out a PEST analysis, planners and analysts may consider the operating environment at three levels, namely the supranational; the national and subnational or local level. As businesses become more globalized, they may need to pay greater attention to the supranational level.
Brief description of SWOT analysis
In addition to the PEST analysis, firms carry out a Strengths, Weakness, Opportunities, and Threats (SWOT) analysis. A SWOT analysis identifies:
- Strengths: distinctive capabilities, competencies, skills or assets that provide a business or project with an advantage over potential rivals; internal factors that are favourable to achieving company objectives
- Weaknesses: internal deficiencies that place the business or project at a disadvantage relative to rivals; or deficiencies that prevent an entity from moving in a new direction or acting on opportunities. internal factors that are unfavorable to achieving company objectives
- Opportunities: elements in the environment that the business or project could exploit to its advantage; external factors of the organization including: new products, new markets, new demand, foreign market barriers, competitors' mistakes, etc.
- Threats: elements in the environment that could erode the firm's market position; external factors that prevent or hinder an entity from moving in a desired direction or achieving its goals.
Typically the firm will attempt to leverage those opportunities that can be matched with internal strengths; that is to say the firm has a capability in any area where strengths are matched with external opportunities. It may need to build capability if it wishes to leverage opportunities in areas of weakness. An area of weakness that is matched with an external threat represents a vulnerability, and the firm may need to develop contingency plans.
Developing the vision and mission
The vision and mission address the second central question, 'Where are we going?' At the conclusion of the research and analysis stage, the firm will typically review its vision statement, mission statement and, if necessary, devise a new vision and mission for the outlook period. At this stage, the firm will also devise a generic competitive strategy as the basis for maintaining a sustainable competitive advantage for the forthcoming planning period.
A vision statement is a realistic, long-term future scenario for the organization. (Vision statements should not be confused with slogans or mottos.) A vision statement is designed to present a realistic long-term future scenario for the organization. It is a "clearly articulated statement of the business scope." A strong vision statement typically includes the following:
- Competitive scope
- Market scope
- Geographic scope
- Vertical scope
Some scholars point out the market visioning is a skill or competency that encapsulates the planners' capacity "to link advanced technologies to market opportunities of the future, and to do so through a shared understanding of a given product market.
A mission statement is a clear and concise statement of the organization's reason for being and its scope of operations, while the generic strategy outlines how the company intends to achieve both its vision and mission.
Mission statements should include detailed information and must be more than a simple motherhood statement. A mission statement typically includes the following:
- Specification of target customers
- Identification of principal products or services offered
- Specification of the geographic scope of operations
- Identification of core technologies and/or core capabilities
- An outline of the firm's commitment to long-term survival, growth and profitability
- An outline of the key elements in the company's philosophy and core values
- Identification of the company's desired public image
Developing the generic competitive strategy
The generic competitive strategy outlines the fundamental basis for obtaining a sustainable competitive advantage within a category. Firms can normally trace their competitive position to one of three factors:
- Superior skills (e.g. coordination of individual specialists, created through the interplay of investment in training and professional development, work and learning)
- Superior resources (e.g. patents, trade-mark protection, specialized physical assets and relationships with suppliers and distribution infrastructure.)
- Superior position (the products or services offered, the market segments served, and the extent to which the product-market can be isolated from direct competition.)
It is essential that the internal analysis provide a frank and open evaluation of the firm's superiority in terms of skills, resources or market position since this will provide the basis for competing over the forthcoming planning period. For this reason, some companies engage external consultants, often advertising or marketing agencies, to provide an independent assessment of the firm's capabilities and resources.
Porter and the positioning school: approach to strategy formulation
In 1980, Michael Porter developed an approach to strategy formulation that proved to be extremely popular with both scholars and practitioners. The approach became known as the positioning school because of its emphasis on locating a defensible competitive position within an industry or sector. In this approach, strategy formulation consists of three key strands of thinking: analysis of the five forces to determine the sources of competitive advantage; the selection of one of three possible positions which leverage the advantage and the value chain to implement the strategy. In this approach, the strategic choices involve decisions about whether to compete for a share of the total market or for a specific target group (competitive scope) and whether to compete on costs or product differences (competitive advantage). This type of thinking leads to three generic strategies:
- Cost leadership – the firm targets the mass market and attempts to be the lowest-cost producer in the market
- Differentiation – the firm targets the mass market and tries to maintain unique points of product difference perceived as desirable by customers and for which they are prepared to pay premium prices
- Focus – the firm does not compete for head to head, but instead selects a narrow target market and focuses its efforts on satisfying the needs of that segment
According to Porter, these strategies are mutually exclusive and the firm must select one approach to the exclusion of all others. Firms that try to be all things to all people can present a confusing market position which ultimately leads to below-average returns. Any ambiguity about the firm's approach is a recipe for "strategic mediocrity" and any firm that tries to pursue two approaches simultaneously is said to be "stuck in the middle" and destined for failure.
Porter's approach was the dominant paradigm throughout the 1980s. However, the approach has attracted considerable criticism. One important criticism is that it is possible to identify successful companies that pursue a hybrid strategy – such as low-cost positions and differentiated positions simultaneously. Toyota is a classic example of this hybrid approach. Other scholars point to the simplistic nature of the analysis and the overly prescriptive nature of the strategic choices which limits strategies to just three options. Yet others point to research showing that many practitioners find the approach to be overly theoretical and not applicable to their business.
Resource-based view (RBV)
During the 1990s, the resource-based view (also known as the resource-advantage theory) of the firm became the dominant paradigm. It is an inter-disciplinary approach that represents a substantial shift in thinking. It focuses attention on an organization's internal resources as a means of organizing processes and obtaining a competitive advantage. The resource-based view suggests that organizations must develop unique, firm-specific core competencies that will allow them to outperform competitors by doing things differently and in a superior manner.
Barney stated that for resources to hold potential as sources of sustainable competitive advantage, they should be valuable, rare, and imperfectly imitable. A key insight arising from the resource-based view is that not all resources are of equal importance nor possess the potential to become a source of sustainable competitive advantage. The sustainability of any competitive advantage depends on the extent to which resources can be imitated or substituted. Barney and others point out that understanding the causal relationship between the sources of advantage and successful strategies can be very difficult in practice. Barney uses the term "causally ambiguous" which he describes as a situation when "the link between the resources controlled by the firm and the firm's sustained competitive advantage is not understood or understood only very imperfectly." Thus, a great deal of managerial effort must be invested in identifying, understanding, and classifying core competencies. In addition, management must invest in organizational learning to develop and maintain key resources and competencies.
Market Based Resources include:
- Organizational culture e.g. market orientation, research orientation, culture of innovation, etc.
- Assets e.g. brands, Mktg IS, databases, etc.
- Capabilities (or competencies) e.g. market sensing, marketing research, relationships, know-how, tacit knowledge, etc.
After more than two decades of advancements in marketing strategy and in the resource-based view paradigm, Cacciolatti & Lee (2016) proposed a novel resource-advantage theory based framework that builds on those organizational capabilities that are relevant to marketing strategy and shows how they have an effect on firm performance. The capabilities-performance model proposed by Cacciolatti & Lee (2016) illustrates the mechanism whereby market orientation, strategic orientation, and organizational power moderate the capabilities-performance relationship. Such a logic of analysis was implicit in the original formulation of RA theory and although it was taken into consideration by several scholars, it was never been articulated explicitly and tested empirically.
In the resource-based view, strategists select the strategy or competitive position that best exploits the internal resources and capabilities relative to external opportunities. Given that strategic resources represent a complex network of inter-related assets and capabilities, organizations can adopt many possible competitive positions. Although scholars debate the precise categories of competitive positions that are used, there is general agreement, within the literature, that the resource-based view is much more flexible than Porter's prescriptive approach to strategy formulation.
Hooley et al., suggest the following classification of competitive positions:
- Price positioning
- Quality positioning
- Innovation positioning
- Service positioning
- Benefit positioning
- Tailored positioning (one-to-one marketing)
Other approaches
The choice of competitive strategy often depends on a variety of factors including: the firm's market position relative to rival firms, the stage of the product life cycle. A well-established firm in a mature market will likely have a different strategy than a start-up.
Growth strategies
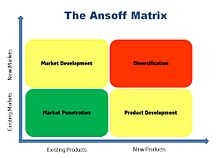
Growth of a business is critical for business success. A firm may grow by developing the market or by developing new products. The Ansoff product and market growth matrix illustrates the two broad dimensions for achieving growth. The Ansoff matrix identifies four specific growth strategies: market penetration, product development, market development and diversification.
- Market penetration involves selling existing products to existing consumers. This is a conservative, low risk approach since the product is already on the established market.
- Product development is the introduction of a new product to existing customers. This can include modifications to an already existing market which can create a product that has more appeal.
- Market development involves the selling of existing products to new customers in order to identify and build a new clientele base. This can include new geographical markets, new distribution channels, and different pricing policies that bring the product price within the competence of new market segments.
- Diversification is the riskiest area for a business. This is where a new product is sold to a new market. There are two type of Diversification; horizontal and vertical. 'Horizontal diversification focuses more on the product(s) where the business is knowledgeable, whereas vertical diversification focuses more on the introduction of new product into new markets, where the business could have less knowledge of the new market.
- Horizontal integration
A horizontal integration strategy may be indicated in fast-changing work environments as well as providing a broad knowledge base for the business and employees. A benefit of horizontal diversification is that it is an open platform for a business to expand and build away from the already existing market.
High levels of horizontal integration lead to high levels of communication within the business. Another benefit of using this strategy is that it leads to a larger market for merged businesses, and it is easier to build good reputations for a business when using this strategy. A disadvantage of using a diversification strategy is that the benefits could take a while to start showing, which could lead the business to believe that the strategy in ineffective. Another disadvantage or risk is, it has been shown that using the horizontal diversification method has become harmful for stock value, but using the vertical diversification had the best effects.
A disadvantage of using the horizontal integration strategy is that this limits and restricts the field of interest that the business. Horizontal integration can affect a business's reputation, especially after a merge has happened between two or more businesses. There are three main benefits to a business's reputation after a merge. A larger business helps the reputation and increases the severity of the punishment. As well as the merge of information after a merge has happened, this increases the knowledge of the business and marketing area they are focused on. The last benefit is more opportunities for deviation to occur in merged businesses rather than independent businesses.
- Vertical integration
Vertical integration is when business is expanded through the vertical production line on one business. An example of a vertically integrated business could be Apple. Apple owns all their own software, hardware, designs and operating systems instead of relying on other businesses to supply these. By having a highly vertically integrated business this creates different economies therefore creating a positive performance for the business. Vertical integration is seen as a business controlling the inputs of supplies and outputs of products as well as the distribution of the final product. Some benefits of using a Vertical integration strategy is that costs may be reduced because of the reducing transaction costs which include finding, selling, monitoring, contracting and negotiating with other firms. Also by decreasing outside businesses input it will increase the efficient use of inputs into the business. Another benefit of vertical integration is that it improves the exchange of information through the different stages of the production line. Some competitive advantages could include; avoiding foreclosures, improving the business marketing intelligence, and opens up opportunities to create different products for the market. Some disadvantages of using a Vertical Integration Strategy include the internal costs for the business and the need for overhead costs. Also if the business is not well organized and fully equipped and prepared the business will struggle using this strategy. There are also competitive disadvantages as well, which include; creates barriers for the business, and loses access to information from suppliers and distributors.
Market position and strategy
In terms of market position, firms may be classified as market leaders, market challengers, market followers or market nichers.
- Market leader: The market leader dominates the market by objective measure of market share. Their overall posture is defensive because they have more to lose. Their objectives are to reinforce their prominent position through the use of PR to develop corporate image and to block competitors brand for brand, matching distribution through tactics such as the use of “fighting” brands, pre-emptive strikes, use of regulation to block competitors and even to spread rumours about competitors. Market leaders may adopt unconventional or unexpected approaches to building growth and their tactical responses are likely to include: product proliferation; diversification; multi-branding; erecting barriers to entry; vertical and horizontal integration and corporate acquisitions.
- Market challenger: The market challenger holds the second highest market share in the category, following closely behind the dominant player. Their market posture is generally offensive because they have less to lose and more to gain by taking risks. They will compete head to head with the market leader in an effort to grow market share. Their overall strategy is to gain market share through product, packaging and service innovations; new market development and redefinition of the product to broaden its scope and their position within it.
- Market follower: Followers are generally content to play second fiddle. They rarely invest in R & D and tend to wait for market leaders to develop innovative products and subsequently adopt a “me-too” approach. Their market posture is typically neutral. Their strategy is to maintain their market position by maintaining existing customers and capturing a fair share of any new segments. They tend to maintain profits by controlling costs.
- Market nicher: The market nicher occupies a small niche in the market in order to avoid head to head competition. Their objective is to build strong ties with the customer base and develop strong loyalty with existing customers. Their market posture is generally neutral. Their strategy is to develop and build the segment and protect it from erosion. Tactically, nichers are likely to improve the product or service offering, leverage cross-selling opportunities, offer value for money and build relationships through superior after-direct sales service, service quality and other related value-adding activities.
As the speed of change in the marketing environment quickens, time horizons are becoming shorter. Nevertheless, most firms carry out strategic planning every 3– 5 years and treat the process as a means of checking whether the company is on track to achieve its vision and mission.[44] Ideally, strategies are both dynamic and interactive, partially planned and partially unplanned. Strategies are broad in their scope in order to enable a firm to react to unforeseen developments while trying to keep focused on a specific pathway. A key aspect of marketing strategy is to keep marketing consistent with a company's overarching mission statement.
Strategies often specify how to adjust the marketing mix; firms can use tools such as Marketing Mix Modeling to help them decide how to allocate scarce resources, as well as how to allocate funds across a portfolio of brands. In addition, firms can conduct analyses of performance, customer analysis, competitor analysis, and target market analysis.
Entry strategies
Marketing strategies may differ depending on the unique situation of the individual business. According to Lieberman and Montgomery, every entrant into a market – whether it is new or not – is classified under a Market Pioneer, Close Follower or a Late follower
Pioneers
Market pioneers are known to often open a new market to consumers based on a major innovation. They emphasize these product developments, and in a significant number of cases, studies have shown that early entrants – or pioneers – into a market have serious market-share advantages above all those who enter later. Pioneers have the first-mover advantage, and in order to have this advantage, business’ must ensure they have at least one or more of three primary sources: Technological Leadership, Preemption of Assets or Buyer Switching Costs. Technological Leadership means gaining an advantage through either Research and Development or the “learning curve”. This lets a business use the research and development stage as a key point of selling due to primary research of a new or developed product. Preemption of Assets can help gain an advantage through acquiring scarce assets within a certain market, allowing the first-mover to be able to have control of existing assets rather than those that are created through new technology. Thus allowing pre-existing information to be used and a lower risk when first entering a new market. By being a first entrant, it is easy to avoid higher switching costs compared to later entrants. For example, those who enter later would have to invest more expenditure in order to encourage customers away from early entrants. However, while Market Pioneers may have the “highest probability of engaging in product development” and lower switching costs, to have the first-mover advantage, it can be more expensive due to product innovation being more costly than product imitation. It has been found that while Pioneers in both consumer goods and industrial markets have gained “significant sales advantages”, they incur larger disadvantages cost-wise.
Close followers
Being a Market Pioneer can, more often than not, attract entrepreneurs and/or investors depending on the benefits of the market. If there is an upside potential and the ability to have a stable market share, many businesses would start to follow in the footsteps of these pioneers. These are more commonly known as Close Followers. These entrants into the market can also be seen as challengers to the Market Pioneers and the Late Followers. This is because early followers are more than likely to invest a significant amount in Product Research and Development than later entrants. By doing this, it allows businesses to find weaknesses in the products produced before, thus leading to improvements and expansion on the aforementioned product. Therefore, it could also lead to customer preference, which is essential in market success. Due to the nature of early followers and the research time being later than Market Pioneers, different development strategies are used as opposed to those who entered the market in the beginning, and the same is applied to those who are Late Followers in the market. By having a different strategy, it allows the followers to create their own unique selling point and perhaps target a different audience in comparison to that of the Market Pioneers. Early following into a market can often be encouraged by an established business’ product that is “threatened or has industry-specific supporting assets”.
Late Entrants
Those who follow after the Close Followers are known as the Late Entrants. While being a Late Entrant can seem very daunting, there are some perks to being a latecomer. For example, Late Entrants have the ability to learn from those who are already in the market or have previously entered. Late Followers have the advantage of learning from their early competitors and improving the benefits or reducing the total costs. This allows them to create a strategy that could essentially mean gaining market share and most importantly, staying in the market. In addition to this, markets evolve, leading to consumers wanting improvements and advancements on products. Late Followers have the advantage of catching the shifts in customer needs and wants towards the products. When bearing in mind customer preference, customer value has a significant influence. Customer value means taking into account the investment of customers as well as the brand or product. It is created through the “perceptions of benefits” and the “total cost of ownership”. On the other hand, if the needs and wants of consumers have only slightly altered, Late Followers could have a cost advantage over early entrants due to the use of product imitation. However, if a business is switching markets, this could take the cost advantage away due to the expense of changing markets for the business. Late Entry into a market does not necessarily mean there is a disadvantage when it comes to market share, it depends on how the marketing mix is adopted and the performance of the business. If the marketing mix is not used correctly – despite the entrant time – the business will gain little to no advantages, potentially missing out on a significant opportunity.
The differentiated strategy
The customized target strategy
The requirements of individual customer markets are unique, and their purchases sufficient to make viable the design of a new marketing mix for each customer.
If a company adopts this type of market strategy, a separate marketing mix is to be designed for each customer.
Specific marketing mixes can be developed to appeal to most of the segments when market segmentation reveals several potential targets.
Developing marketing goals and objectives
Whereas the vision and mission provide the framework, the "goals define targets within the mission, which, when achieved, should move the organization toward the performance of that mission." Goals are broad primary outcomes whereas, objectives are measurable steps taken to achieve a goal or strategy. In strategic planning, it is important for managers to translate the overall strategy into goals and objectives. Goals are designed to inspire action and focus attention on specific desired outcomes. Objectives, on the other hand, are used to measure an organization's performance on specific dimensions, thereby providing the organization with feedback on how well it is achieving its goals and strategies.
Managers typically establish objectives using the balanced scorecard approach. This means that objectives do not include desired financial outcomes exclusively, but also specify measures of performance for customers (e.g. satisfaction, loyalty, repeat patronage), internal processes (e.g., employee satisfaction, productivity) and innovation and improvement activities.
After setting the goals marketing strategy or marketing plan should be developed. The marketing strategy plan provides an outline of the specific actions to be taken over time to achieve the objectives. Plans can be extended to cover many years, with sub-plans for each year. Plans usually involve monitoring, to assess progress, and prepare for contingencies if problems arise. Simultaneous such as customer lifetime value models can be used to help marketers conduct "what-if" analyses to forecast what potential scenarios arising from possible actions, and to gauge how specific actions might affect such variables as the revenue-per-customer and the churn rate.
Strategy typologies
Developing competitive strategy requires significant judgement and is based on a deep understanding of the firm's current situation, its past history and its operating environment. No heuristics have yet been developed to assist strategists choose the optimal strategic direction. Nevertheless, some researchers and scholars have sought to classify broad groups of strategy approaches that might serve as broad frameworks for thinking about suitable choices.
Strategy types
In 2003, Raymond E. Miles and Charles C. Snow, based on an in-depth cross-industry study of a sample of large corporations, proposed a detailed scheme using four categories:
- Prospectors: proactively seek to locate and exploit new market opportunities
- Analyzers: are very innovative in their product-market choices; tend to follow prospectors into new markets; often introduce new or improved product designs. This type of organisation works in two types of market, one generally stable, one subject to more change
- Defenders: are relatively cautious in their initiatives; seek to seal off a portion of the market which they can defend against competitive incursions; often market highest quality offerings and position as a quality leader
- Reactors: tend to vacillate in their responses to environmental changes and are generally the least profitable organizations
Marketing strategy
Marketing warfare strategies are competitor-centered strategies drawn from analogies with the field of military science. Warfare strategies were popular in the 1980s, but interest in this approach has waned in the new era of relationship marketing. An increased awareness of the distinctions between business and military cultures also raises questions about the extent to which this type of analogy is useful. In spite of its limitations, the typology of marketing warfare strategies is useful for predicting and understanding competitor responses.
In the 1980s, Kotler and Singh developed a typology of marketing warfare strategies:
- Frontal attack: where an aggressor goes head to head for the same market segments on an offer by offer, price by price basis; normally used by a market challenger against a more dominant player
- Flanking attack: attacking an organization on its weakest front; used by market challengers
- Bypass attack: bypassing the market leader by attacking smaller, more vulnerable target organizations in order to broaden the aggressor's resource base
- Encirclement attack: attacking a dominant player on all fronts
- Guerilla warfare: sporadic, unexpected attacks using both conventional and unconventional means to attack a rival; normally practiced by smaller players against the market leader
Relationship between the marketing strategy and the marketing mix
Marketing strategy and marketing mix are related elements of a comprehensive marketing plan. While marketing strategy is aligned with setting the direction of a company or product/service line, the marketing mix is majorly tactical in nature and is employed to carry out the overall marketing strategy. The 4P's of the marketing mix (Price, Product, Place and Promotion) represent the tools that marketers can leverage while defining their marketing strategy to create a marketing plan.

