The history of banking began with the first prototype banks, that is, the merchants of the world, who gave grain loans to farmers and traders who carried goods between cities. This was around 2000 BCE in Assyria, India and Sumeria. Later, in ancient Greece and during the Roman Empire, lenders based in temples gave loans, while accepting deposits and performing the change of money. Archaeology from this period in ancient China and India also shows evidence of money lending.
Many scholars trace the historical roots of the modern banking system to medieval and Renaissance Italy, particularly the affluent cities of Florence, Venice and Genoa. The Bardi and Peruzzi Families dominated banking in 14th century Florence, establishing branches in many other parts of Europe. The most famous Italian bank was the Medici Bank, established by Giovanni Medici in 1397. The oldest bank still in existence is Banca Monte dei Paschi di Siena, headquartered in Siena, Italy, which has been operating continuously since 1472. Until the end of 2022, the oldest bank still in operation was the Banco di Napoli headquartered in Naples, Italy, which had been operating since 1463.
Development of banking spread from northern Italy throughout the Holy Roman Empire, and in the 15th and 16th century to northern Europe. This was followed by a number of important innovations that took place in Amsterdam during the Dutch Republic in the 17th century, and in London since the 18th century. During the 20th century, developments in telecommunications and computing caused major changes to banks' operations and let banks dramatically increase in size and geographic spread. The financial crisis of 2007–2008 caused many bank failures, including some of the world's largest banks, and provoked much debate about bank regulation.
Ancient authority
The shift from a reliance on hunting and gathering of foods to agricultural practices, starting sometime after 12,000 BCE, resulted in increased stability of economic relations. Such changes in socio-economic conditions began approximately 10,000 years ago in the Fertile Crescent, about 9,500 years ago in northern China, about 5,500 years ago in Mexico, and approximately 4,500 years ago in the eastern parts of the United States.
Monetary
Ancient types of money known as grain-money and food cattle-money were used from around 9000 BCE as two of the earliest commodities used for purposes of bartering.
Anatolian obsidian as a raw material for Stone Age tools was being distributed from as early as about 12,500 BCE, and organized trading of it was occurring during the 9th millennium BCE (Cauvin; Chataigner 1989). Sardinia was one of the four main sites for sourcing the material deposits of obsidian within the Mediterranean; trade using obsidian was replaced during the 3rd millennium BCE by trade of copper and silver.
Record-keeping
Objects used for record keeping, "bulla" and tokens, have been recovered from within Near East excavations, dated to a period beginning 8000 BCE and ending 1500 BCE, as records of the counting of agricultural produce. Commencing in the late fourth millennia mnemonic symbols were in use by members of temples and palaces to record stocks of produce. Types of records accounting for trade exchanges of payments were first being made about 3200 BCE. The Code of Hammurabi, written on a clay tablet around 1700 BCE, describes the regulation of banking activity within the civilization (Armstrong); although still rudimentary, banking was well enough developed to justify laws governing banking operations. Later during the Achaemenid Empire (after 646 BCE), further evidence is found of banking practices in the Mesopotamia region.
Structural
By the 5th millennium BCE, the settlements of Sumer, such as Eridu, were formed around a central temple. In the fifth millennium, people began to build and live in the civilization of cities, providing a structure for the construction of institutions and establishments. Tell Brak and Uruk were two early urban settlements.
Earliest forms of banking
Asia
Mesopotamia and Persia
Banking as an archaic activity (or quasi-banking) is thought to have begun as early as the latter part of the 4th millennium BCE, to the 3rd millennia BCE.
Prior to the reign of Sargon I of Akkad (2335–2280 BCE) the occurrence of trade was limited to the internal boundaries of each city-state of Babylon and the temple located at the centre of economic activity therein; trade at the time for citizens external to the city was forbidden.
In Babylonia of 2000 BCE, people depositing gold were required to pay amounts as much as one sixtieth of the total deposited. Both the palaces and temple are known to have provided lending and issuing from the wealth they held—the palaces to a lesser extent. Such loans typically involved issuing seed-grain, with re-payment from the harvest. These basic social agreements were documented in clay tablets, with an agreement on interest accrual. The habit of depositing and storing of wealth in temples continued at least until 209 BCE, as evidenced by Antioch having ransacked or pillaged the temple of Aine in Ecbatana (Media) of gold and silver.
More information comes from the code commissioned by Hammurabi, king of Babylon c. 1792–1750 BCE. Law 100 stipulated that repayment of a loan by a debtor to a creditor was to be on a schedule with a maturity date specified in written contractual terms. Law 122 stipulated that a depositor of gold, silver, or other property must present all articles and a signed contract of bailment to a notary before depositing the articles with a banker, and Law 123 stipulated that a banker was discharged of any liability from a contract of bailment if the notary denied the existence of the contract. Law 124 stipulated that a depositor with a notarized contract of bailment was entitled to redeem the entirety of their deposit, and Law 125 stipulated that a banker was liable for replacement of deposits stolen while in their possession.
Cuneiform records of the house of Egibi of Babylonia describe the family's financial activities as having occurred sometime after 1000 BCE and ending sometime during the reign of Darius I. These records suggest a "lending house" (Silver 2002), a family engaging in "professional banking..." (Dandamaev et al. 2004), and economic activities similar to modern deposit banking. Another interpretation is that the family's activities are better described as entrepreneurship rather than banking (Wunsch 2007). The Murashu family apparently took part in providing credit(Moshenskyi 2008).
Asia Minor
From the fourth millennia previously agricultural settlements began administrative activities.
The temple of Artemis at Ephesus was the largest depository of Asia. A pot-hoard dated to 600 BCE was found in excavations by The British Museum during 1904. During the time of the cessation of the first Mithridatic war, the entire debt being held at the time was annulled by the council. Mark Anthony is recorded to have stolen from the deposits on occasion. The temple served as a depository for Aristotle, Caesar, Dio Chrysostomus, Plautus, Plutarch, Strabo and Xenophon.
The temple to Apollo in Didyma was constructed sometime in the 6th century. A large sum of gold was deposited within the treasury at the time by king Croesus.
India
In ancient India there are evidences of loans from the Vedic period (beginning 1750 BCE). Later during the Maurya dynasty (321 to 185 BCE), an instrument called adesha was in use, which was an order on a banker desiring him to pay the money of the note to a third person, which corresponds to the definition of a bill of exchange as we understand it today. During the Buddhist period, there was considerable use of these instruments. Merchants in large towns gave letters of credit to one another.
China
Main : History of banking in China
In ancient China, starting in the Qin Dynasty (221 to 206 BCE), Chinese currency developed with the introduction of standardized coins that allowed easier trade across China, and led to development of letters of credit. These letters were issued by merchants who acted in ways that today we would understand as banks.
Ancient Egypt
Some scholars suggest that the Egyptian grain-banking system became so well-developed that it was comparable to major modern banks, both in terms of its number of branches and employees, and in terms of the total volume of transactions. During the rule of the Greek Ptolemies, the granaries were transformed into a network of banks centered in Alexandria, where the main accounts from all of the Egyptian regional grain-banks were recorded. This became the site of one of the earliest known government central banks, and may have reached its peak with the assistance of Greek bankers.
According to Muir (2009) there were two types of banks operating within Egypt: royal and private. Documents made to show the banking of taxes were known as peptoken-records.
Greece
Trapezitica is the first source documenting banking (de Soto – p. 41). The speeches of Demosthenes contain numerous references to the issuing of credit (Millett p. 5). Xenophon is credited to have made the first suggestion of the creation of an organisation known in the modern definition as a joint-stock bank in On Revenues written circa 353 BCE.
The city-states of Greece after the Persian Wars produced a government and culture sufficiently organized for the birth of a private citizenship and therefore an embryonic capitalist society, allowing for the separation of wealth from exclusive state ownership to the possibility of ownership by the individual.
According to one source (Dandamaev et al.), trapezites were the first to trade using money, during the 5th century BCE, as opposed to earlier trade which occurred using forms of pre-money.
Specific focus of funds
The earliest forms of storage utilized were the rudimentary money-boxes (ΘΗΣΑΥΡΌΣ) which were made similar in form to the construction of a bee-hive, and were found for example in the Mycenae tombs of 1550–1500 BCE.
Private and civic entities within ancient Grecian society, especially Greek temples, performed financial transactions. (Gilbart p. 3) The temples were the places where treasure was deposited for safe-keeping. The three temples thought the most important were the temple to Artemis in Ephesus, and temple of Hera within Samos, and within Delphi, the temple to Apollo. These consisted of deposits, currency exchange, validation of coinage, and loans.
The first treasury to the Apollonian temple was built before the end of the 7th century BCE. A treasury of the temple was constructed by the city of Siphnos during the 6th century.
Before the destruction by Persians during the 480 invasion, the Athenian Acropolis temple dedicated to Athena stored money; Pericles rebuilt a depository afterward contained within the Parthenon.
During the reign of the Ptolemies, state depositories replaced temples as the location of security-deposits. Records exist to show this having occurred by the end of the reign of Ptolemy I (305–284).
As the need for new buildings to house operations increased, construction of these places within the cities began around the courtyards of the agora (markets).
Geographical focus of banking activities
Athens received the Delian league's treasury during 454.
During the late 3rd and 2nd century BCE, the Aegean island of Delos became a prominent banking center. During the 2nd century, there were for certain three banks and one temple depository within the city.
Thirty-five Hellenistic cities had private banks during the 2nd century (Roberts – p. 130).
Of the settlements of the Greco-Roman world of the 1st century CE, three were of pronounced wealth and centres of banking: Athens, Corinth and Patras.
Loans
Many loans are recorded in writings from the classical age, although a very small proportion were provided by banks. Provision of these were likely an occurrence of Athens, with loans known to have been provided at some time at an annual interest of 12%. Within the boundaries of Athens, bankers' loans are recorded as having been issued on eleven occasions altogether (Bogaert 1968).
Banks sometimes made loans available confidentially, which is, they provided funds without being publicly and openly known to have done so In addition, they kept depositors' names confidential as well. This intermediation per se was known as dia tes trapazēs.
A loan was made by a Temple of Athens to the state during 433–427 BCE.
Rome
Roman banking activities were a crucial presence within temples. For instance the minting of coins occurred within temples, most importantly the Juno Moneta temple, though during the time of the Empire, public deposits gradually ceased to be held in temples, and instead were held in private depositories. Still, the Roman Empire inherited the mercantile practices from Greece (Parker).
During 352 BCE a rudimentary public bank (known as dēmosía trápeza ) was formed, with the passing of a consular directive to form a commission of mensarii to deal with debt in the impoverished lower classes. Another source shows banking practices during 325 BCE when, on account of being in debt, the Plebeians were required to borrow money, so newly appointed quinqueviri mensarii were commissioned to provide services to those who had security to provide, in exchange for money from the public treasury. Another source (J. Andreau) has the shops of banking of Ancient Rome firstly opening in the public forums during the period 318 to 310 BCE.
In early Ancient Rome deposit bankers were known as argentarii and at a later time (from the 2nd century CE onward) as nummularii (Andreau 1999 p. 2) or mensarii. The banking-houses were known as Taberae Argentarioe and Mensoe Numularioe. They would set up their stalls in the middle of enclosed courtyards called macella on a long bench called a bancu, from which the words banco and bank are derived. As a money changer, the merchant at the bancu did not so much invest money as merely convert the foreign currency into the only legal tender in Rome—that of the Imperial Mint.
Operations of banking within Roman society were known as officium argentarii. Statutes (125/126 CE) of the Empire described "letter from Caesar to Quietus" show rental monies to be collected from persons using land belonging to a temple and given to the temple treasurer, as decreed by Mettius Modestus, governor of Lycia and Pamphylia. A law, receptum argentarii, obliged a bank to pay its clients debts under guarantee.
Cassius Dio advocated the establishment of a state bank, funded by the sale of all the properties owned at the time by the state.
In the 4th century monopolies existed in Byzantium and in the city of Olbia in Sardinia.
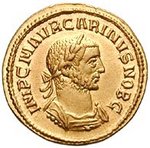
The Roman empire at some time formalized the administrative aspect of banking and instituted greater regulation of financial institutions and financial practices. Charging interest on loans and paying interest on deposits became more highly developed and competitive. The development of Roman banks was limited, however, by the Roman preference for cash transactions. During the reign of the Roman emperor Gallienus (260–268 CE), there was a temporary breakdown of the Roman banking system after the banks rejected the flakes of copper produced by his mints. With the ascent of Christianity, banking became subject to additional restrictions, as the charging of interest was seen as immoral. After the fall of Rome, banking temporarily ended in Europe and was not revived until the time of the crusades.
Religious restrictions on interest
Most early religious systems in the ancient Near East, and the secular codes arising from them, did not forbid usury. These societies regarded inanimate matter as alive, like plants, animals and people, and capable of reproducing itself. Hence if you lent 'food money', or monetary tokens of any kind, it was legitimate to charge interest. Food money in the shape of olives, dates, seeds or animals was lent out as early as c. 5000 BCE, if not earlier. Among the Mesopotamians, Hittites, Phoenicians and Egyptians, interest was legal and often fixed by the state.
Judaism
The Torah and later sections of the Hebrew Bible criticize interest-taking, but interpretations of the Biblical prohibition vary. One common understanding is that Jews are forbidden to charge interest upon loans made to other Jews, but obliged to charge interest on transactions with non-Jews. However, the Hebrew Bible itself gives numerous examples where this provision was evaded.
Deuteronomy 23:19 Thou shalt not lend upon interest to thy brother: interest of money, interest of victuals, interest of any thing that is lent upon interest. Deuteronomy 23:20 Unto a foreigner thou mayest lend upon interest; but unto thy brother thou shalt not lend upon interest; that the LORD thy God may bless thee in all that thou puttest thy hand unto, in the land whither thou goest in to possess it.
In general, it was seen as advantageous to avoid debt at all, to avoid being bound to someone else. Debt was to be avoided and not used to finance consumption, except when in need. However, laws against usury were among many the prophets condemned the people for breaking.
The interpretation that interest could be charged to non-Israelites would be used in the 14th century for Jews living within Christian societies in Europe to justify lending money for profit. This conveniently side stepped the rules against usury in both Judaism and Christianity, as Christians were not involved in the lending but were still free to take the loans.
Christianity
Originally, the charging of interest, known as usury, was banned by Christian churches. This included charging a fee for the use of money, such as at a bureau de change. However over time the charging of interest became acceptable due to the changing nature of money, and the term 'usury' came to be used for charging interest above the rate allowed by law. The notion of "Christian finance" refers to banking and financial activities that came into existence several centuries ago. Despite the prohibition of usury and the Church distrust against exchange activities (as opposed to production activities), a number of operations of a banking or financial nature are in evidence in the activities of the Knights Templar (12th century), Mounts of Piety (appeared in 1462) and the Apostolic Chamber attached directly to the Vatican (money loans, guarantees, issuance of securities, investments, etc.)
The rise of Protestantism in the 16th century weakened Rome's influence, and its dictates against usury became irrelevant in some areas, freeing up the development of banking in Northern Europe. In the late 18th century, Protestant merchant families began to move into banking to an increasing degree, especially in trading countries such as the United Kingdom (Barings), Germany (Schroders, Berenbergs) and the Netherlands (Hope & Co., Gülcher & Mulder). At the same time, new types of financial activities broadened the scope of banking far beyond its origins. One school of thought attributes to Calvinism the setting of the stage for the later development of capitalism in northern Europe. In this view, elements of Calvinism represented a revolt against the medieval condemnation of usury and, implicitly, of profit in general. Such a connection was advanced in influential works by R. H. Tawney (1880–1962) and by Max Weber (1864–1920). According to Weber, the Protestant work ethic was a force behind an unplanned and uncoordinated mass action that influenced the development of capitalism.
Rodney Stark propounds the theory that Christian rationality is the primary driver behind the success of capitalism and the Rise of the West.
Islam
The Quran strictly prohibits lending money on Interest. "O you who have believed, do not consume usury, doubled and multiplied, but fear Allah that you may be successful" (3:130) "and Allah has permitted trade and has forbidden interest" (2:275).
The Quran states that taking interest and making money through unethical means was prohibited for Muslims and in other communities in earlier times as well: "Because of the wrongdoing of the Jews We forbade them good things which were (before) made lawful unto them, and because of their much hindering from Allah's way, And of their taking usury when they were forbidden it, and of their devouring people's wealth by false pretenses, We have prepared for those of them who disbelieve a painful doom." (Al Quran – 4:160–161)
Riba is forbidden in Islamic economic jurisprudence (fiqh). Islamic jurists discuss two types of riba: an increase in capital with no services provided, which the Qur'an prohibits, and commodity exchanges in unequal quantities, which the Sunnah prohibits. Trade in promissory notes (e.g. fiat money and derivatives) is forbidden.
Despite the prohibition of charging interest, during the 20th century a number of developments took place that would lead to an Islamic banking model where no interest is charged but banks would still operate for profit. This was done through charging for loans in alternative ways such as through fees and using different methods of risk sharing and ownership models such as leasing.
Medieval Europe
The roots of modern banking are traceable to medieval and early Renaissance Italy, to rich northern cities such as Florence, Venice, and Genoa.
Emergence of merchant banks
The original banks were "merchant banks" that Italian grain merchants invented in the Middle Ages. As Lombardy merchants and bankers grew in stature based on the strength of the Lombard plains cereal crops, many displaced Jews fleeing Spanish persecution were attracted to the trade. They brought with them ancient practices from the Middle and Far East silk routes. Originally intended to finance long trading journeys, they applied these methods to finance grain production and trading.
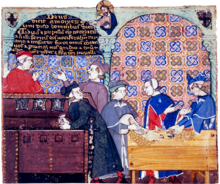
Jews could not hold land in Italy, so they entered the great trading piazzas and halls of Lombardy, alongside local traders, and set up their benches to trade in crops. They had one great advantage over the locals: Christians were strictly forbidden usury, defined as lending at interest, as it was considered to be a sin. (Islam similarly condemns usury). The Jewish newcomers, on the other hand, could make high-risk loans to farmers against crops in the field, as they were not subject to the Church's dictates. In this way, they could secure grain-sale rights against the eventual harvest. They then began to advance payment against the future delivery of grain shipped to distant ports. In both cases they made a profit from the present discount against the future price. This two-handed trade was time-consuming and soon there arose a class of merchants who were trading grain debt instead of grain.
The Jewish trader performed both financing (credit) and underwriting (insurance) functions. Financing took the form of a crop loan at the beginning of the growing season, which allowed a farmer to cultivate his annual crop, with the associated expenses of seeding, growing, weeding, and harvesting. Underwriting in the form of crop, or commodity, insurance guaranteed the delivery of the crop to its buyer, typically a merchant wholesaler. In addition, traders performed the merchant function by making arrangements to supply the buyer with the crop through alternative sources—grain stores or alternate markets, for instance—in the event of crop failure. He could also keep the farmer (or other commodity producer) in business during a drought or other crop failure, through the issuance of crop (or commodity) insurance against the hazard of failure of his crop.
Merchant banking progressed from financing trade on one's own behalf to settling trades for others, and then to holding deposits for settlement of "billette" or notes written by the people who were still brokering the actual grain. And so the merchant's "benches" (bank is derived from the Italian for bench, banca, as in a counter) in the great grain markets became centres for holding money against a bill (billette, a note, a letter of formal exchange, later a bill of exchange and later still a cheque).
These deposited funds were intended to be held for the settlement of grain trades, but often were used for the bench's own trades in the meantime. The term bankrupt is a corruption of the Italian banca rotta, or broken bench, which is what happened when someone lost his traders' deposits. The expression of "being broke" has a similar etymology.
Crusades
In the 12th century, the need to transfer large sums of money to finance the Crusades stimulated the re-emergence of banking in western Europe. In 1162, Henry II of England levied a tax to support the crusades—the first of a series of taxes levied by Henry over the years with the same objective. The Templars and Hospitallers acted as Henry's bankers in the Holy Land. The Templars' far-flung, large land holdings across Europe also emerged in the 1100–1300 time frame as the beginning of Europe-wide banking. Their practice was to take in local currency for which a demand note would be given that would be good at any of their castles across Europe, allowing movement of money without the usual risk of robbery while traveling.
Discounting of interest
A sensible manner of discounting interest to the depositors against what could be earned by employing their money in the trade of the bench soon developed; in short, selling an "interest" to them in a specific trade, thus overcoming the usury objection. Once again this merely developed what was an ancient method of financing long-distance transport of goods.
Medieval trade fairs, such as the one in Hamburg, contributed to the growth of banking in a curious way: moneychangers issued documents redeemable at other fairs, in exchange for hard currency. These documents could be cashed at another fair in a different country or at a future fair in the same location. If redeemable at a future date, they would often be discounted by an amount comparable to a rate of interest. Eventually, these documents evolved into bills of exchange, which could be redeemed at any office of the issuing banker. These bills made it possible to transfer large sums of money without the complications of hauling large chests of gold and hiring armed guards to protect the gold from thieves.
Italian bankers
The Republic of Venice, sometimes mistakenly credited with establishing a Bank of Venice in the 12th century, did not formally create a public bank until 1587. However in the 13th and 14th centuries its Grain Office did a banking business that included both deposits and lending. The Republic's system of transferable public debt has also been identified as an important contribution to the development of banking.
In the middle of the 13th century, groups of Italian Christians, particularly the Cahorsins and Lombards, invented legal loopholes to get around the ban on Christian usury; for example, one method of effecting a loan with interest was to offer money without interest, but also require that the loan be insured against possible loss or injury, and/or delays in repayment (see contractum trinius). The Christians utilizing these legal loopholes became known as the pope's usurers, and reduced the importance of the Jews to European monarchs. Later in the Middle Ages, a distinction evolved between things that were consumable (such as food and fuel) and those that were not, with usury permitted on loans that involved the latter.
The most powerful banking families came from Florence, including the Acciaiuoli, Mozzi, Bardi and Peruzzi families, which established branches in many other parts of Europe. Probably the most famous Italian bank was the Medici bank, set up by Giovanni di Bicci de' Medici in 1397 and continuing until 1494. (Banca Monte dei Paschi di Siena S.p.A. (BMPS) Italy, is in fact the oldest banking organisation to have surviving banking-operations, or services).
By the later Middle Ages, Christian Merchants who lent money with interest were without opposition, and Jews lost their privileged position as money-lenders. Italian bankers would take their place, and by 1327, Avignon had 43 branches of Italian banking houses. In 1347, Edward III of England defaulted on loans. Later there was the bankruptcy of the Bardi (1343 ) and Peruzzi (1346). The accompanying growth of Italian banking in France was the start of the Lombard moneychangers in Europe, who moved from city to city along the busy pilgrim routes important for trade. Key cities in this period were Cahors, the birthplace of Pope John XXII, and Figeac.
After 1400, political forces did in fact somewhat turn against the methods of the Italian free enterprise bankers. In 1401 King Martin I of Aragon had some of these bankers expelled. In 1403, Henry IV of England prohibited them from taking profits in any way in his kingdom. In 1409, Flanders imprisoned and then expelled Genoese bankers. In 1410, all Italian merchants were expelled from Paris. In 1407, the Bank of Saint George, the first state-bank of deposit, was founded in Genoa and was to dominate business in the Mediterranean.
15th–17th centuries – Expansion
Italy
Between 1527 and 1572 a number of important banking family groups arose, such as the Grimaldi, Spinola and Pallavicino families, who were especially influential and wealthy, the Doria, although perhaps less influential, and the Pinelli and the Lomellini.
Spain and the Ottoman Empire
In 1401 the magistrates of Barcelona, then the capital of the Principality of Catalonia, established in the city the first replication of the Venetian model of exchange and deposit, Taula de canvi—the Table of Exchange, considered to be the first public bank of Europe.
Halil Inalcik suggests that, in the 16th century, Marrano Jews (Doña Gracia from House of Mendes) fleeing from Iberia introduced the techniques of European capitalism, banking and even the mercantilist concept of state economy to the Ottoman Empire. In the 16th century, the leading financiers in Istanbul were Greeks and Jews. Many of the Jewish financiers were Marranos who had fled from Iberia during the period leading up to the expulsion of Jews from Spain. Some of these families brought great fortunes with them. The most notable of the Jewish banking families in the 16th-century Ottoman Empire was the Marrano banking house of Mendes, which moved to Istanbul in 1552, under the protection of Sultan Suleyman the Magnificent. When Alvaro Mendes arrived in Istanbul in 1588, he is reported to have brought with him 85,000 gold ducats. The Mendès family soon acquired a dominating position in the state finances of the Ottoman Empire and in commerce with Europe.
They thrived in Baghdad during the 18th and 19th centuries under Ottoman rule, performing critical commercial functions such as moneylending and banking. Like the Armenians, the Jews could engage in necessary commercial activities, such as moneylending and banking, that were proscribed for Muslims under Islamic law.
Court Jew
Court Jews were Jewish bankers or businessmen who lent money and handled the finances of some of the Christian European noble houses, primarily in the 17th and 18th centuries. Court Jews were precursors to the modern financier or Secretary of the Treasury. Their jobs included raising revenues by tax farming, negotiating loans, master of the mint, creating new sources for revenue, floating debentures, devising new taxes. and supplying the military. In addition, the Court Jew acted as personal bankers for nobility: he raised money to cover the noble's personal diplomacy and his extravagances.
Court Jews were skilled administrators and businessmen who received privileges in return for their services. They were most commonly found in Germany, Holland, and Austria, but also in Denmark, England, Hungary, Italy, Poland, Lithuania, Portugal, and Spain. According to Dimont, virtually every duchy, principality, and palatinate in the Holy Roman Empire had a Court Jew.
Germany
In the southern German realm, two great banking families emerged in the 15th century, the Fuggers and the Welsers. They came to control much of the European economy and to dominate international high finance in the 16th century. The Fuggers built the first German social housing area for the poor in Augsburg, the Fuggerei. It still exists, but not the original Fugger Bank which lasted from 1486 to 1647.
Dutch bankers played a central role in establishing banking in the Northern German city states. Berenberg Bank is the oldest bank in Germany and the world's second oldest, established in 1590 by Dutch brothers Hans and Paul Berenberg in Hamburg. The bank is still owned by the Berenberg dynasty.
Netherlands
In the 16th and 17th century, precious metals from the New World, Gold Coast, Japan and other locales were being imported into Europe, with corresponding price increases. Thanks to the free coinage, the Bank of Amsterdam, and the heightened trade and commerce, the Netherlands attracted even more coin and bullion to be deposited in their banks. The concepts of fractional-reserve banking and payment systems were further developed and spread to England and elsewhere.
England
In the City of London there were no banking houses operating in a manner recognized as so today until the 17th century, although the London Royal Exchange was established in 1565.
17th–19th centuries – The emergence of modern banking
By the end of the 16th century and during the 17th, the traditional banking functions of accepting deposits, moneylending, money changing, and transferring funds were combined with the issuance of bank debt that served as a substitute for gold and silver coins.
New banking practices promoted commercial and industrial growth by providing a safe and convenient means of payment and a money supply more responsive to commercial needs, as well as by "discounting" business debt. By the end of the 17th century, banking was also becoming important for the funding requirements of the combative European states. This would lead on to government regulations and the first central banks. The success of the new banking techniques and practices in Amsterdam and London helped spread the concepts and ideas elsewhere in Europe.
Goldsmiths of London
Modern banking practice, including fractional reserve banking and the issue of banknotes, emerged in the 17th century. At the time, wealthy merchants began to store their gold with the goldsmiths of London, who possessed private vaults and charged a fee for their service. In exchange for each deposit of precious metal, the goldsmiths issued receipts certifying the quantity and purity of the metal they held as a bailee; these receipts could not be assigned, only the original depositor could collect the stored goods.
Gradually the goldsmiths began to lend the money out on behalf of the depositor, which led to the development of modern banking practices; promissory notes (which evolved into banknotes) were issued for money deposited as a loan to the goldsmith.
These practices created a new kind of "money" that was actually debt, that is, goldsmiths' debt rather than silver or gold coin, a commodity that had been regulated and controlled by the monarchy. This development required the acceptance in trade of the goldsmiths' promissory notes, payable on demand. Acceptance in turn required a general belief that coin would be available; and a fractional reserve normally served this purpose. Acceptance also required that the holders of debt be able to legally enforce an unconditional right to payment; it required that the notes (as well as drafts) be negotiable instruments. The concept of negotiability had emerged in fits and starts in European money markets, but it was well developed by the 17th century. Nevertheless, an act of Parliament was required in the early 18th century (1704) to overrule court decisions holding that the goldsmiths' notes, despite the "customs of merchants", were not negotiable.
The modern bank
In 1695, the Bank of England became one of the first banks to issue banknotes, the first being the short-lived banknotes issued by Stockholms Banco in 1661. Initially, these were hand-written and issued on deposit or as a loan, and promised to pay the bearer the value of the note on demand in specie. By 1745, standardized printed notes ranging from £20 to £1,000 were being issued. Fully printed notes that didn't require the name of the payee and the cashier's signature first appeared in 1855.
In the 18th century, services offered by banks increased. Clearing facilities, security investments, cheques and overdraft protections were introduced. Cheques had been used since the 1600s in England and banks settled payments by direct courier to the issuing bank. Around 1770, they began meeting in a central location, and by the 1800s a dedicated space was established, known as a bankers' clearing house. The method used by the London clearing house involved each bank paying cash to an inspector and then being paid cash by the inspector at the end of each day. The first overdraft facility was set up in 1728 by the Royal Bank of Scotland.
The number of banks increased during the Industrial Revolution and the growing international trade, especially in London. At the same time, new types of financial activities broadened the scope of banking. The merchant-banking families dealt in everything from underwriting bonds to originating foreign loans. These new "merchant banks" facilitated trade growth, profiting from England's emerging dominance in seaborne shipping. Two immigrant families, Rothschild and Baring, established merchant banking firms in London in the late 18th century and came to dominate world banking in the next century.
A great impetus to country banking came in 1797 when, with England threatened by war, the Bank of England suspended cash payments. A handful of Frenchmen landed in Pembrokeshire, causing a panic. Shortly after this incident, Parliament authorised the Bank of England and country bankers to issue notes of low denomination.
Chinese banking
During the Qing dynasty, the private nationwide financial system in China was first developed by the Shanxi merchants, with the creation of so-called "draft banks". The first draft bank Rishengchang was created around 1823 in Pingyao. Some large draft banks had branches in Russia, Mongolia and Japan to facilitate international trade. Throughout the 19th century, the central Shanxi region became the de facto financial centre of Qing China.
With the fall of the Qing dynasty, the financial centers gradually shifted to Shanghai, with western-style modern banks flourishing. Today, the financial centres in China are Hong Kong, Beijing, Shanghai and Shenzhen.
Japanese banking
In 1868, the Meiji government attempted to formulate a functioning banking system, which continued until some time during 1881. They emulated French models. The Imperial mint began using imported machines from Britain in the early years of the Meiji period.
Masayoshi Matsukata was a formative figure of a later banking initiative.
Development of central banking
The Bank of Amsterdam became a model for the functioning of a bank in the capacity of monetary exchange and started the development of central banks. An early central bank was the Sveriges Riksbank, established in 1668, although this was short-lived.
In England in the 1690s, public funds were in short supply and were needed to finance the ongoing conflict with France. The credit of William III's government was so low in London that it was impossible for it to borrow the £1,200,000 (at 8 per cent) that the government wanted. In order to induce subscription to the loan, the subscribers were to be incorporated by the name of the Governor and Company of the Bank of England. The bank was given exclusive possession of the government's balances, and was the only limited-liability corporation allowed to issue banknotes. The lenders would give the government cash (bullion) and also issue notes against the government bonds, which can be lent again. The £1.2M was raised in 12 days; half of this was used to rebuild the Navy. The establishment of the Bank of England, the model on which most modern central banks have been based on, was devised by Charles Montagu, 1st Earl of Halifax, in 1694, to the plan which had been proposed by William Paterson three years before, but had not been acted upon. He proposed a loan of £1.2M to the government; in return the subscribers would be incorporated as The Governor and Company of the Bank of England with long-term banking privileges including the issue of notes. The Royal Charter was granted on 27 July through the passage of the Tonnage Act 1694.
Although the Bank was originally a private institution, by the end of the 18th century it was increasingly being regarded as a public authority with civic responsibility toward the upkeep of a healthy financial system. The currency crisis of 1797, caused by panicked depositors withdrawing from the Bank led to the government suspending convertibility of notes into specie payment. The bank was soon accused by the bullionists of causing the exchange rate to fall from over issuing banknotes, a charge which the Bank denied. Nevertheless, it was clear that the Bank was being treated as an organ of the state.
Henry Thornton, a merchant banker and monetary theorist has been described as the father of the modern central bank. An opponent of the real bills doctrine, he was a defender of the bullionist position and a significant figure in monetary theory, his process of monetary expansion anticipating the theories of Knut Wicksell regarding the "cumulative process which restates the Quantity Theory in a theoretically coherent form". As a response 1797 currency crisis, Thornton wrote in 1802 An Enquiry into the Nature and Effects of the Paper Credit of Great Britain, in which he argued that the increase in paper credit did not cause the crisis. The book also gives a detailed account of the British monetary system as well as a detailed examination of the ways in which the Bank of England should act to counteract fluctuations in the value of the pound.
Until the mid-nineteenth century, commercial banks were able to issue their own banknotes, and notes issued by provincial banking companies were commonly in circulation. Many consider the origins of the central bank to lie with the passage of the Bank Charter Act of 1844. Under the 1844 Act, bullionism was institutionalized in Britain, creating a ratio between the gold reserves held by the Bank of England and the notes that the Bank could issue. The Act also placed strict curbs on the issuance of notes by the country banks.
The Bank accepted the role of 'lender of last resort' in the 1870s after criticism of its lacklustre response to the Overend-Gurney crisis. The journalist Walter Bagehot wrote an influential work on the subject Lombard Street: A Description of the Money Market, in which he advocated for the Bank to officially become a lender of last resort during a credit crunch (sometimes referred to as "Bagehot's dictum").
Central banks were established in many European countries during the 19th century. The War of the Second Coalition led to the creation of the Banque de France in 1800, in an effort to improve the public financing of the war. The US Federal Reserve was created by the U.S. Congress through the passing of The Federal Reserve Act in 1913. Australia established its first central bank in 1920, Colombia in 1923, Mexico and Chile in 1925 and Canada and New Zealand in the aftermath of the Great Depression in 1934. By 1935, the only significant independent nation that did not possess a central bank was Brazil, which subsequently developed a precursor thereto in 1945 and the present central bank twenty years later. Having gained independence, African and Asian countries also established central banks or monetary union.
Rothschilds
The Rothschild family pioneered international finance in the early 19th century. The family provided loans to the Bank of England and purchased government bonds in the stock markets. Their wealth has been estimated to possibly be the most in modern history. In 1804, Nathan Mayer Rothschild began to deal on the London stock exchange in financial instruments such as foreign bills and government securities. From 1809 Rothschild began to deal in gold bullion, and developed this as a cornerstone of his business. From 1811 on, in negotiation with Commissary-General John Charles Herries, he undertook to transfer money to pay Wellington's troops, on campaign in Portugal and Spain against Napoleon, and later to make subsidy payments to British allies when these organized new troops after Napoleon's disastrous Russian campaign. His four brothers helped co-ordinate activities across the continent, and the family developed a network of agents, shippers and couriers to transport gold—and information—across Europe. This private intelligence service enabled Nathan to receive in London the news of Wellington's victory at the Battle of Waterloo a full day ahead of the government's official messengers.
The Rothschild family were instrumental in supporting railway systems across the world and in complex government financing for projects such as the Suez Canal. The family bought up a large proportion of the property in Mayfair, London. Major businesses directly founded by Rothschild family capital include Alliance Assurance (1824) (now Royal & SunAlliance); Chemin de Fer du Nord (1845); Rio Tinto Group (1873); Société Le Nickel (1880) (now Eramet); and Imétal (1962) (now Imerys). The Rothschilds financed the founding of De Beers, as well as Cecil Rhodes on his expeditions in Africa and the creation of the colony of Rhodesia.
The Japanese government approached the London and Paris families for funding during the Russo-Japanese War. The London consortium's issue of Japanese war bonds would total £11.5 million (at 1907 currency rates).
From 1919 to 2004 the Rothschilds' Bank in London played a role as place of the gold fixing.
Napoleonic wars and Paris
Napoleon III had the goal of overtaking London to make Paris the premier financial center of the world, but the war in 1870 reduced the range of Parisian financial influence. Paris had emerged as an international center of finance in the mid-19th century second only to London. It had a strong national bank and numerous aggressive private banks that financed projects all across Europe and the expanding French Empire.
One key development was setting up one of the main branches of the Rothschild family. In 1812, James Mayer Rothschild arrived in Paris from Frankfurt, and set up the bank "De Rothschild Frères". This bank funded Napoleon's return from Elba and became one of the leading banks in European finance. The Rothschild banking family of France funded France's major wars and colonial expansion. The Banque de France, founded in 1796 helped resolve the financial crisis of 1848 and emerged as a powerful central bank. The Comptoir National d'Escompte de Paris (CNEP) was established during the financial crisis and the republican revolution of 1848. Its innovations included both private and public sources in funding large projects, and the creation of a network of local offices to reach a much larger pool of depositors.
Building societies
Building societies were established as financial institutions owned by their members as mutual organizations. The origins of the building society as an institution lie in late-18th century Birmingham—a town which was undergoing rapid economic and physical expansion driven by a multiplicity of small metalworking firms, whose many highly skilled and prosperous owners readily invested in property.
Many of the early building societies were based in taverns or coffeehouses, which had become the focus for a network of clubs and societies for co-operation and the exchange of ideas among Birmingham's highly active citizenry as part of the movement known as the Midlands Enlightenment. The first building society to be established was Ketley's Building Society, founded by Richard Ketley, the landlord of the Golden Cross inn, in 1775.
Members of Ketley's society paid a monthly subscription to a central pool of funds which was used to finance the building of houses for members, which in turn acted as collateral to attract further funding to the society, enabling further construction. The first outside the English Midlands was established in Leeds in 1785.
Mutual savings bank
Mutual savings banks also emerged at that time, as financial institutions chartered by government, without capital stock, and owned by their members who subscribe to common funds. The institution most frequently identified as the first modern savings bank was the "Savings and Friendly Society" organized by the Reverend Henry Duncan in 1810, in Ruthwell, Scotland. Rev. Duncan established the small bank in order to encourage his working class congregation to develop thrift.
Another precursor to the modern savings bank originated in Germany, with Franz Hermann Schulze-Delitzsch and Friedrich Wilhelm Raiffeisen who developed cooperative banking models that led on to the credit union movement. The traditional banks had viewed poor and rural communities as unbankable because of very small, seasonal flows of cash and very limited human resources. In the history of credit unions the concepts of cooperative banking spread through northern Europe and onto the US at the turn of the 20th century under a wide range of different names.
Postal savings system
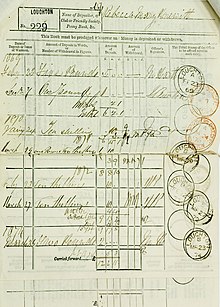
To provide depositors who did not have access to banks a safe, convenient method to save money and to promote saving among the poor, the postal savings system was introduced in Great Britain in 1861. It was vigorously supported by William Ewart Gladstone, then Chancellor of the Exchequer, who saw it as a cheap way to finance the public debt. At the time, banks were mainly in the cities and largely catered to wealthy customers. Rural citizens and the poor had no choice but to keep their funds at home or on their persons. The original Post Office Savings Bank was limited to deposits of £30 a year with a maximum balance of £150. Interest was paid at the rate of two and one-half percent per year on whole pounds in the account.
Similar institutions were created in a number of different countries in Europe, North America, and Japan. One example was in 1881 the Dutch government created the Rijkspostspaarbank (State post savings bank), a postal savings system to encourage workers to start saving. Four decades later they added the Postcheque and Girodienst services allowing working families to make payments via post offices in the Netherlands.
20th century
The first decade of the 20th century saw the Panic of 1907 in the US, which led to numerous runs on banks and became known as the bankers panic.
Great Depression
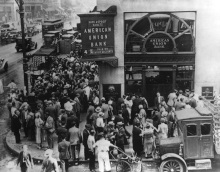
During the Crash of 1929 preceding the Great Depression, margin requirements were only 10%. Brokerage firms, in other words, would lend $9 for every $1 an investor had deposited. When the market fell, brokers called in these loans, which could not be paid back. Banks began to fail as debtors defaulted on debt and depositors attempted to withdraw their deposits en masse, triggering multiple bank runs. Government guarantees and Federal Reserve banking regulations to prevent such panics were ineffective or not used. Bank failures led to the loss of billions of dollars in assets. Outstanding debts became heavier, because prices and incomes fell by 20–50% but the debts remained at the same dollar amount. After the panic of 1929, and during the first 10 months of 1930, 744 US banks failed. By April 1933, around $7 billion in deposits had been frozen in failed banks or those left unlicensed after the March Bank Holiday.
Bank failures snowballed as desperate bankers called in loans that borrowers did not have time or money to repay. With future profits looking poor, capital investment and construction slowed or completely ceased. In the face of bad loans and worsening future prospects, the surviving banks became even more conservative in their lending. Banks built up their capital reserves and made fewer loans, which intensified deflationary pressures. A vicious cycle developed and the downward spiral accelerated. In all, over 9,000 banks failed during the 1930s.
In response, many countries significantly increased financial regulation. The U.S. established the Securities and Exchange Commission in 1933, and passed the Glass–Steagall Act, which separated investment banking and commercial banking. This was to avoid more risky investment banking activities from ever again causing commercial bank failures.
World Bank and the development of payment technology
This was also a time of increasing use of technology in retail banking. In 1959, banks agreed on a standard for machine readable characters (MICR) that was patented in the United States for use with cheques, which led to the first automated reader-sorter machines. In the 1960s, the first Automated Teller Machines (ATM) or Cash machines were developed and first machines started to appear by the end of the decade. Banks started to become heavy investors in computer technology to automate much of the manual processing, which began a shift by banks from large clerical staffs to new automated systems. By the 1970s the first payment systems started to develop that would lead to electronic payment systems for both international and domestic payments. The international SWIFT payment network was established in 1973 and domestic payment systems were developed around the world by banks working together with governments.
Deregulation and globalization
Global banking and capital market services proliferated during the 1980s after deregulation of financial markets in a number of countries. The 1986 'Big Bang' in London allowing banks to access capital markets in new ways, which led to significant changes to the way banks operated and accessed capital. It also started a trend where retail banks started to acquire investment banks and stock brokers creating universal banks that offered a wide range of banking services. The trend also spread to the US after much of the Glass–Steagall Act was repealed in 1999 (during the Clinton Administration), this saw US retail banks embark on big rounds of mergers and acquisitions and also engage in investment banking activities.
Financial services continued to grow through the 1980s and 1990s as a result of a great increase in demand from companies, governments, and financial institutions, but also because financial market conditions were buoyant and, on the whole, bullish. Interest rates in the United States declined from about 15% for two-year U.S. Treasury notes to about 5% during the 20-year period, and financial assets grew then at a rate approximately twice the rate of the world economy.
This period saw a significant internationalization of financial markets. The increase of U.S. Foreign investments from Japan not only provided the funds to corporations in the U.S., but also helped finance the federal government.
The dominance of U.S. financial markets was disappearing and there was an increasing interest in foreign stocks. The extraordinary growth of foreign financial markets results from both large increases in the pool of savings in foreign countries, such as Japan, and, especially, the deregulation of foreign financial markets, which enabled them to expand their activities. Thus, American corporations and banks started seeking investment opportunities abroad, prompting the development in the U.S. of mutual funds specializing in trading in foreign stock markets.
Such growing internationalization and opportunity in financial services changed the competitive landscape, as now many banks would demonstrate a preference for the "universal banking" model prevalent in Europe. Universal banks are free to engage in all forms of financial services, make investments in client companies, and function as much as possible as a "one-stop" supplier of both retail and wholesale financial services.
21st century
The early 2000s were marked by consolidation of existing banks and entrance into the market of other financial intermediaries: non-bank financial institution. Large corporate players were beginning to find their way into the financial service community, offering competition to established banks. The main services offered included insurance, pension, mutual, money market and hedge funds, loans and credits and securities. Indeed, by the end of 2001 the market capitalisation of the world's 15 largest financial services providers included four non-banks.
The first decade of the 21st century saw the culmination of the technical innovation in banking over the previous 30 years and saw a major shift away from traditional banking to internet banking. Starting in 2015 developments such as open banking made it easier for third parties to access bank transaction data and introduced standard API and security models.
The process of financial innovation also advanced enormously in the first few decades of the 21st century, increasing the importance and profitability of nonbank finance. Such profitability priorly restricted to the non-banking industry, has prompted the Office of the Comptroller of the Currency (OCC) to encourage banks to explore other financial instruments, diversifying banks' business as well as improving banking economic health. Hence, as the distinct financial instruments are being explored and adopted by both the banking and non-banking industries, the distinction between different financial institutions is gradually vanishing. For example, in 2020, the OCC muddled the distinction between traditional banking and the cryptocurrency ecosystem when it published a number of interpretive letters clarifying national banks' ability to custody cryptocurrency and provide banking services to cryptocurrency companies, as well as use blockchain innovations like stablecoins as settlement infrastructure. In addition, in 2021, the OCC granted its first federal banking charter to Anchorage Digital, a digital asset platform for institutions.
2007–2008 financial crisis
The financial crisis of 2007–2008 caused significant stress on banks around the world. The failure of a large number of major banks resulted in government bail-outs. The collapse and fire sale of Bear Stearns to JPMorgan Chase in March 2008 and the collapse of Lehman Brothers in September that same year led to a credit crunch and global banking crises. In response governments around the world bailed-out, nationalised or arranged fire sales for a large number of major banks. Starting with the Irish government on 29 September 2008, governments around the world provided wholesale guarantees to underwriting banks to avoid panic of systemic failure to the whole banking system. These events spawned the term 'too big to fail' and resulted in a lot of discussion about the moral hazard of these actions.


