Search This Blog

Sunday, April 14, 2024

Natural gas prices

From Wikipedia, the free encyclopedia
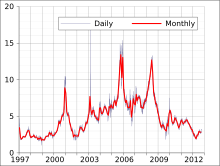
Natural gas prices 2000 - May 23, 2022
Comparison of natural gas prices in Japan, United Kingdom, and United States, 2007-2011
Natural gas prices at the Henry Hub in US Dollars per million Btu for the 2000-2010 decade.
Price per million BTU of oil and natural gas in the US, 1998-2015

Natural gas prices, as with other commodity prices, are mainly driven by supply and demand fundamentals. However, natural gas prices may also be linked to the price of crude oil and petroleum products, especially in continental Europe. Natural gas prices in the US had historically followed oil prices, but in the recent years, it has decoupled from oil and is now trending somewhat with coal prices.

The price as at 20 January 2022, on the U.S. Henry Hub index, is US$3.87/MMBtu ($13.2/MWh). The highest peak (weekly price) was US$14.49/MMBtu ($49.4/MWh) in January 2005.

The 2012 surge in fracking oil and gas in the U.S. resulted in lower gas prices in the U.S. This has led to discussions in Asian oil-linked gas markets to import gas based on the Henry Hub index, which was, until very recently, the most widely used reference for US natural gas prices.

Depending on the marketplace, the price of natural gas is often expressed in currency units per volume or currency units per energy content. For example, US dollars or other currency per million British thermal units, thousand cubic feet, or 1,000 cubic meters. Note that, for natural gas price comparisons$, per million Btu multiplied by 1.025 = $ per Mcf of pipeline-quality gas, which is what is delivered to consumers. For rough comparisons, one million Btu is approximately equal to a thousand cubic feet of natural gas. Pipeline-quality gas has an energy value slightly higher than that of pure methane, which has 10.47 kilowatt-hours per cubic metre (1,012 British thermal units per cubic foot). Natural gas as it comes out of the ground is most often predominantly methane, but may have a wide range of energy values, from much lower (due to dilution by non-hydrocarbon gases) to much higher (due to the presence of ethane, propane, and heavier compounds) than standard pipeline-quality gas.

U.S. market mechanisms

The natural gas market in the United States is split between the financial (futures) market, based on the NYMEX futures contract, and the physical market, the price paid for actual deliveries of natural gas and individual delivery points around the United States. Market mechanisms in Europe and other parts of the world are similar, but not as well developed or complex as in the United States.

Futures market

The standardized NYMEX natural gas futures contract is for delivery of 10,000 million Btu of energy (approximately 10,000,000 cu ft or 280,000 m3 of gas) at Henry Hub in Louisiana over a given delivery month consisting of a varying number of days. As a coarse approximation, 1000 cu ft of natural gas ≈ 1 million Btu ≈ 1 GJ. Monthly contracts expire 3–5 days in advance of the first day of the delivery month, at which points traders may either settle their positions financially with other traders in the market (if they have not done so already) or choose to "go physical" and accept delivery of physical natural gas (which is actually quite rare in the financial market).

Most financial transactions for natural gas actually take place off exchange in the over-the-counter (OTC) markets using "look-alike" contracts that match the general terms and characteristics of the NYMEX futures contract and settle against the final NYMEX contract value, but that are not subject to the regulations and market rules required on the actual exchange.

It is also important to note that nearly all participants in the financial gas market, whether on or off exchange, participate solely as a financial exercise in order to profit from the net cash flows that occur when financial contracts are settled among counterparties at the expiration of a trading contract. This practice allows for the hedging of financial exposure to transactions in the physical market by allowing physical suppliers and users of natural gas to net their gains in the financial market against the cost of their physical transactions that will occur later on. It also allows individuals and organizations with no need or exposure to large quantities of physical natural gas to participate in the natural gas market for the sole purpose of gaining from trading activities.

Physical market

Generally speaking, physical prices at the beginning of any calendar month at any particular delivery location are based on the final settled forward financial price for a given delivery period, plus the settled "basis" value for that location (see below). Once a forward contract period has expired, gas is then traded daily in a "day ahead market" wherein prices for any particular day (or occasional 2-3-day period when weekends and holidays are involved) are determined on the preceding day by traders using localized supply and demand conditions, in particular weather forecasts, at a particular delivery location. The average of all of the individual daily markets in a given month is then referred to as the "index" price for that month at that particular location, and it is not uncommon for the index price for a particular month to vary greatly from the settled futures price (plus basis) from a month earlier.

Many market participants, especially those transacting in gas at the wellhead stage, then add or subtract a small amount to the nearest physical market price to arrive at their ultimate final transaction price.

Once a particular day's gas obligations are finalized in the day-ahead market, traders (or more commonly lower-level personnel in the organization known as, "schedulers") will work together with counterparties and pipeline representatives to "schedule" the flows of gas into ("injections") and out of ("withdrawals") individual pipelines and meters. Because, in general, injections must equal withdrawals (i.e. the net volume injected and withdrawn on the pipeline should equal zero), pipeline scheduling and regulations are a major driver of trading activities, and quite often the financial penalties inflicted by pipelines onto shippers who violate their terms of service are well in excess of losses a trader may otherwise incur in the market correcting the problem.

Basis market

Because market conditions vary between Henry Hub and the roughly 40 or so physical trading locations around United States, financial traders also usually transact simultaneously in financial "basis" contracts intended to approximate these differences in geography and local market conditions. The rules around these contracts - and the conditions under which they are traded - are nearly identical to those for the underlying gas futures contract.

Derivatives and market instruments

Because the U.S. natural gas market is so large and well developed and has many independent parts, it enables many market participants to transact under complex structures and to use market instruments that are not otherwise available in a simple commodity market where the only transactions available are to purchase or sell the underlying product. For instance, options and other derivative transactions are very common, especially in the OTC market, as are "swap" transactions where participants exchange rights to future cash flows based on underlying index prices or delivery obligations or time periods. Participants use these tools to further hedge their financial exposure to the underlying price of natural gas.

Natural gas demand

The demand for natural gas is mainly driven by the following factors:

  • Weather
  • Demographics
  • Economic growth
  • Price increases, and poverty
  • Fuel competition
  • Storage
  • Exports

Weather

Weather conditions can significantly affect natural gas demand and supply. Cold temperatures in the winter increase the demand for space heating with natural gas in commercial and residential buildings.

Natural gas demand usually peaks during the coldest months of the year (December–February) and is lowest during the "shoulder" months (May–June and September–October). During the warmest summer months (July–August), demand increases again. Due to the shift in population in the United States toward the sun belt, summer demand for natural gas is rising faster than winter demand.

Temperature effects are measured in terms of 'heating degree days' (HDD) during the winter, and 'cooling degree days' (CDD) during the summer. HDDs are calculated by subtracting the average temperature for a day (in degrees Fahrenheit) from 65 °F (18 °C). Thus, if the average temperature for a day is 50 °F (10 °C), there are 15 HDDs. If the average temperature is 65 °F, HDD is zero.

Cooling degree days are also measured by the difference between the average temperature (in degrees Fahrenheit) and 65 °F. Thus, if the average temperature is 80 °F (27 °C), there are 15 CDDs. If the average temperature is 65 °F, CDD is zero.

Hurricanes can affect both the supply of and demand for natural gas. For example, as hurricanes approach the Gulf of Mexico, offshore natural gas platforms are shut down as workers evacuate, thereby shutting in production. In addition, hurricanes can also cause severe destruction to offshore (and onshore) production facilities. For example, Hurricane Katrina (2005) resulted in massive shut-ins of natural gas production.

Hurricane damage can also reduce natural gas demand. The destruction of power lines interrupting electricity produced by natural gas can result in significant reduction in demand for a given area (e.g., Florida).

Demographics

Changing demographics also affects the demand for natural gas, especially for core residential customers. In the US for instance, recent demographic trends indicate an increased population movement to the Southern and Western states. These areas are generally characterized by warmer weather, thus we could expect a decrease in demand for heating in the winter, but an increase in demand for cooling in the summer. As electricity currently supplies most of the cooling energy requirements, and natural gas supplies most of the energy used for heating, population movement may decrease the demand for natural gas for these customers. However, as more power plants are fueled by natural gas, natural gas demand could in fact increase.

Economic growth

The state of the economy can have a considerable effect on the demand for natural gas in the short term. This is particularly true for industrial and to a lesser extent the commercial customers. When the economy is booming, output from the industrial sectors generally increases. On the other hand, when the economy is experiencing a recession, output from industrial sectors drops. These fluctuations in industrial output accompanying the economy affects the amount of natural gas needed by these industrial users. For instance, during the economic recession of 2001, U.S. natural gas consumption by the industrial sector fell by 6 percent.

Price increases, and poverty

Tariff increases and levels of household income also influence the demand for natural gas. A 2016 study assesses the expected poverty and distributional effects of a natural gas price reform – in the context of Armenia; it estimates that a significant tariff increase of about 40% contributed to an estimated 8% of households to substitute natural gas mainly with wood as their source of heating - and it also pushed an estimated 2.8% of households into poverty (i.e. below the national poverty line). This study also outlines the methodological and statistical assumptions and constraints that arise in estimating causal effects of energy reforms on household demand and poverty.

Fuel competition

Supply and demand dynamics in the marketplace determine the short term price for natural gas. However, this can work in reverse as well. The price of natural gas can, for certain consumers, affect its demand. This is particularly true for those consumers who have the ability to switch the fuel which they consume. In general the core customers (residential and commercial) do not have this ability, however, a number of industrial and electric generation consumers have the capacity to switch between fuels. For instance, when natural gas prices are extremely high, electric generators may switch from using natural gas to using cheaper coal or fuel oil. This fuel switching then leads to a decrease for the demand of natural gas, which usually tends to drop its price.

Storage

North American natural gas injections (positive) represent additional demand and compete with alternative uses such as gas for heating or for power generation. Natural gas storage levels significantly affect the commodity's price. When the storage levels are low, a signal is being sent to the market indicating that there is a smaller supply cushion and prices will be rising. On the other hand, when storage levels are high, this sends a signal to the market that there is greater supply flexibility and prices will tend to drop.

Exports

Japan / Korea PLATTS natural gas price

Exports are another source of demand. In North America, gas is exported within its forming countries, Canada, the US and Mexico as well as abroad to countries such as Japan.

Natural gas supply

The supply for natural gas is mainly driven by the following factors:

  • Pipeline capacity
  • Storage
  • Gas drilling rates
  • Natural phenomena
  • Technical issues
  • Imports
  • Transportation Wholesale Rates

Pipeline capacity

The ability to transport natural gas from the well heads of the producing regions to the consuming regions affects the availability of supply in the marketplace. The interstate and intrastate pipeline infrastructure has limited capacity and can only transport so much natural gas at any one time. This has the effect of limiting the maximum amount of natural gas that can reach the market. The current pipeline infrastructure is quite developed, with the EIA estimating that the daily delivery capacity of the grid is 119×109 cu ft (3.4×10⁹ m3). However, natural gas pipeline companies should continue to expand the pipeline infrastructure in order to meet growing future demand. The coming addition of the Canadian Pipeline looks to provide additional resources for the North American populace.

Storage

As natural gas injections (positive) represent additional demand, withdrawals (negative) represent an additional source of supply which can be accessed quickly. The more storage banks like shale deposits used give more cushion for the natural gas markets.

Gas drilling rates

The amount of natural gas produced both from associated and non-associated sources can be controlled to some extent by the producers. The drilling rates and gas prices form a feedback loop. When supply is low relative to demand, prices rise; this gives a market signal to the producer to increase the number of rigs drilling for natural gas. The increased supply will then lead to a decrease in the price.

Natural phenomena

Natural phenomena can significantly affect natural gas production and thus supply. Hurricanes, for example, can affect the offshore production and exploitation of natural gas. This is because safety requirements may mandate the temporary shut down of offshore production platforms. Tornadoes can have a similar effect on onshore production facilities.

Technical Issues

Equipment malfunction, although not frequent, could temporarily disrupt the flow across a given pipeline at an important market center. This would ultimately decrease the supply available in that market. On the other hand, technical developments in engineering methods can lead to more abundant supply.

Imports

U.S. Natural Gas Marketed Production (cubic feet) since 1900 US EIA

Imports are a source of supply. In North America, gas is imported from several countries, Canada and the US as well as abroad in the form of LNG from countries such as Trinidad, Algeria and Nigeria.

Trends in natural gas prices

The chart shows a 75-year history of annual United States natural gas production and average wellhead prices from 1930 through 2005. Prices paid by consumers were increased above those levels by processing and distribution costs. Production is shown in billions of cubic meters per year, and average wellhead pricing is shown in United States dollars per thousand cubic meters, adjusted to spring, 2006, by the U.S. Consumer Price Index.

Through the 1960s the U.S. was self-sufficient in natural gas and wasted large parts of its withdrawals by venting and flaring. Gas flares were common sights in oilfields and at refineries. U.S. natural gas prices were relatively stable at around (2006 US) $30/Mcm in both the 1930s and the 1960s. Prices reached a low of around (2006 US) $17/Mcm in the late 1940s, when more than 20 percent of the natural gas being withdrawn from U.S. reserves was vented or flared.

Beginning in 1954, the Federal Power Commission regulated the price of US natural gas transported across state lines. The commission set the price of gas below the market rate, resulting in price distortions. The low prices encouraged consumption and discouraged production. By the 1970s, there were shortages of price-regulated interstate gas, while unregulated gas within the gas-producing states (intrastate gas) was plentiful, but more expensive. By 1975, nearly half the marketed gas in the US was sold to the intrastate market, resulting in shortages during 1976 and 1977 in the Midwest that caused factories and schools to close temporarily for lack of natural gas. The federal government progressively deregulated the price of natural gas starting in 1978, and ending with complete federal price deregulation in 1993.

While supply interruptions have caused repeated spikes in pricing since 1990, longer range price trends respond to limitations in resources and their rates of development. As of 2006 the U.S. Interior Department estimated that the Outer Continental Shelf of the United States held more than 15 trillion cubic meters of recoverable natural gas, equivalent to about 25 years of domestic consumption at present rates. Total U.S. natural gas reserves were then estimated at 30 to 50 trillion cubic meters, or about 40 to 70 years consumption. The new technologies of hydraulic fracturing and horizontal drilling have increased these estimates of recoverable reserves to many hundreds of trillion cubic feet. Hydraulic fracturing has reduced the Henry Hub spot price of natural gas considerably since 2008. The increased shale gas production leads to a shift of supply away from the south to the northeast and midwest of the country. A recent study found that, on average, natural gas prices have gone down by more than 30% in counties above shale deposits compared to the rest of the US, highlighting that natural gas markets have become less integrated due to pipeline capacity constraints.

Natural gas prices in Europe

Natural gas prices in Europe and United States
  National Balancing Point NBP (UK) natural gas prices
  Europe TTF natural gas prices
  United States Henry Hub natural gas prices

Prices of natural gas for end-consumers vary greatly throughout Europe. One of the main objectives of the projected single EU energy market is a common pricing structure for gas products. A recent study suggests that the expansion of shale gas production in the U.S. has caused prices to drop relative to other countries, especially Europe and Asia, leaving natural gas in the U.S. cheaper by a factor of three.[26] It is expected that the TTIP trade deal between the U.S. and Europe opens up access to cheap American natural gas, which allow Europe to diversify its supply base, but may threaten the Renewable Energy transition.

Currently, Europe's main natural gas supplier is Russia. Major pipelines pass through Ukraine and there have been several disputes on the supply and transition prices between Ukraine and Russia.

In September 2013, it was reported that multiple factors have conspired to cause Europe as a whole to decrease its use of natural gas and make more use of coal. The report also contains updated price trends.

In September 2021, gas prices in Europe reached all-time highs, following a collapse of wind-based power generation on account of low winds. In December 2021, they reached $2000 for 1000 m3 for the first time, corresponding to €172.52/MWh (€50.56/MMBtu) on the TTF hub in the Netherlands according to the London ICE.

Natural gas prices in South America

In South America, the second largest supplier of natural gas is Bolivia. The price which Bolivia is paid for its natural gas is roughly US$3.25 per million British thermal units ($11.1/MWh) to Brazil and $3.18 per million British thermal units ($10.9/MWh) to Argentina. Other sources state that Brazil pays between $3.15 to $3.60 per million British thermal units ($10.7 to $12.3/MWh), not including $1.50 per million British thermal units ($5.1/MWh) in Petrobras extraction and transportation costs. According to Le Monde, Brazil and Argentina pay US$2 per thousand cubic feet.

Long Walk of the Navajo

From Wikipedia, the free encyclopedia
https://en.wikipedia.org/wiki/Long_Walk_of_the_Navajo
 
Long Walk of the Navajo
Part of the Navajo Wars
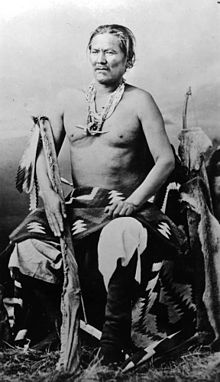
Navajo people photographed during the Long Walk
LocationSouthwestern United States
Attack type
Forced displacement
DeathsAt least 2,500
VictimsNavajo people
PerpetratorsU.S. Federal Government, U.S. Army
MotiveSettlers acquisition of Navajo lands and forced cultural assimilation of Navajo people

The Long Walk of the Navajo, also called the Long Walk to Bosque Redondo (Spanish: larga caminata del navajo), was the 1864 deportation and ethnic cleansing of the Navajo people by the United States federal government and the United States army. Navajos were forced to walk from their land in western New Mexico Territory (modern-day Arizona) to Bosque Redondo in eastern New Mexico. Some 53 different forced marches occurred between August 1864 and the end of 1866. Some anthropologists claim that the "collective trauma of the Long Walk...is critical to contemporary Navajos' sense of identity as a people".

Background

Map of the Long Walk

The traditional Navajo homeland spans from Arizona through western New Mexico. Navajo built houses, planted crops, and raised livestock there. Groups or bands raided and traded with each other, making and breaking treaties. This included interactions between the Navajo, Spanish, Mexican, Pueblos, Apache, Comanche, Ute, and later American settlers. Any of them could be victims of these conflicts and also instigate conflicts to pursue their interests.

Hostilities escalated between American settlers and Navajos following the scalping of respected Navajo leader Narbona in 1849. In August 1851, Colonel Edwin Vose Sumner established Fort Defiance for the U.S. government (near present-day Window Rock, Arizona) and Fort Wingate (originally Fort Fauntleroy near Gallup, New Mexico). Prior to the Long Walk, treaties were signed in 1849, 1858, and 1861.

Navajo–Army conflicts

Manuelito, studio portrait, c. 1897
Barboncito, c. 1865

Friction between invading American settlers and Navajo groups was widespread between 1846 and 1863. Manuelito and Barboncito reminded the Navajo that the Army was sending troops to wage war, that it had flogged a Navajo messenger, and that it opened fire on tribal headsman Agua Chiquito, during talks for peace. They argued that the army had refused to bring in feed for their animals at Ft. Defiance, took over the prime grazing land, and killed Manuelito's livestock there. On April 30, 1860, Manuelito and Barboncito with 1,000 Navajo warriors attacked the fort and almost took control.

Truces and treaties committed the Army to protect the Navajo. However, the Army allowed other Native American tribes and Mexicans to steal livestock and enslave Navajos. A truce was signed on February 15, 1861. They were again promised protection, but as part of the truce, two of the Navajo's four sacred mountains were taken from them, as well as about one-third of their traditional land. In March, a company of 52 citizens led by Jose Manuel Sanchez drove off a bunch of Navajo horses, but Captain Wingate followed the trail and recovered them for the Navajo, who had killed Sanchez. Another group of settlers ravaged Navajo rancherias in the vicinity of Beautiful Mountain. Also, during this time, a party of Mexicans and Pueblo Indians captured 12 Navajo in a raid, and three were brought in.

On August 9, 1861, Lt. Col. Manuel Antonio Chaves of the New Mexico Volunteer Militia took command of a garrison of three companies numbering 8 officers and 206 men at Fort Fauntleroy. Chaves was later accused of holding back supplies intended for the 1,000 or more Navajos who had remained close to the fort and was maintaining only lax discipline. Horse races began on September 10 and continued into the late afternoon of September 13. Col. Chaves permitted Post Sutler A. W. Kavanaugh to supply liquor to the Navajos. A dispute emerged about which horse won a race. A shot rang out, followed by a fusillade. Almost immediately 200 Navajo, well-armed and mounted, advanced toward the Guard, shooting at the men. They were fired upon by the soldiers and scattered, leaving 12 dead and forty prisoners. On hearing this, General Canby demanded a report from Chaves, who did not comply. Canby sent Captain Andrew W. Evans to the fort, named Fort Lyon on September 25, who took command. Manuel Chaves, suspended from command, was confined to Albuquerque pending court-martial. (The charges were dismissed after two months.) In February 1861, Chaves took the field with 400 militia and ransacked Navajo land, without federal authority.

Civil War and Kit Carson

Undated photo of Carson from the Library of Congress

With Confederate troops moving into southern New Mexico, Canby sent Agent John Ward into Navajo lands to persuade any who might be friendly to move to a central encampment near the village of Cubero. In return they would be offered government protection. Ward was instructed to warn all Navajos who refused to come that they would be treated as enemies; many came. Evans was overseeing the abandonment of Fort Lyon and had been told that the new policy was that the Navajo had to be removed to settlements or pueblos, mentioning the region of the Little Colorado west of Zuni as possibly an ideal place. In November, some Navajo started raiding again. On December 1, Canby wrote to his superior in St. Louis that "recent occurrences in the Navajo country have so demoralized and broken up [the Navajo] nation that there is now no choice between their absolute extermination or their removal and colonization at points so remote...as to isolate them entirely from the inhabitants of the Territory. Aside from all considerations of humanity, the extermination of such a people will be the work of the greatest difficulty."

By 1862, the Union Army had pushed the Confederates down the Rio Grande. The United States government again determined to eliminate Navajo raiding and raids on the Navajo. James H. Carleton was ordered to relieve Canby as Commander for the New Mexico Military Department in September 1862. Carleton ordered Colonel Christopher "Kit" Carson to proceed to Navajo territory and to receive the Navajo surrender on July 20, 1863. When no Navajos showed up, Carson and another officer entered Navajo territory in an attempt to persuade Navajos to surrender and used a scorched earth policy to starve the Navajo out of their traditional homeland and force them to surrender. By early 1864 thousands of Navajo began surrendering. Some Navajos refused and scattered to Navajo Mountain, the Grand Canyon, the territory of the Chiricahua Apache, and to parts of modern day Utah.

The Long Walk

A U.S. soldier stands guard over Navajo people during the Long Walk.
Manuelito family at Bosque Redondo, Fort Sumner, NM. c. 1864

Major General James H. Carleton was assigned to the New Mexico Territory in the fall of 1862, it is then that he would subdue the Navajos of the region and force them on the long walk to Bosque Redondo. Upon being assigned the territory Carleton set boundaries in which the Navajos would not engage in any sort of conflict. They were prohibited from trespassing onto lands, raiding neighboring tribes, and engaging in warfare with both the Spaniards and European Americans. A majority of the Navajos were abiding by these requirements, but a band of Navajo freelancing raiding parties broke these rules, for which the entire tribe was penalized. In the eyes of Carleton, he was unsuccessful and enlisted outside resources for aid including famous mountain man Kit Carson.

Carson also enlisted neighboring tribes in aiding his campaign to capture as many Navajos as he could. One tribe that proved to be most useful was the Utes. The Utes were very knowledgeable of the lands of the Navajos and were very familiar with Navajo strongholds as well. Carson launched his full-scale assault on the Navajo population in January 1864. He destroyed everything in his path, eradicating the way of life of the Navajo people. Hogans were burned to the ground, livestock was killed off, and irrigated fields were destroyed. Navajos who surrendered were taken to Fort Canby and those who resisted were murdered. Some Navajos were able to escape Carson's campaign but were soon forced to surrender due to starvation and the freezing temperature of the winter months.

The "Long Walk" started at the beginning of spring 1864. Bands of Navajo led by the Army were relocated from their traditional lands in eastern Arizona Territory and western New Mexico Territory to Fort Sumner (in an area called the Bosque Redondo or Hwéeldi by the Navajo) in the Pecos River valley (Bosque Redondo is Spanish for "round forest"—in New Mexican Spanish a bosque means a river-bottom forest usually containing cottonwood trees). The march was very difficult and pushed many Navajos to their breaking point. Many began the walk exhausted and malnourished, others were not properly clothed and were not in the least prepared for such a long journey. They were also treated cruelly by the soldiers leading the march. They were never informed as to where they were going, why they were being relocated, or how long it would take to get there. One account passed through generations within the Navajos shows the attitude of the U.S. Army:

It was said that those ancestors were on the Long Walk with their daughter, who was pregnant and about to give birth [...] the daughter got tired and weak and couldn't keep up with the others or go further because of her condition. So my ancestors asked the Army to hold up for a while and to let the woman give birth, but the soldiers wouldn't do it. They forced my people to move on, saying that they were getting behind the others. The soldier told the parents that they had to leave their daughters behind. "Your daughter is not going to survive, anyway; sooner or later she is going to die," they said in their own language. "Go ahead," the daughter said to her parents, "things might come out all right with me," But the poor thing was mistaken, my grandparents used to say. Not long after they had moved on, they heard a gunshot from where they had been a short time ago.

At least 200 died during the 18-day, 300-mile (500-km) trek. Between 8,000 and 9,000 people were settled on an area of 40 square miles (104 km2), with a peak population of 9,022 by the spring of 1865.

Long Walk Trails

There were as many as 50 groups taking one of seven known routes. They each took a different path but were on the same trail. When returning to the Navajo lands, they reformed their group to become one; this group was ten miles (16 km) long. Some of these Navajos escaped and hid with Apaches that were running from Gen. Crook on what is known as Cimmaron Mesa southeast of present-day NM Highway 6 and I-40; later they relocated to Alamo Springs northwest of Magdalena, NM and are known as the Alamo Band of the Diné (Navajos). Nelson Anthony Field who had a trading post made a trip to DC to lobby for a reservation for this Band and it was granted. This Band is part Navajo and part Apache.

Slavery

The campaign to subdue the Navajo by the Army was supplemented by raids by New Mexican and Ute slavers who fell on isolated bands of Navajo, killing the men, taking the women and children captive, and capturing horses and livestock. During the army campaign the Ute scouts attached to the army unit engaged in this activity and left destruction of Navajo infrastructure to the main army unit. Following the surrender of the Navajo, the Utes continued to raid the Navajo as did New Mexican slavers. A large number of slaves were taken and sold throughout the region.

Bosque Redondo

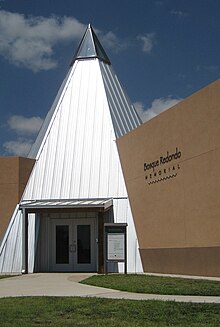
Bosque Redondo Memorial

Like some internment camps involving several tribes, the Bosque Redondo had serious problems. About 400 Mescalero Apaches were placed there before the Navajos. The Mescaleros and the Navajo had a long tradition of raiding each other; the two tribes had many disputes during their encampment. Furthermore, the initial plan was for around 5,000 people, nowhere near the 10,000 men, women, and children who eventually resided in the camp. Water and firewood were major issues from the start; the water was brackish, and the round grove of trees was quite small. Nature and humans both caused crop failures every year. The corn crop was infested with army worms and failed repeatedly. The Pecos River flooded and washed out the head gates of the irrigation system. In 1865 Navajo began leaving. By 1867 the remaining Navajo refused to plant a crop. Comanches raided them frequently, and they raided the Comanche, once stealing over 1,000 horses. The non-Indian settlers also suffered from the raiding parties who were trying to feed their starving people on the Bosque Redondo. There was inept management of the supplies purchased for the reservation. The army spent as much as $1.5 million a year to feed the Indians. In 1868 the experiment—meant to be the first Indian reservation west of Indian Territory—was abandoned.  A memorial site honoring those who were incarcerated at Bosque Redondo is located at Fort Sumner, New Mexico.

Treaty of Bosque Redondo

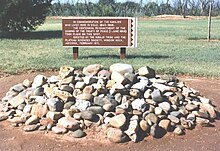
Marker where the Treaty of June 1, 1868, was signed

The Treaty of Bosque Redondo between the United States and many of the Navajo leaders was concluded at Fort Sumner on June 1, 1868. Some of the provisions included establishing a reservation, restrictions on raiding, a resident Indian Agent and agency, compulsory education for children, the supply of seeds, agricultural implements and other provisions, rights of the Navajos to be protected, establishment of railroads and forts, compensation to tribal members, and arrangements for the return of Navajos to the reservation established by the treaty. The Navajo agreed for ten years to send their children to school and the U.S. government agreed to establish schools with teachers for every thirty Navajo children. The U.S. government also promised for ten years to give to the Navajos annually: clothing, goods, and other raw materials, not exceeding the value of five dollars per person, that the Navajos could not manufacture for themselves.

The signers of the document were: W. T. Sherman (Lt. General), S. F. Tappan (Indian Peace Commissioner), Navajos Barboncito (Chief), Armijo, Delgado, Manuelito, Largo, Herrero, Chiquito, Muerte de Hombre, Hombro, Narbono, Narbono Segundo and Ganado Mucho. Those who attested the document included Theo H. Dodd (Indian Agent) and B. S. Roberts (General 3rd Cav).

Return and end of Long Walk

On June 18, 1868, the once-scattered bands of people who call themselves Diné, set off together on the return journey, the "Long Walk" home. This is one of the few instances where the U.S. government permitted a tribe to return to their traditional boundaries. The Navajo were granted 3.5 million acres (14,000 km2) of land inside their four sacred mountains. The Navajo also became a more cohesive tribe after the Long Walk and were able to successfully increase the size of their reservation since then, to over 16 million acres (70,000 km2).

After relating 20 pages of material concerning the Long Walk, Howard Gorman, age 73 at the time, concluded:

As I have said, our ancestors were taken captive and driven to Hwéeldi for no reason at all. They were harmless people, and, even to date, we are the same, holding no harm for anybody...Many Navajos who know our history and the story of Hwéeldi say the same.

— Navajo Stories of the Long Walk Period

Legacy

Long Walk Home, mural by Richard K. Yazzie, 2005

Health effects

Not all the Navajo were captured and forced to take the long walk. Geneticists believe that a genetic bottleneck developed among the small, isolated, uncaptured groups. This produced the consequence of otherwise rare genetic diseases, for example xeroderma pigmentosum, stemming from recessive genes achieving greater dominance. An alternative put forth by some Navajo is that the sudden rise of xeroderma pigmentosum is directly related to widespread contamination from uranium mining.

In art

Navajo artist Richard K. Yazzie created a mural entitled Long Walk Home for the city of Gallup, New Mexico. It is located at the intersection of Third and Hill streets. It is rendered in the four "sacred colors", black, white, blue and yellow.

In music

A famous song was composed by the Navajo when they were set free about their return to their homeland, Shí naashá (I am going).

In literature

A supposed remnant of the Long Walk from Bosque Redondo, a rug called Woven Sorrow, figures prominently as a valuable antique in the plot of The Shape Shifter by Tony Hillerman, published in 2006. Anne Hillerman mentioned the Long Walk in a subsequent novel in the series, Cave of Bones (2018).

The story of the forced relocation is the setting of the youth fiction novel The Girl Who Chased Away Sorrow, written in 1999 by Ann Turner.

Another novel depicting the Long Walk from Bosque Redondo is the Welsh novel I Ble'r aeth Haul y Bore? by Eurig Wyn. This Welsh language novel follows a number of characters (some historic, others created by the writer), and focuses not only on the Navajos, but also the Apache.

In the 1979 Stephen King novel The Long Walk (written under the pen name Richard Bachman) two Hopis are among one hundred teenage boys who participate in a competitive and voluntary death march which serves as a macabre annual spectacle in a totalitarian re-imagining of America.

Scott O'Dell's Newbury Award-winning book Sing Down the Moon (1970) depicts the forced migration of the Navajos to Bosque Redondo.

Sound

From Wikipedia, the free encyclopedia
https://en.wikipedia.org/wiki/Sound

In physics, sound is a vibration that propagates as an acoustic wave through a transmission medium such as a gas, liquid or solid. In human physiology and psychology, sound is the reception of such waves and their perception by the brain. Only acoustic waves that have frequencies lying between about 20 Hz and 20 kHz, the audio frequency range, elicit an auditory percept in humans. In air at atmospheric pressure, these represent sound waves with wavelengths of 17 meters (56 ft) to 1.7 centimeters (0.67 in). Sound waves above 20 kHz are known as ultrasound and are not audible to humans. Sound waves below 20 Hz are known as infrasound. Different animal species have varying hearing ranges.

Definition

Sound is defined as "(a) Oscillation in pressure, stress, particle displacement, particle velocity, etc., propagated in a medium with internal forces (e.g., elastic or viscous), or the superposition of such propagated oscillation. (b) Auditory sensation evoked by the oscillation described in (a)." Sound can be viewed as a wave motion in air or other elastic media. In this case, sound is a stimulus. Sound can also be viewed as an excitation of the hearing mechanism that results in the perception of sound. In this case, sound is a sensation.

Acoustics

Acoustics is the interdisciplinary science that deals with the study of mechanical waves in gasses, liquids, and solids including vibration, sound, ultrasound, and infrasound. A scientist who works in the field of acoustics is an acoustician, while someone working in the field of acoustical engineering may be called an acoustical engineer. An audio engineer, on the other hand, is concerned with the recording, manipulation, mixing, and reproduction of sound.

Applications of acoustics are found in almost all aspects of modern society, subdisciplines include aeroacoustics, audio signal processing, architectural acoustics, bioacoustics, electro-acoustics, environmental noise, musical acoustics, noise control, psychoacoustics, speech, ultrasound, underwater acoustics, and vibration.

Physics

Sound can propagate through a medium such as air, water and solids as longitudinal waves and also as a transverse wave in solids. The sound waves are generated by a sound source, such as the vibrating diaphragm of a stereo speaker. The sound source creates vibrations in the surrounding medium. As the source continues to vibrate the medium, the vibrations propagate away from the source at the speed of sound, thus forming the sound wave. At a fixed distance from the source, the pressure, velocity, and displacement of the medium vary in time. At an instant in time, the pressure, velocity, and displacement vary in space. The particles of the medium do not travel with the sound wave. This is intuitively obvious for a solid, and the same is true for liquids and gases (that is, the vibrations of particles in the gas or liquid transport the vibrations, while the average position of the particles over time does not change). During propagation, waves can be reflected, refracted, or attenuated by the medium.

The behavior of sound propagation is generally affected by three things:

  • A complex relationship between the density and pressure of the medium. This relationship, affected by temperature, determines the speed of sound within the medium.
  • Motion of the medium itself. If the medium is moving, this movement may increase or decrease the absolute speed of the sound wave depending on the direction of the movement. For example, sound moving through wind will have its speed of propagation increased by the speed of the wind if the sound and wind are moving in the same direction. If the sound and wind are moving in opposite directions, the speed of the sound wave will be decreased by the speed of the wind.
  • The viscosity of the medium. Medium viscosity determines the rate at which sound is attenuated. For many media, such as air or water, attenuation due to viscosity is negligible.

When sound is moving through a medium that does not have constant physical properties, it may be refracted (either dispersed or focused).

Spherical compression (longitudinal) waves

The mechanical vibrations that can be interpreted as sound can travel through all forms of matter: gases, liquids, solids, and plasmas. The matter that supports the sound is called the medium. Sound cannot travel through a vacuum.

Studies has shown that sound waves are able to carry a tiny amount of mass and is surrounded by a weak gravitational field.

Waves

Sound is transmitted through gases, plasma, and liquids as longitudinal waves, also called compression waves. It requires a medium to propagate. Through solids, however, it can be transmitted as both longitudinal waves and transverse waves. Longitudinal sound waves are waves of alternating pressure deviations from the equilibrium pressure, causing local regions of compression and rarefaction, while transverse waves (in solids) are waves of alternating shear stress at right angle to the direction of propagation.

Sound waves may be viewed using parabolic mirrors and objects that produce sound.

The energy carried by an oscillating sound wave converts back and forth between the potential energy of the extra compression (in case of longitudinal waves) or lateral displacement strain (in case of transverse waves) of the matter, and the kinetic energy of the displacement velocity of particles of the medium.

Longitudinal plane pressure pulse wave
Longitudinal plane wave
Transverse plane wave in linear polarization, i.e. oscillating only in the y-direction
Transverse plane wave Longitudinal and transverse plane wave
A 'pressure over time' graph of a 20 ms recording of a clarinet tone demonstrates the two fundamental elements of sound: Pressure and Time.
Sounds can be represented as a mixture of their component Sinusoidal waves of different frequencies. The bottom waves have higher frequencies than those above. The horizontal axis represents time.

Although there are many complexities relating to the transmission of sounds, at the point of reception (i.e. the ears), sound is readily dividable into two simple elements: pressure and time. These fundamental elements form the basis of all sound waves. They can be used to describe, in absolute terms, every sound we hear.

In order to understand the sound more fully, a complex wave such as the one shown in a blue background on the right of this text, is usually separated into its component parts, which are a combination of various sound wave frequencies (and noise).

Sound waves are often simplified to a description in terms of sinusoidal plane waves, which are characterized by these generic properties:

Sound that is perceptible by humans has frequencies from about 20 Hz to 20,000 Hz. In air at standard temperature and pressure, the corresponding wavelengths of sound waves range from 17 m (56 ft) to 17 mm (0.67 in). Sometimes speed and direction are combined as a velocity vector; wave number and direction are combined as a wave vector.

Transverse waves, also known as shear waves, have the additional property, polarization, which is not a characteristic of longitudinal sound waves.

Speed

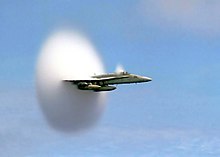
U.S. Navy F/A-18 approaching the speed of sound. The white halo is formed by condensed water droplets thought to result from a drop in air pressure around the aircraft (see Prandtl–Glauert singularity).

The speed of sound depends on the medium the waves pass through, and is a fundamental property of the material. The first significant effort towards measurement of the speed of sound was made by Isaac Newton. He believed the speed of sound in a particular substance was equal to the square root of the pressure acting on it divided by its density:

This was later proven wrong and the French mathematician Laplace corrected the formula by deducing that the phenomenon of sound travelling is not isothermal, as believed by Newton, but adiabatic. He added another factor to the equation—gamma—and multiplied by , thus coming up with the equation . Since , the final equation came up to be , which is also known as the Newton–Laplace equation. In this equation, K is the elastic bulk modulus, c is the velocity of sound, and is the density. Thus, the speed of sound is proportional to the square root of the ratio of the bulk modulus of the medium to its density.

Those physical properties and the speed of sound change with ambient conditions. For example, the speed of sound in gases depends on temperature. In 20 °C (68 °F) air at sea level, the speed of sound is approximately 343 m/s (1,230 km/h; 767 mph) using the formula v [m/s] = 331 + 0.6 T [°C]. The speed of sound is also slightly sensitive, being subject to a second-order anharmonic effect, to the sound amplitude, which means there are non-linear propagation effects, such as the production of harmonics and mixed tones not present in the original sound (see parametric array). If relativistic effects are important, the speed of sound is calculated from the relativistic Euler equations.

In fresh water the speed of sound is approximately 1,482 m/s (5,335 km/h; 3,315 mph). In steel, the speed of sound is about 5,960 m/s (21,460 km/h; 13,330 mph). Sound moves the fastest in solid atomic hydrogen at about 36,000 m/s (129,600 km/h; 80,530 mph).

Sound pressure level

Sound measurements
Characteristic
Symbols
 Sound pressure p, SPL, LPA
 Particle velocity v, SVL
 Particle displacement δ
 Sound intensity I, SIL
 Sound power P, SWL, LWA
 Sound energy W
 Sound energy density w
 Sound exposure E, SEL
 Acoustic impedance Z
 Audio frequency AF
 Transmission loss TL

Sound pressure is the difference, in a given medium, between average local pressure and the pressure in the sound wave. A square of this difference (i.e., a square of the deviation from the equilibrium pressure) is usually averaged over time and/or space, and a square root of this average provides a root mean square (RMS) value. For example, 1 Pa RMS sound pressure (94 dBSPL) in atmospheric air implies that the actual pressure in the sound wave oscillates between (1 atm Pa) and (1 atm Pa), that is between 101323.6 and 101326.4 Pa. As the human ear can detect sounds with a wide range of amplitudes, sound pressure is often measured as a level on a logarithmic decibel scale. The sound pressure level (SPL) or Lp is defined as

where p is the root-mean-square sound pressure and is a reference sound pressure. Commonly used reference sound pressures, defined in the standard ANSI S1.1-1994, are 20 µPa in air and 1 µPa in water. Without a specified reference sound pressure, a value expressed in decibels cannot represent a sound pressure level.

Since the human ear does not have a flat spectral response, sound pressures are often frequency weighted so that the measured level matches perceived levels more closely. The International Electrotechnical Commission (IEC) has defined several weighting schemes. A-weighting attempts to match the response of the human ear to noise and A-weighted sound pressure levels are labeled dBA. C-weighting is used to measure peak levels.

Perception

A distinct use of the term sound from its use in physics is that in physiology and psychology, where the term refers to the subject of perception by the brain. The field of psychoacoustics is dedicated to such studies. Webster's dictionary defined sound as: "1. The sensation of hearing, that which is heard; specif.: a. Psychophysics. Sensation due to stimulation of the auditory nerves and auditory centers of the brain, usually by vibrations transmitted in a material medium, commonly air, affecting the organ of hearing. b. Physics. Vibrational energy which occasions such a sensation. Sound is propagated by progressive longitudinal vibratory disturbances (sound waves)." This means that the correct response to the question: "if a tree falls in the forest with no one to hear it fall, does it make a sound?" is "yes", and "no", dependent on whether being answered using the physical, or the psychophysical definition, respectively.

The physical reception of sound in any hearing organism is limited to a range of frequencies. Humans normally hear sound frequencies between approximately 20 Hz and 20,000 Hz (20 kHz), The upper limit decreases with age. Sometimes sound refers to only those vibrations with frequencies that are within the hearing range for humans or sometimes it relates to a particular animal. Other species have different ranges of hearing. For example, dogs can perceive vibrations higher than 20 kHz.

As a signal perceived by one of the major senses, sound is used by many species for detecting danger, navigation, predation, and communication. Earth's atmosphere, water, and virtually any physical phenomenon, such as fire, rain, wind, surf, or earthquake, produces (and is characterized by) its unique sounds. Many species, such as frogs, birds, marine and terrestrial mammals, have also developed special organs to produce sound. In some species, these produce song and speech. Furthermore, humans have developed culture and technology (such as music, telephone and radio) that allows them to generate, record, transmit, and broadcast sound.

Noise is a term often used to refer to an unwanted sound. In science and engineering, noise is an undesirable component that obscures a wanted signal. However, in sound perception it can often be used to identify the source of a sound and is an important component of timbre perception (see below).

Soundscape is the component of the acoustic environment that can be perceived by humans. The acoustic environment is the combination of all sounds (whether audible to humans or not) within a given area as modified by the environment and understood by people, in context of the surrounding environment.

There are, historically, six experimentally separable ways in which sound waves are analysed. They are: pitch, duration, loudness, timbre, sonic texture and spatial location. Some of these terms have a standardised definition (for instance in the ANSI Acoustical Terminology ANSI/ASA S1.1-2013). More recent approaches have also considered temporal envelope and temporal fine structure as perceptually relevant analyses.

Pitch

Figure 1. Pitch perception

Pitch is perceived as how "low" or "high" a sound is and represents the cyclic, repetitive nature of the vibrations that make up sound. For simple sounds, pitch relates to the frequency of the slowest vibration in the sound (called the fundamental harmonic). In the case of complex sounds, pitch perception can vary. Sometimes individuals identify different pitches for the same sound, based on their personal experience of particular sound patterns. Selection of a particular pitch is determined by pre-conscious examination of vibrations, including their frequencies and the balance between them. Specific attention is given to recognising potential harmonics. Every sound is placed on a pitch continuum from low to high. For example: white noise (random noise spread evenly across all frequencies) sounds higher in pitch than pink noise (random noise spread evenly across octaves) as white noise has more high frequency content. Figure 1 shows an example of pitch recognition. During the listening process, each sound is analysed for a repeating pattern (See Figure 1: orange arrows) and the results forwarded to the auditory cortex as a single pitch of a certain height (octave) and chroma (note name).

Duration

Figure 2. Duration perception

Duration is perceived as how "long" or "short" a sound is and relates to onset and offset signals created by nerve responses to sounds. The duration of a sound usually lasts from the time the sound is first noticed until the sound is identified as having changed or ceased. Sometimes this is not directly related to the physical duration of a sound. For example; in a noisy environment, gapped sounds (sounds that stop and start) can sound as if they are continuous because the offset messages are missed owing to disruptions from noises in the same general bandwidth. This can be of great benefit in understanding distorted messages such as radio signals that suffer from interference, as (owing to this effect) the message is heard as if it was continuous. Figure 2 gives an example of duration identification. When a new sound is noticed (see Figure 2, Green arrows), a sound onset message is sent to the auditory cortex. When the repeating pattern is missed, a sound offset messages is sent.

Loudness

Figure 3. Loudness perception

Loudness is perceived as how "loud" or "soft" a sound is and relates to the totalled number of auditory nerve stimulations over short cyclic time periods, most likely over the duration of theta wave cycles. This means that at short durations, a very short sound can sound softer than a longer sound even though they are presented at the same intensity level. Past around 200 ms this is no longer the case and the duration of the sound no longer affects the apparent loudness of the sound. Figure 3 gives an impression of how loudness information is summed over a period of about 200 ms before being sent to the auditory cortex. Louder signals create a greater 'push' on the Basilar membrane and thus stimulate more nerves, creating a stronger loudness signal. A more complex signal also creates more nerve firings and so sounds louder (for the same wave amplitude) than a simpler sound, such as a sine wave.

Timbre

Figure 4. Timbre perception

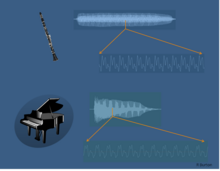
Timbre is perceived as the quality of different sounds (e.g. the thud of a fallen rock, the whir of a drill, the tone of a musical instrument or the quality of a voice) and represents the pre-conscious allocation of a sonic identity to a sound (e.g. "it's an oboe!"). This identity is based on information gained from frequency transients, noisiness, unsteadiness, perceived pitch and the spread and intensity of overtones in the sound over an extended time frame. The way a sound changes over time (see figure 4) provides most of the information for timbre identification. Even though a small section of the wave form from each instrument looks very similar (see the expanded sections indicated by the orange arrows in figure 4), differences in changes over time between the clarinet and the piano are evident in both loudness and harmonic content. Less noticeable are the different noises heard, such as air hisses for the clarinet and hammer strikes for the piano.

Texture

Sonic texture relates to the number of sound sources and the interaction between them. The word texture, in this context, relates to the cognitive separation of auditory objects. In music, texture is often referred to as the difference between unison, polyphony and homophony, but it can also relate (for example) to a busy cafe; a sound which might be referred to as cacophony.

Spatial location

Spatial location represents the cognitive placement of a sound in an environmental context; including the placement of a sound on both the horizontal and vertical plane, the distance from the sound source and the characteristics of the sonic environment. In a thick texture, it is possible to identify multiple sound sources using a combination of spatial location and timbre identification.

Frequency

Ultrasound

Approximate frequency ranges corresponding to ultrasound, with rough guide of some applications

Ultrasound is sound waves with frequencies higher than 20,000 Hz. Ultrasound is not different from audible sound in its physical properties, but cannot be heard by humans. Ultrasound devices operate with frequencies from 20 kHz up to several gigahertz.

Medical ultrasound is commonly used for diagnostics and treatment.

Infrasound

Infrasound is sound waves with frequencies lower than 20 Hz. Although sounds of such low frequency are too low for humans to hear as a pitch, these sound are heard as discrete pulses (like the 'popping' sound of an idling motorcycle). Whales, elephants and other animals can detect infrasound and use it to communicate. It can be used to detect volcanic eruptions and is used in some types of music.

Entropy (information theory)

From Wikipedia, the free encyclopedia https://en.wikipedia.org/wiki/Entropy_(information_theory) In info...