O2 build-up in the Earth's atmosphere. Red and green lines represent the range of the estimates while time is measured in billions of years ago (Ga).
Stage 1 (3.85–2.45 Ga): Practically no O2 in the atmosphere. The oceans were also largely anoxic with the possible exception of O2 gases in the shallow oceans.
Stage 2 (2.45–1.85 Ga): O2 produced, and rose to values of 0.02 and 0.04 atm, but absorbed in oceans and seabed rock.
Stage 3 (1.85–0.85 Ga): O2 starts to gas out of the oceans, but is absorbed by land surfaces. There was no significant change in terms of oxygen level.
Stages 4 and 5 (0.85–present): O2 sinks filled and the gas accumulates.[1]
The Great Oxygenation Event, the beginning of which is commonly known in scientific media as the Great Oxidation Event (GOE, also called the Oxygen Catastrophe, Oxygen Crisis, Oxygen Holocaust,[2] Oxygen Revolution, or Great Oxidation) was the biologically induced appearance of dioxygen (O2) in Earth's atmosphere.[3] Geological, isotopic, and chemical evidence suggest that this major environmental change happened around 2.45 billion years ago (2.45 Ga),[4] during the Siderian period, at the beginning of the Proterozoic eon. The causes of the event are not clear.[5] The current geochemical and biomarker evidence for the development of oxygenic photosynthesis before the Great Oxidation Event has been mostly inconclusive.[6]
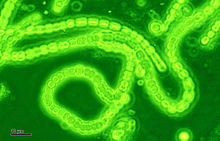
Oceanic cyanobacteria, which evolved into coordinated (but not multicellular or even colonial) macroscopic forms more than 2.3 billion years ago (approximately 200 million years before the GOE),[7] are believed to have become the first microbes to produce oxygen by photosynthesis.[8] Before the GOE, any free oxygen they produced was chemically captured by dissolved iron or organic matter. The GOE started when these oxygen sinks became saturated, at which point oxygen produced by the cyanobacteria was free to escape into the atmosphere.
Cyanobacteria: Responsible for the buildup of oxygen in the Earth's atmosphere
The increased production of oxygen set Earth's original atmosphere off balance.[9] Free oxygen is toxic to obligate anaerobic organisms, and the rising concentrations may have destroyed most such organisms at the time. Cyanobacteria were therefore responsible for one of the most significant mass extinctions in Earth's history. Besides marine cyanobacteria, there is also evidence of cyanobacteria on land.[citation needed]
A spike in chromium contained in ancient rock deposits formed underwater shows the accumulation had been washed off from the continental shelves. Chromium is not easily dissolved and its release from rocks would have required the presence of a powerful acid. One such acid, sulfuric acid (H2SO4), might have been created through bacterial reactions with pyrite.[10] Mats of oxygen-producing cyanobacteria can produce a thin layer, one or two millimeters thick, of oxygenated water in an otherwise anoxic environment even under thick ice, and before oxygen started accumulating in the atmosphere, these organisms would already be adapted to oxygen.[11] Additionally, the free oxygen would have reacted with atmospheric methane, a greenhouse gas, greatly reducing its concentration and triggering the Huronian glaciation, possibly the longest episode of glaciation in Earth's history and called snowball Earth.[12]
Eventually, the evolution of aerobic organisms that consumed oxygen established an equilibrium in its availability. Free oxygen has been an important constituent of the atmosphere ever since.[12]
Timing
The most widely accepted chronology of the Great Oxygenation Event suggests that free oxygen was first produced by prokaryotic and then later eukaryotic organisms that carried out photosynthesis more efficiently, producing oxygen as a waste product. These organisms lived long before the GOE,[13] perhaps as early as 3,400 million years ago.[14][15]Initially, the oxygen they produced would have quickly been removed from the atmosphere by the chemical weathering of reducing (oxidizable) minerals, most notably iron. This 'mass rusting' led to the deposition of iron(III) oxide in the form of banded-iron formations such as the sediments in Minnesota and Pilbara, Western Australia. The saturation of these mineral sinks, and the resulting persistence of oxygen in the atmosphere, led within 50 million years to the start of the GOE.[16] Oxygen could have accumulated very rapidly: at today's rates of photosynthesis (much greater than those in the Precambrian without land plants), modern atmospheric O2 levels could be produced in only 2,000 years.[17]
Another hypothesis is that oxygen producers did not evolve until a few million years before the major rise in atmospheric oxygen concentration.[18] This is based on a particular interpretation of a supposed oxygen indicator used in previous studies, the mass-independent fractionation of sulfur isotopes. This hypothesis would eliminate the need to explain a lag in time between the evolution of oxyphotosynthetic microbes and the rise in free oxygen.
In either case, oxygen did eventually accumulate in the atmosphere, with two major consequences.
Firstly, it oxidized atmospheric methane (a strong greenhouse gas) to carbon dioxide (a weaker one) and water. This decreased the greenhouse effect of the Earth's atmosphere, causing planetary cooling, and triggered the Huronian glaciation. Starting around 2.4 billion years ago, this lasted 300-400 million years, and may have been the longest ever snowball Earth episode.[18][19]
Secondly, the increased oxygen concentrations provided a new opportunity for biological diversification, as well as tremendous changes in the nature of chemical interactions between rocks, sand, clay, and other geological substrates and the Earth's air, oceans, and other surface waters. Despite the natural recycling of organic matter, life had remained energetically limited until the widespread availability of oxygen. This breakthrough in metabolic evolution greatly increased the free energy availabile to living organisms, with global environmental impacts. For example, mitochondria evolved after the GOE, giving organisms the energy to exploit new, more complex morphologies interacting in increasingly complex ecosystems.[20]
Timeline of glaciations, shown in blue.
Time lag theory
There may have been a gap of up to 900 million years between the start of photosynthetic oxygen production and the geologically rapid increase in atmospheric oxygen about 2.5–2.4 billion years ago. Several hypotheses propose to explain this time lag.Tectonic trigger
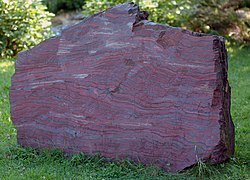
2.1 billion year old rock showing banded iron formation
The oxygen increase had to await tectonically driven changes in the Earth, including the appearance of shelf seas, where reduced organic carbon could reach the sediments and be buried.[21] The newly produced oxygen was first consumed in various chemical reactions in the oceans, primarily with iron. Evidence is found in older rocks that contain massive banded iron formations apparently laid down as this iron and oxygen first combined; most present-day iron ore lies in these deposits. Evidence suggests oxygen levels spiked each time smaller land masses collided to form a super-continent. Tectonic pressure thrust up mountain chains, which eroded to release nutrients into the ocean to feed photosynthetic cyanobacteria.[22]
Nickel famine
Early chemosynthetic organisms likely produced methane, an important trap for molecular oxygen, since methane readily oxidizes to carbon dioxide (CO2) and water in the presence of UV radiation. Modern methanogens require nickel as an enzyme cofactor. As the Earth's crust cooled and the supply of volcanic nickel dwindled, oxygen-producing algae began to out-perform methane producers, and the oxygen percentage of the atmosphere steadily increased.[23] From 2.7 to 2.4 billion years ago, the rate of deposition of nickel declined steadily from a level 400 times today's.[24]Bistability
Another hypothesis posits a model of the atmosphere that exhibits bistability: two steady states of oxygen concentration. The state of stable low oxygen conentration (0.02%) experiences a high rate of methane oxidation. If some event raises oxygen levels beyond a moderate threshold, the formation of an ozone layer shields UV rays and decreases methane oxidation, raising oxygen further to a stable state of 21% or more. The Great Oxygenation Event can then be understood as a transition from the lower to the upper steady states.[25]Hydrogen gas
Another theory credits the appearance of cyanobacteria with suppressing hydrogen gas and increasing oxygen.Some bacteria in the early oceans could separate water into hydrogen and oxygen. Under the Sun's rays, hydrogen molecules were incorporated into organic compounds, with oxygen as a by-product. If the hydrogen-heavy compounds were buried, it would have allowed oxygen to accumulate in the atmosphere.
However, in 2001 scientists realized that the hydrogen would instead escape into space through a process called methane photolysis, in which methane releases its hydrogen in a reaction with oxygen. This could explain why the early Earth stayed warm enough to sustain oxygen-producing lifeforms.[26]
Late evolution of oxy-photosynthesis theory
The oxygen indicator might have been misinterpreted. During the proposed lag era in the previous theory, there was a change in sediments from mass-independently fractionated (MIF) sulfur to mass-dependently fractionated (MDF) sulfur. This was assumed to show the appearance of oxygen in the atmosphere, since oxygen would have prevented the photolysis of sulfur dioxide, which causes MIF. However, the change from MIF to MDF of sulfur isotopes may instead have been caused by an increase in glacial weathering, or the homogenization of the marine sulfur pool as a result of an increased thermal gradient during the Huronian glaciation period (which in this interpretation was not caused by oxygenation).[18]Role in mineral diversification
The Great Oxygenation Event triggered an explosive growth in the diversity of minerals, with many elements occurring in one or more oxidized forms near the Earth's surface.[27] It is estimated that the GOE was directly responsible for more than 2,500 of the total of about 4,500 minerals found on Earth today. Most of these new minerals were formed as hydrated and oxidized forms due to dynamic mantle and crust processes.[28]
↓Great Oxygenation
↓End of Huronian glaciation
│
−2500
│
−2300
│
−2100
│
−1900
│
−1700
│
−1500
│
−1300
│
−1100
│
−900
│
−700
│
−500
│
−300
│
−100
Million years ago. Age of Earth = 4,560


![z=2\lambda e^{-\left(x-x_{e}\right)}{\text{; }}N_{n}=\left[{\frac {n!\left(2\lambda -2n-1\right)}{\Gamma (2\lambda -n)}}\right]^{\frac {1}{2}}](https://wikimedia.org/api/rest_v1/media/math/render/svg/b0077e5dc9ff7063341d3e12d5c318725936ad62)


![E(v)=h\nu _{0}(v+1/2)-{\frac {\left[h\nu _{0}(v+1/2)\right]^{2}}{4D_{e}}}](https://wikimedia.org/api/rest_v1/media/math/render/svg/4fbddb6948127356e8cdd74c1df8f30f0e72ad0b)


