Original link: https://wattsupwiththat.com/2019/01/21/co2-and-crops-nas-vs-science/?fbclid=IwAR1YNGwq2fH50IwpTsOmhjPAgCrZFl_9RMFDjMmlJLSwzwXPVFqS7Ll4mJk
One of the most pernicious examples of disinformation promoted by the Climate Industry is the claim that manmade climate change from CO2 emissions threatens agriculture and “food security.” That’s the exact opposite of the truth. CO2 is “plant fertilizer,” and hundreds of agricultural studies have shown that higher CO2 levels are dramatically beneficial for agriculture, to levels far above what we can ever hope for outdoors.
Most plants grow best with daytime atmospheric CO2 of at least about
1500 ppmv. That’s about what CO2 levels are thought to have averaged
during the Cretaceous. It’s 1090 ppmv higher than the current average outdoor level of about 410 ppmv.
In other words, most plants would grow best if CO2 levels were increased by more than eight times
the measly 130 ppmv by which mankind has managed to increase CO2 levels
since the “pre-industrial” Little Ice Age. (Levels even higher than
that wouldn’t hurt plants, but they wouldn’t help much, either.)

That’s why most commercial greenhouses use “CO2 generators” to raise daytime CO2 to about that level. It makes the plants healthier, faster-growing, and more productive.
Note: There are several different kinds of photosynthesis.
Plants that use “C3” or “CAM” photosynthesis benefit the most from
higher CO2 levels. “C4” crops benefit the least, but even C4 crops
benefit when under drought stress. Most crops use C3 photosynthesis.
There are only four important C4 crops, all of them grasses: corn
[maize], sugarcane, sorghum, and millet.)
https://www.sealevel.info/C3_and_C4_Pflanze_vs_CO2_Konzentration_2018.png

(dependence of the rate of photosynthesis on the amount of CO2 in the air in C3 and C4 plants, from https://de.wikipedia.org/wiki/Photosynthese)

(dependence of the rate of photosynthesis on the amount of CO2 in the air in C3 and C4 plants, from https://de.wikipedia.org/wiki/Photosynthese)
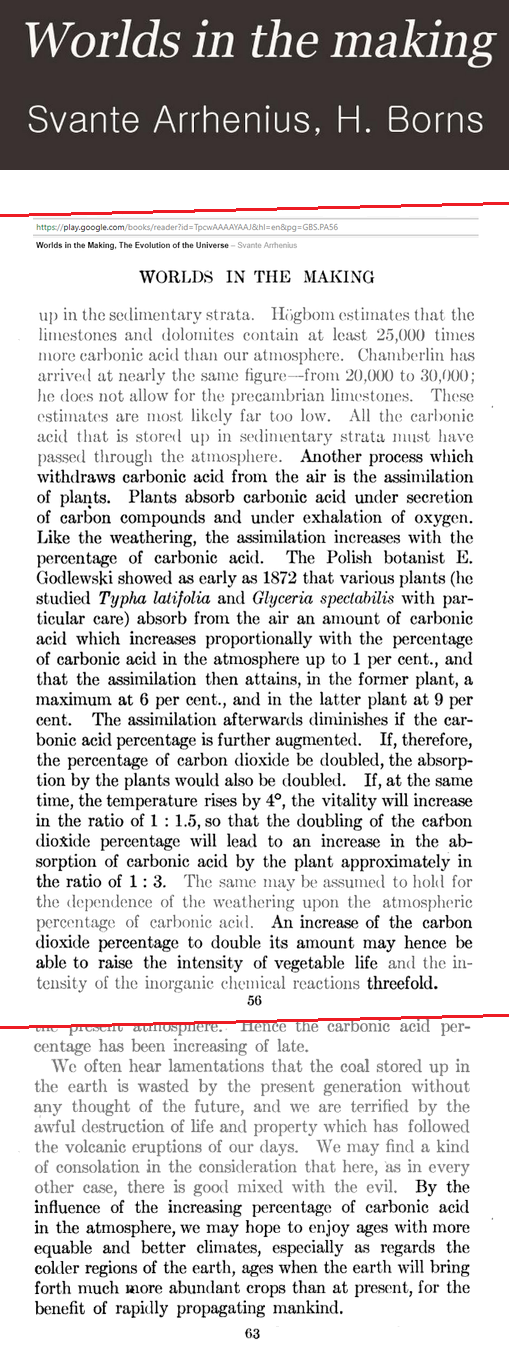
The value of higher CO2 levels for agriculture is not a new discovery. Svante Arrhenius wrote about it in 1908, and cited a source from as early as 1872. Arrhenius predicted that:
“By the influence of the increasing percentage of carbonic acid [CO2]
in the atmosphere, we may hope to enjoy ages with more equable and
better climates, especially as regards the colder regions of the earth,
ages when the earth will bring forth much more abundant crops than at
present, for the benefit of rapidly propagating mankind.”
In 1920, Scientific American reported
the results of German greenhouse and F.A.C.E. experiments with CO2
supplementation. The experiments were so spectacularly successful that SciAm called anthropogenic CO2 “the precious air fertilizer.” From this photo, which accompanied the article, you can certainly see why:

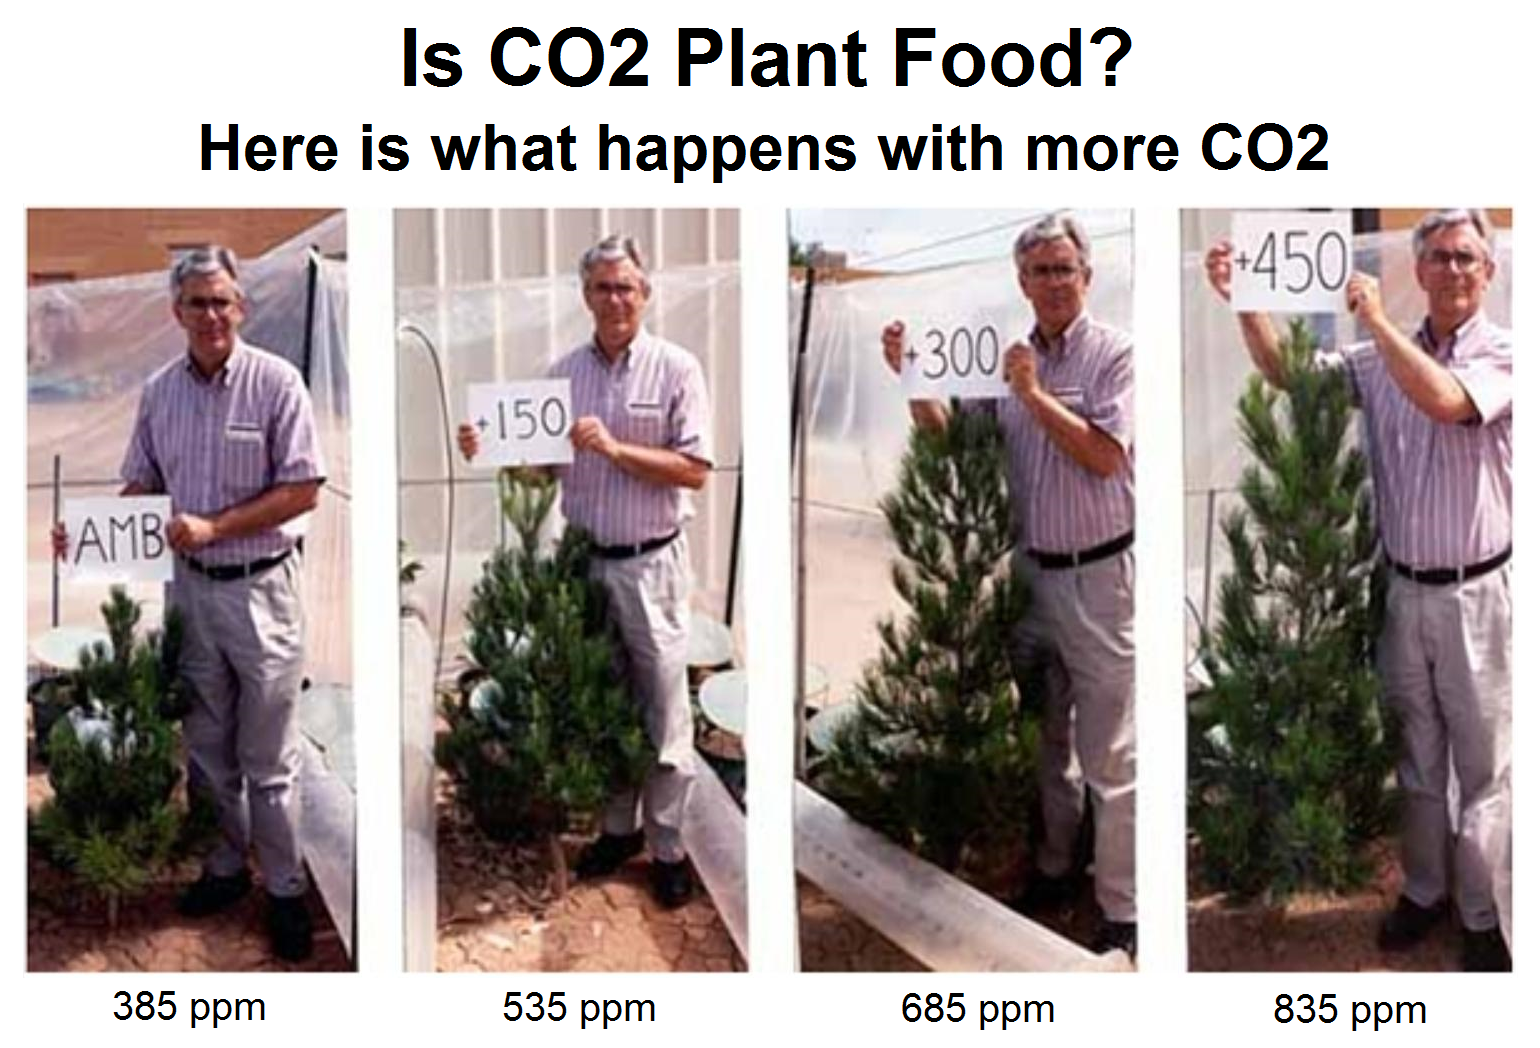
Over the last century, many hundreds of studies have measured the large benefits of higher CO2 levels for most crops:
https://sealevel.info/CO2-pineGrowth100120_white_bg.png

(Dr. Sherwood Idso showing the effect of CO2 level on pine trees)
(Dr. Sherwood Idso showing the effect of CO2 level on pine trees)
But the National Academy of Sciences would have you believe that global warming threatens agricultural productivity. So let’s examine that claim.
Here’s a recent article from the Farm Bureau, reporting preliminary U.S. state-by-state corn and soybean yield numbers for 2018:

Of course the headline obviously suggests that climate change hasn’t
hurt corn and soybean production, so far. But that’s not the most
interesting part of it.
Look at the wide distribution of states, which grow corn. In this
map, from the article, you can see that Minnesota’s 2018 corn yields
averaged 191 Bushels Per Acre (BPA), and Mississippi’s corn yields
averaged 185 BPA. The “breadbasket” states of Illinois and Iowa both had
even bigger bumper crops, with yields above 200 BPA:

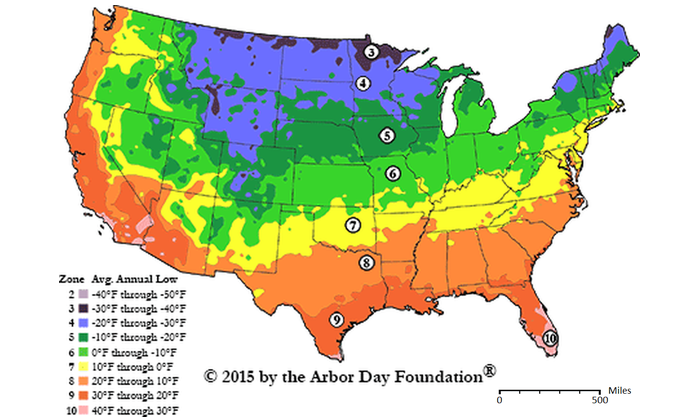
Now, compare that map with this growing-zone map (courtesy of arborday.org).
In it you can see that Minnesota and Mississippi are about four
climate/growing zones apart. Minnesota is mostly zone 4, and Mississippi
is almost entirely zone 8. Illinois and Iowa are a mix of zones 5 &
6:

U.S. climate zones span 10°F, so the center-to-center difference between four zone numbers is 40°F = 22.2 °C.
However, in this map you can see that Minnesota’s corn is mostly from
the southern half of the state, which is a mix of zone 4 and zone 5,
and Mississippi’s corn is mostly from the northwest half of the state,
which is upper zone 8.

So the average temperature difference between the middle of the prime
corn-growing regions of the two states is a bit less than 40°F, I’d
call it about 33 ±2°F.
In Celsius, that’s a temperature difference of 17.2 to 19.4 °C
(midpoint 18.3°C), between Mississippi (185 BPA) and Minnesota (191
BPA).
In other words, it is plain that an average temperature difference of about 18°C has little effect on corn yields.
Many other major crops are even less climate-sensitive:
● Wheat is profitably grown in zones 3 through 9, from Saskatchewan to south Texas, a temperature range of over 35°C:

● Maine & Florida are both major producers of Potatoes:

● Soybeans are grown from Louisiana & Mississippi to Minnesota & Canada:

What, then, are we to make of this PNAS paper?
Zhao C, et al. (2017) Temperature increase reduces global yields of major crops in four independent estimates. Proc Natl Acad Sci USA 114:9326–9331. doi:10.1073/pnas.1701762114
From the title you would probably assume that they found
anthropogenic climate change causes crop yields to decline, because
negative impacts of temperature increases exceed the positive impacts of
CO2 fertilization and improved drought resistance from higher CO2 levels. That’s what you’re supposed to think, and that’s how the press release reported it:
“Climate change will cut crop yields,” said the caption on Phys.org, and called the little five-page paper “a major scientific report.”
“Global Warming Will Sear Three of Four Major Grain Crops,” said the caption on Haaratz.
But if you read the paper, or if you read Eric Worrall’s excellent 2017 analysis of it on WUWT, you’ll discover that the authors did not actually say that. Instead, they wrote that they were discussing what they think would happen to yields in an imaginary world “without CO2 fertilization, effective adaptation, and genetic improvement.”
Of course “without CO2 fertilization” means they’re ignoring the
beneficial effects of higher CO2 levels, which obviously divorces the
paper from any pretense of presenting predictions of future reality.
But it’s even worse than that. Can you guess what their assumption of
no “effective adaptation” to a warming climate actually means?
For annual crops, “effective adaptation” means adjusting spring
planting dates, and perhaps adjusting cultivar selection. That’s all.
It’s not rocket science. In America’s heartland, moving the planting date up by about six days compensates for 1°C of warming:

So +4°C of warming is equivalent to planting about 24 days late.
The assumption of no “effective adaptation” to warming means these
29(!) authors assumed farmers are all idiots, who can’t figure out when
they should plant their crops. (Projection, maybe?)
It’s utterly preposterous. The reality is that most farmers are not idiots, anthropogenic CO2 is highly beneficial “air fertilizer,” and the further that CO2 levels rise, the more productive farms will become.
That fact is true for the great majority of crops, nearly everywhere
in the world. Yet the NAS has been promoting the anti-scientific claim
that rising CO2 levels are bad for agriculture, for years. This 2011 NAS
/ NRC propaganda graph is a particularly outrageous example:

Notice the red “US Maize” and purple “India Wheat” traces, and where
they intersect the 4°C line. You can see that they’re predicting that in
the event of a 4°C temperature increase, U.S. maize (corn) yields would
decline by a devastating 60%, and wheat yields in India would fall 68%.
(Of course such a large temperature increase is thoroughly
implausible, but never mind that. That’s a different rant, for a
different day.)
Today’s rant is this: That NAS / NRC graph is a lie.
If a mere 4°C of warming were actually that destructive to
corn yields, it would obviously be impossible to profitably grow corn
even in Tennessee & Kentucky (zone 7, 174-175 BPA in 2018), let
alone Mississippi (zone 8, 185 BPA).
Likewise, if a mere 4°C temperature increase were actually
that destructive to wheat yields, then it would obviously be impossible
for North Americans to cultivate wheat across seven climate zones, from
Saskatchewan to south Texas, spanning an average temperature range of
about 35°C.
That NAS / NRC graph is utter nonsense. But even though it is old,
it’s still being used by climate change zealots to mislead people. I
stumbled across it because someone posted it in the comments on an article at ArsTechnica.
(I’m currently banned for a week there, for “ignoring moderation,”
because I disagreed with their leftist moderator. My first comment there has been deleted, too, but some of the others are still there. They look “faded” because the ArsTechnica comment system fades-out comments with lots of down votes.)
On March 22, 2012, Rud Istvan did a wonderful, in-depth demolition of that graph, on WUWT & ClimateEtc:
Yet, despite their propaganda graph having been completely debunked,
the NAS is still disseminating it, to promote the climate scare.
Here it is on their web site, on p.28 of a little 40 page propaganda
booklet, which appears to be designed to be used as a resource by
schoolteachers:
Here it is, in convenient PowerPoint format, for incorporation into your talk at the local garden club (slide 21):
(The file metadata indicates that the slides were created by
“Rebecca” in June, 2013 — more than a year after Rud had discredited the
graph.)
It’s also on p.161 of this free 299-page ebook:
If Zhao and his 28 co-authors really believe, as they claimed in
their PNAS paper, that correctly assessing the impact of climate change
on agriculture is “critical to maintaining global food supply,”
then it is incredibly cynical of them and the NAS to publish misleading
papers and graphs which encourage policymakers to take steps that will
actually reduce that the global food supply.
I’m beginning to wonder: Does the “A” in “NAS” is still stand for “Academy of,” or does it now stand for “Anti-,”?


