Search This Blog

Saturday, May 19, 2018

Vapor pressure

From Wikipedia, the free encyclopedia
 
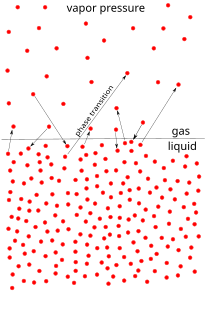
The microscopic process of evaporation and condensation at the liquid surface.
 
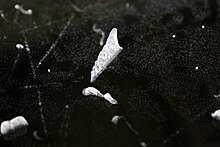
If vapor pressure exceeds the thermodynamic equilibrium value, condensation occurs in presence of nucleation sites. This principle is used in cloud chambers, where particles of radiation form condensation tracks when passing through
 
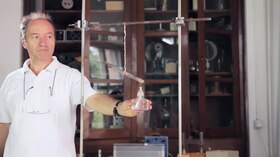
The "Pistol Test Tube" experiment. The tube contains alcohol and is closed with a piece of cork. By heating the alcohol, the vapors fill in the space, increasing the pressure in the tube to the point of the cork popping out.
 
Vapor pressure or equilibrium vapor pressure is defined as the pressure exerted by a vapor in thermodynamic equilibrium with its condensed phases (solid or liquid) at a given temperature in a closed system. The equilibrium vapor pressure is an indication of a liquid's evaporation rate. It relates to the tendency of particles to escape from the liquid (or a solid). A substance with a high vapor pressure at normal temperatures is often referred to as volatile. The pressure exhibited by vapor present above a liquid surface is known as vapor pressure. As the temperature of a liquid increases, the kinetic energy of its molecules also increases. As the kinetic energy of the molecules increases, the number of molecules transitioning into a vapor also increases, thereby increasing the vapor pressure.

The vapor pressure of any substance increases non-linearly with temperature according to the Clausius–Clapeyron relation. The atmospheric pressure boiling point of a liquid (also known as the normal boiling point) is the temperature at which the vapor pressure equals the ambient atmospheric pressure. With any incremental increase in that temperature, the vapor pressure becomes sufficient to overcome atmospheric pressure and lift the liquid to form vapor bubbles inside the bulk of the substance. Bubble formation deeper in the liquid requires a higher pressure, and therefore higher temperature, because the fluid pressure increases above the atmospheric pressure as the depth increases. More important at shallow depths is the higher temperature required to start bubble formation. The surface tension of the bubble wall leads to an overpressure in the very small, initial bubbles. Thus, thermometer calibration should not rely on the temperature in boiling water.

The vapor pressure that a single component in a mixture contributes to the total pressure in the system is called partial pressure. For example, air at sea level, and saturated with water vapor at 20 °C, has partial pressures of about 2.3 kPa of water, 78 kPa of nitrogen, 21 kPa of oxygen and 0.9 kPa of argon, totaling 102.2 kPa, making the basis for standard atmospheric pressure.

Measurement and units

Vapor pressure is measured in the standard units of pressure. The International System of Units (SI) recognizes pressure as a derived unit with the dimension of force per area and designates the pascal (Pa) as its standard unit. One pascal is one newton per square meter (N·m−2 or kg·m−1·s−2).

Experimental measurement of vapor pressure is a simple procedure for common pressures between 1 and 200 kPa.[1] Most accurate results are obtained near the boiling point of substances and large errors result for measurements smaller than 1kPa. Procedures often consist of purifying the test substance, isolating it in a container, evacuating any foreign gas, then measuring the equilibrium pressure of the gaseous phase of the substance in the container at different temperatures. Better accuracy is achieved when care is taken to ensure that the entire substance and its vapor are at the prescribed temperature. This is often done, as with the use of an isoteniscope, by submerging the containment area in a liquid bath.

Very low vapor pressures of solids can be measured using the Knudsen effusion cell method.

In a medical context, vapor pressure is sometimes expressed in other units, specifically millimeters of mercury (mmHg). This is important for volatile anesthetics, most of which are liquids at body temperature, but with a relatively high vapor pressure. Anesthetics with a higher vapor pressure at body temperature will be excreted more quickly, as they are exhaled from the lungs.

Estimating vapor pressures with Antoine equation

The Antoine equation[2][3] is a mathematical expression of the relation between the vapor pressure and the temperature of pure liquid or solid substances. The basic form of the equation is:
\log P=A-{\frac {B}{C+T}}
and it can be transformed into this temperature-explicit form:
T={\frac {B}{A-\log P}}-C
where: P is the absolute vapor pressure of a substance
    T is the temperature of the substance
    A, B and C are substance-specific coefficients (i.e., constants or parameters)
    \log is typically either \log _{10} or \log _{e}[3]
A simpler form of the equation with only two coefficients is sometimes used:
\log P=A-{\frac {B}{T}}
which can be transformed to:
T={\frac {B}{A-\log P}}
Sublimations and vaporizations of the same substance have separate sets of Antoine coefficients, as do components in mixtures.[2] Each parameter set for a specific compound is only applicable over a specified temperature range. Generally, temperature ranges are chosen to maintain the equation's accuracy of a few up to 8–10 percent. For many volatile substances, several different sets of parameters are available and used for different temperature ranges. The Antoine equation has poor accuracy with any single parameter set when used from a compound's melting point to its critical temperature. Accuracy is also usually poor when vapor pressure is under 10 Torr because of the limitations of the apparatus used to establish the Antoine parameter values.

The Wagner Equation[4] gives "one of the best"[5] fits to experimental data but is quite complex. It expresses reduced vapor pressure as a function of reduced temperature.

Relation to boiling point of liquids

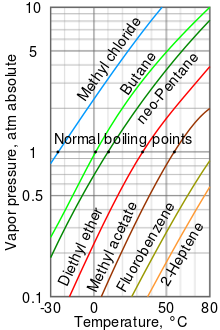
A log-lin vapor pressure chart for various liquids

As a general trend, vapor pressures of liquids at ambient temperatures increase with decreasing boiling points. This is illustrated in the vapor pressure chart (see right) that shows graphs of the vapor pressures versus temperatures for a variety of liquids.[6] At the normal boiling point of a liquid, the vapor pressure is equal to the standard atmospheric pressure defined as 1 atmosphere[7] (760 Torr or 101 325 kPa).

For example, at any given temperature, methyl chloride has the highest vapor pressure of any of the liquids in the chart. It also has the lowest normal boiling point (−24.2 °C), which is where the vapor pressure curve of methyl chloride (the blue line) intersects the horizontal pressure line of one atmosphere (atm) of absolute vapor pressure.

Although the relation between vapor pressure and temperature is non-linear, the chart uses a logarithmic vertical axis to produce slightly curved lines, so one chart can graph many liquids. A nearly straight line is obtained when the logarithm of the vapor pressure is plotted against 1/(T+230)[8] where T is the temperature in degrees Celsius. The vapor pressure of a liquid at its boiling point equals the pressure of its surrounding environment.

Liquid mixtures

Raoult's law gives an approximation to the vapor pressure of mixtures of liquids. It states that the activity (pressure or fugacity) of a single-phase mixture is equal to the mole-fraction-weighted sum of the components' vapor pressures:
{\displaystyle P_{tot}=\sum _{i}Py_{i}=\sum _{i}P_{i}^{sat}x_{i}\,}
where {\displaystyle p_{tot}} is the mixture's vapor pressure, x_{i} is the mole fraction of component i in the liquid phase and {\displaystyle y_{i}} is the mole fraction of component i in the vapor phase respectively. {\displaystyle P_{i}^{sat}} is the vapor pressure of component i. Raoult's law is applicable only to non-electrolytes (uncharged species); it is most appropriate for non-polar molecules with only weak intermolecular attractions (such as London forces).

Systems that have vapor pressures higher than indicated by the above formula are said to have positive deviations. Such a deviation suggests weaker intermolecular attraction than in the pure components, so that the molecules can be thought of as being "held in" the liquid phase less strongly than in the pure liquid. An example is the azeotrope of approximately 95% ethanol and water. Because the azeotrope's vapor pressure is higher than predicted by Raoult's law, it boils at a temperature below that of either pure component.

There are also systems with negative deviations that have vapor pressures that are lower than expected. Such a deviation is evidence for stronger intermolecular attraction between the constituents of the mixture than exists in the pure components. Thus, the molecules are "held in" the liquid more strongly when a second molecule is present. An example is a mixture of trichloromethane (chloroform) and 2-propanone (acetone), which boils above the boiling point of either pure component.

The negative and positive deviations can be used to determine thermodynamic activity coefficients of the components of mixtures.

Solids

Vapor pressure of liquid and solid benzene

Equilibrium vapor pressure can be defined as the pressure reached when a condensed phase is in equilibrium with its own vapor. In the case of an equilibrium solid, such as a crystal, this can be defined as the pressure when the rate of sublimation of a solid matches the rate of deposition of its vapor phase. For most solids this pressure is very low, but some notable exceptions are naphthalene, dry ice (the vapor pressure of dry ice is 5.73 MPa (831 psi, 56.5 atm) at 20 degrees Celsius, which causes most sealed containers to rupture), and ice. All solid materials have a vapor pressure. However, due to their often extremely low values, measurement can be rather difficult. Typical techniques include the use of thermogravimetry and gas transpiration.

There are a number of methods for calculating the sublimation pressure (i.e., the vapor pressure) of a solid. One method is to estimate the sublimation pressure from extrapolated liquid vapor pressures (of the supercooled liquid), if the heat of fusion is known, by using this particular form of the Clausius–Clapeyron relation:[9]
\ln \,P_{solid}^{S}=\ln \,P_{liquid}^{S}-{\frac {\Delta H_{m}}{R}}\left({\frac {1}{T}}-{\frac {1}{T_{m}}}\right)
with:

P_{solid}^{S} = Sublimation pressure of the solid component at the temperature T<T_{m}
P_{liquid}^{S} = Extrapolated vapor pressure of the liquid component at the temperature T<T_{m}
\Delta H_{m} = Heat of fusion
R = Gas constant
T = Sublimation temperature
T_{m} = Melting point temperature

This method assumes that the heat of fusion is temperature-independent, ignores additional transition temperatures between different solid phases, and it gives a fair estimation for temperatures not too far from the melting point. It also shows that the sublimation pressure is lower than the extrapolated liquid vapor pressure (ΔHm is positive) and the difference grows with increased distance from the melting point.

Boiling point of water

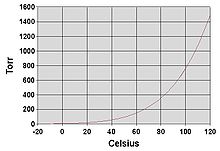
Graph of water vapor pressure versus temperature. At the normal boiling point of 100 °C, it equals the standard atmospheric pressure of 760 Torr or 101.325 kPa.

Like all liquids, water boils when its vapor pressure reaches its surrounding pressure. In nature, the atmospheric pressure is lower at higher elevations and water boils at a lower temperature. The boiling temperature of water for atmospheric pressures can be approximated by the Antoine equation:
\log _{10}P=8.07131-{\frac {1730.63}{233.426+T_{b}}}
or transformed into this temperature-explicit form:
T_{b}={\frac {1730.63}{8.07131-\log _{10}P}}-233.426
where the temperature T_{b} is the boiling point in degrees Celsius and the pressure P_{} is in Torr.

Dühring's rule

Dühring's rule states that a linear relationship exists between the temperatures at which two solutions exert the same vapor pressure.

Examples

The following table is a list of a variety of substances ordered by increasing vapor pressure (in absolute units).

Substance Vapor Pressure
(SI units)
Vapor Pressure
(Bar)
Vapor Pressure
(mmHg)
Temperature
Tungsten 100 Pa 0.001 0.75 3203 °C
Ethylene glycol 500 Pa 0.005 3.75 20 °C
Xenon difluoride 600 Pa 0.006 4.50 25 °C
Water (H2O) 2.3 kPa 0.023 17.5 20 °C
Propanol 2.4 kPa 0.024 18.0 20 °C
Methyl isobutyl ketone 2.66 kPa 0.0266 19.95 25 °C
Ethanol 5.83 kPa 0.0583 43.7 20 °C
Freon 113 37.9 kPa 0.379 284 20 °C
Acetaldehyde 98.7 kPa 0.987 740 20 °C
Butane 220 kPa 2.2 1650 20 °C
Formaldehyde 435.7 kPa 4.357 3268 20 °C
Propane[10] 997.8 kPa 9.978 7584 26.85 °C
Carbonyl sulfide 1.255 MPa 12.55 9412 25 °C
Nitrous oxide[11] 5.660 MPa 56.60 42453 25 °C
Carbon dioxide 5.7 MPa 57 42753 20 °C

Estimating vapor pressure from molecular structure

Several empirical methods exist to estimate liquid vapor pressure from molecular structure for organic molecules. Some examples are SIMPOL,[12] the method of Moller et al.,[9] and evaporation.[13][14]

Meaning in meteorology

In meteorology, the term vapor pressure is used to mean the partial pressure of water vapor in the atmosphere, even if it is not in equilibrium,[15] and the equilibrium vapor pressure is specified otherwise. Meteorologists also use the term saturation vapor pressure to refer to the equilibrium vapor pressure of water or brine above a flat surface, to distinguish it from equilibrium vapor pressure, which takes into account the shape and size of water droplets and particulates in the atmosphere.[16]

Water vapor


From Wikipedia, the free encyclopedia
Water vapor (H2O)
St Johns Fog.jpg
Invisible water vapor condenses to form
visible clouds of liquid rain droplets
Liquid state Water
Solid state Ice
Properties[1]
Molecular formula H2O
Molar mass 18.01528(33) g/mol
Melting point 0.00 °C (273.15 K)[2]
Boiling point 99.98 °C (373.13 K)[2]
specific gas constant 461.5 J/(kg·K)
Heat of vaporization 2.27 MJ/kg
Heat capacity at 300 K 1.864 kJ/(kg·K)[3]

Water vapor, water vapour or aqueous vapor is the gaseous phase of water. It is one state of water within the hydrosphere. Water vapor can be produced from the evaporation or boiling of liquid water or from the sublimation of ice. Unlike other forms of water, water vapor is invisible.[4] Under typical atmospheric conditions, water vapor is continuously generated by evaporation and removed by condensation. It is less dense than air and triggers convection currents that can lead to clouds.

Being a component of Earth's hydrosphere and hydrologic cycle, it is particularly abundant in Earth's atmosphere where it is also a potent greenhouse gas along with other gases such as carbon dioxide and methane. Use of water vapor, as steam, has been important to humans for cooking and as a major component in energy production and transport systems since the industrial revolution.

Water vapor is a relatively common atmospheric constituent, present even in the solar atmosphere as well as every planet in the Solar System and many astronomical objects including natural satellites, comets and even large asteroids. Likewise the detection of extrasolar water vapor would indicate a similar distribution in other planetary systems. Water vapor is significant in that it can be indirect evidence supporting the presence of extraterrestrial liquid water in the case of some planetary mass objects.

Properties

Evaporation

Whenever a water molecule leaves a surface and diffuses into a surrounding gas, it is said to have evaporated. Each individual water molecule which transitions between a more associated (liquid) and a less associated (vapor/gas) state does so through the absorption or release of kinetic energy. The aggregate measurement of this kinetic energy transfer is defined as thermal energy and occurs only when there is differential in the temperature of the water molecules. Liquid water that becomes water vapor takes a parcel of heat with it, in a process called evaporative cooling.[5] The amount of water vapor in the air determines how frequently molecules will return to the surface. When a net evaporation occurs, the body of water will undergo a net cooling directly related to the loss of water.

In the US, the National Weather Service measures the actual rate of evaporation from a standardized "pan" open water surface outdoors, at various locations nationwide. Others do likewise around the world. The US data is collected and compiled into an annual evaporation map.[6] The measurements range from under 30 to over 120 inches per year. Formulas can be used for calculating the rate of evaporation from a water surface such as a swimming pool.[7][8] In some countries, the evaporation rate far exceeds the precipitation rate.

Evaporative cooling is restricted by atmospheric conditions. Humidity is the amount of water vapor in the air. The vapor content of air is measured with devices known as hygrometers. The measurements are usually expressed as specific humidity or percent relative humidity. The temperatures of the atmosphere and the water surface determine the equilibrium vapor pressure; 100% relative humidity occurs when the partial pressure of water vapor is equal to the equilibrium vapor pressure. This condition is often referred to as complete saturation. Humidity ranges from 0 gram per cubic metre in dry air to 30 grams per cubic metre (0.03 ounce per cubic foot) when the vapor is saturated at 30 °C.[9]

Recovery of meteorites in Antarctica (ANSMET)
Electron micrograph of freeze-etched capillary tissue


Sublimation

Sublimation is when water molecules directly leave the surface of ice without first becoming liquid water. Sublimation accounts for the slow mid-winter disappearance of ice and snow at temperatures too low to cause melting. Antarctica shows this effect to a unique degree because it is by far the continent with the lowest rate of precipitation on Earth. As a result, there are large areas where millennial layers of snow have sublimed, leaving behind whatever non-volatile materials they had contained. This is extremely valuable to certain scientific disciplines, a dramatic example being the collection of meteorites that are left exposed in unparalleled numbers and excellent states of preservation.

Sublimation is important in the preparation of certain classes of biological specimens for scanning electron microscopy. Typically the specimens are prepared by cryofixation and freeze-fracture, after which the broken surface is freeze-etched, being eroded by exposure to vacuum till it shows the required level of detail. This technique can display protein molecules, organelle structures and lipid bilayers with very low degrees of distortion.

Condensation


Clouds, formed by condensed water vapor

Water vapor will only condense onto another surface when that surface is cooler than the dew point temperature, or when the water vapor equilibrium in air has been exceeded. When water vapor condenses onto a surface, a net warming occurs on that surface. The water molecule brings heat energy with it. In turn, the temperature of the atmosphere drops slightly.[11] In the atmosphere, condensation produces clouds, fog and precipitation (usually only when facilitated by cloud condensation nuclei). The dew point of an air parcel is the temperature to which it must cool before water vapor in the air begins to condense concluding water vapor is a type of water or rain.

Also, a net condensation of water vapor occurs on surfaces when the temperature of the surface is at or below the dew point temperature of the atmosphere. Deposition is a phase transition separate from condensation which leads to the direct formation of ice from water vapor. Frost and snow are examples of deposition.

Chemical reactions

A number of chemical reactions have water as a product. If the reactions take place at temperatures higher than the dew point of the surrounding air the water will be formed as vapor and increase the local humidity, if below the dew point local condensation will occur. Typical reactions that result in water formation are the burning of hydrogen or hydrocarbons in air or other oxygen containing gas mixtures, or as a result of reactions with oxidizers.

In a similar fashion other chemical or physical reactions can take place in the presence of water vapor resulting in new chemicals forming such as rust on iron or steel, polymerization occurring (certain polyurethane foams and cyanoacrylate glues cure with exposure to atmospheric humidity) or forms changing such as where anhydrous chemicals may absorb enough vapor to form a crystalline structure or alter an existing one, sometimes resulting in characteristic color changes that can be used for measurement.

Measurement

Measuring the quantity of water vapor in a medium can be done directly or remotely with varying degrees of accuracy. Remote methods such electromagnetic absorption are possible from satellites above planetary atmospheres. Direct methods may use electronic transducers, moistened thermometers or hygroscopic materials measuring changes in physical properties or dimensions.


medium temperature range (degC) measurement uncertainty typical measurement frequency system cost notes
sling psychrometer air −10 to 50 low to moderate hourly low
satellite-based spectroscopy air −80 to 60 low
very high
capacitive sensor air/gases −40 to 50 moderate 2 to 0.05 Hz medium prone to becoming saturated/contaminated over time
warmed capacitive sensor air/gases −15 to 50 moderate to low 2 to 0.05 Hz (temp dependant) medium to high prone to becoming saturated/contaminated over time
resistive sensor air/gases −10 to 50 moderate 60 seconds medium prone to contamination
lithium chloride dewcell air −30 to 50 moderate continuous medium see dewcell
Cobalt(II) chloride air/gases 0 to 50 high 5 minutes very low often used in Humidity indicator card
Absorption spectroscopy air/gases
moderate
high
Aluminum oxide air/gases
moderate
medium see Moisture analysis
silicon oxide air/gases
moderate
medium see Moisture analysis
Piezoelectric sorption air/gases
moderate
medium see Moisture analysis
Electrolytic air/gases
moderate
medium see Moisture analysis
hair tension air 0 to 40 high continuous low to medium Affected by temperature. Adversely affected by prolonged high concentrations
Nephelometer air/other gases
low
very high
Goldbeater's skin (Cow Peritoneum) air −20 to 30 moderate (with corrections) slow, slower at lower temperatures low ref:WMO Guide to Meteorological Instruments and Methods of Observation No. 8 2006, (pages 1.12–1)
Lyman-alpha


high frequency high http://amsglossary.allenpress.com/glossary/search?id=lyman-alpha-hygrometer1 Requires frequent calibration
Gravimetric Hygrometer

very low
very high often called primary source, national independent standards developed in US,UK,EU & Japan

medium temperature range (degC) measurement uncertainty typical measurement frequency system cost notes

Impact on air density

Water vapor is lighter or less dense than dry air.[12][13] At equivalent temperatures it is buoyant with respect to dry air, whereby the density of dry air at standard temperature and pressure is 1.27 g/L and water vapor at standard temperature and pressure has the much lower density of 0.804 g/L.

Calculations

Dewpoint.jpg
Water vapor and dry air density calculations at 0 °C:
  • The molar mass of water is 18.02 g/mol, as calculated from the sum of the atomic masses of its constituent atoms.
  • The average molecular mass of air (approx. 78% nitrogen, N2; 21% oxygen, O2; 1% other gases) is 28.57 g/mol at standard temperature and pressure (STP).
  • Using Avogadro's Law and the ideal gas law, water vapor and air will have a molar volume of 22.414 L/mol at STP. A molar mass of air and water vapor occupy the same volume of 22.414 litres. The density (mass/volume) of water vapor is 0.804 g/L, which is significantly less than that of dry air at 1.27 g/L at STP. This means water vapor is lighter than air.
  • STP conditions imply a temperature of 0 °C, at which the ability of water to become vapor is very restricted. Its concentration in air is very low at 0 °C. The red line on the chart to the right is the maximum concentration of water vapor expected for a given temperature. The water vapor concentration increases significantly as the temperature rises, approaching 100% (steam, pure water vapor) at 100 °C. However the difference in densities between air and water vapor would still exist.

At equal temperatures

At the same temperature, a column of dry air will be denser or heavier than a column of air containing any water vapor, the molar mass of diatomic nitrogen and diatomic oxygen both being greater than the molar mass of water. Thus, any volume of dry air will sink if placed in a larger volume of moist air. Also, a volume of moist air will rise or be buoyant if placed in a larger region of dry air. As the temperature rises the proportion of water vapor in the air increases, and its buoyancy will increase. The increase in buoyancy can have a significant atmospheric impact, giving rise to powerful, moisture rich, upward air currents when the air temperature and sea temperature reaches 25 °C or above. This phenomenon provides a significant driving force for cyclonic and anticyclonic weather systems (typhoons and hurricanes).

Respiration and breathing

Water vapor is a by-product of respiration in plants and animals. Its contribution to the pressure, increases as its concentration increases. Its partial pressure contribution to air pressure increases, lowering the partial pressure contribution of the other atmospheric gases (Dalton's Law). The total air pressure must remain constant. The presence of water vapor in the air naturally dilutes or displaces the other air components as its concentration increases.

This can have an effect on respiration. In very warm air (35 °C) the proportion of water vapor is large enough to give rise to the stuffiness that can be experienced in humid jungle conditions or in poorly ventilated buildings.

Lifting gas

Water vapor has lower density than that of air and is therefore buoyant in air but has lower vapor pressure than that of air. When water vapor is used as a lifting gas by a thermal airship the water vapor is heated to form steam so that its vapor pressure is greater than the surrounding air pressure in order to maintain the shape of a theoretical "steam balloon", which yields approximately 60% the lift of helium and twice that of hot air.[14]

General discussion

The amount of water vapor in an atmosphere is constrained by the restrictions of partial pressures and temperature. Dew point temperature and relative humidity act as guidelines for the process of water vapor in the water cycle. Energy input, such as sunlight, can trigger more evaporation on an ocean surface or more sublimation on a chunk of ice on top of a mountain. The balance between condensation and evaporation gives the quantity called vapor partial pressure.

The maximum partial pressure (saturation pressure) of water vapor in air varies with temperature of the air and water vapor mixture. A variety of empirical formulas exist for this quantity; the most used reference formula is the Goff-Gratch equation for the SVP over liquid water below zero degree Celsius:

\log _{10}\left(p\right)= -7.90298\left({\frac {373.16}{T}}-1\right)+5.02808\log _{10}{\frac {373.16}{T}}

-1.3816\times 10^{-7}\left(10^{11.344\left(1-{\frac {T}{373.16}}\right)}-1\right)


+\log _{10}\left(1013.246\right)
Where T, temperature of the moist air, is given in units of kelvin, and p is given in units of millibars (hectopascals).
The formula is valid from about −50 to 102 °C; however there are a very limited number of measurements of the vapor pressure of water over supercooled liquid water. There are a number of other formulae which can be used.[15]

Under certain conditions, such as when the boiling temperature of water is reached, a net evaporation will always occur during standard atmospheric conditions regardless of the percent of relative humidity. This immediate process will dispel massive amounts of water vapor into a cooler atmosphere.

Exhaled air is almost fully at equilibrium with water vapor at the body temperature. In the cold air the exhaled vapor quickly condenses, thus showing up as a fog or mist of water droplets and as condensation or frost on surfaces. Forcibly condensing these water droplets from exhaled breath is the basis of exhaled breath condensate, an evolving medical diagnostic test.

Controlling water vapor in air is a key concern in the heating, ventilating, and air-conditioning (HVAC) industry. Thermal comfort depends on the moist air conditions. Non-human comfort situations are called refrigeration, and also are affected by water vapor. For example, many food stores, like supermarkets, utilize open chiller cabinets, or food cases, which can significantly lower the water vapor pressure (lowering humidity). This practice delivers several benefits as well as problems.

In Earth's atmosphere


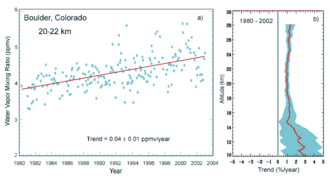
Evidence for increasing amounts of stratospheric water vapor over time in Boulder, Colorado.

Gaseous water represents a small but environmentally significant constituent of the atmosphere. The percentage water vapor in surface air varies from 0.01% at -42 °C (-44 °F)[16] to 4.24% when the dew point is 30 °C (86 °F).[17] Approximately 99.13% of it is contained in the troposphere. The condensation of water vapor to the liquid or ice phase is responsible for clouds, rain, snow, and other precipitation, all of which count among the most significant elements of what we experience as weather. Less obviously, the latent heat of vaporization, which is released to the atmosphere whenever condensation occurs, is one of the most important terms in the atmospheric energy budget on both local and global scales. For example, latent heat release in atmospheric convection is directly responsible for powering destructive storms such as tropical cyclones and severe thunderstorms. Water vapor is the most potent greenhouse gas owing to the presence of the hydroxyl bond which strongly absorbs in the infra-red region of the light spectrum.

Water in Earth's atmosphere is not merely below its boiling point (100 °C), but at altitude it goes below its freezing point (0 °C), due to water's highly polar attraction. When combined with its quantity, water vapor then has a relevant dew point and frost point, unlike e. g., carbon dioxide and methane. Water vapor thus has a scale height a fraction of that of the bulk atmosphere,[18][19][20] as the water condenses and exits, primarily in the troposphere, the lowest layer of the atmosphere.[21] Carbon dioxide (CO2) and methane, being non-polar, rise above water vapor. The absorption and emission of both compounds contribute to Earth's emission to space, and thus the planetary greenhouse effect.[19][22][23] This greenhouse forcing is directly observable, via distinct spectral features versus water vapor, and observed to be rising with rising CO2 levels.[24] Conversely, adding water vapor at high altitudes has a disproportionate impact, which is why methane (rising, then oxidizing to CO2 and two water molecules) and jet traffic[25][26][27] have disproportionately high warming effects.

It is less clear how cloudiness would respond to a warming climate; depending on the nature of the response, clouds could either further amplify or partly mitigate warming from long-lived greenhouse gases.

In the absence of other greenhouse gases, Earth's water vapor would condense to the surface;[28][29][30] this has likely happened, possibly more than once. Scientists thus distinguish between non-condensable (driving) and condensable (driven) greenhouse gases- i. e., the above water vapor feedback.[31][32][33]

Fog and clouds form through condensation around cloud condensation nuclei. In the absence of nuclei, condensation will only occur at much lower temperatures. Under persistent condensation or deposition, cloud droplets or snowflakes form, which precipitate when they reach a critical mass.

The water content of the atmosphere as a whole is constantly depleted by precipitation. At the same time it is constantly replenished by evaporation, most prominently from seas, lakes, rivers, and moist earth. Other sources of atmospheric water include combustion, respiration, volcanic eruptions, the transpiration of plants, and various other biological and geological processes. The mean global content of water vapor in the atmosphere is roughly sufficient to cover the surface of the planet with a layer of liquid water about 25 mm deep. The mean annual precipitation for the planet is about 1 meter, which implies a rapid turnover of water in the air – on average, the residence time of a water molecule in the troposphere is about 9 to 10 days.

Episodes of surface geothermal activity, such as volcanic eruptions and geysers, release variable amounts of water vapor into the atmosphere. Such eruptions may be large in human terms, and major explosive eruptions may inject exceptionally large masses of water exceptionally high into the atmosphere, but as a percentage of total atmospheric water, the role of such processes is minor. The relative concentrations of the various gases emitted by volcanoes varies considerably according to the site and according to the particular event at any one site. However, water vapor is consistently the commonest volcanic gas; as a rule, it comprises more than 60% of total emissions during a subaerial eruption.[34]

Atmospheric water vapor content is expressed using various measures. These include vapor pressure, specific humidity, mixing ratio, dew point temperature, and relative humidity.

Radar and satellite imaging

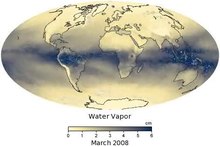
These maps show the average amount of water vapor in a column of atmosphere in a given month.(click for more detail)

MODIS/Terra global mean atmospheric water vapor
Because water molecules absorb microwaves and other radio wave frequencies, water in the atmosphere attenuates radar signals.[35] In addition, atmospheric water will reflect and refract signals to an extent that depends on whether it is vapor, liquid or solid.

Generally, radar signals lose strength progressively the farther they travel through the troposphere. Different frequencies attenuate at different rates, such that some components of air are opaque to some frequencies and transparent to others. Radio waves used for broadcasting and other communication experience the same effect.

Water vapor reflects radar to a lesser extent than do water's other two phases. In the form of drops and ice crystals, water acts as a prism, which it does not do as an individual molecule; however, the existence of water vapor in the atmosphere causes the atmosphere to act as a giant prism.[36]

A comparison of GOES-12 satellite images shows the distribution of atmospheric water vapor relative to the oceans, clouds and continents of the Earth. Vapor surrounds the planet but is unevenly distributed. The image loop on the right shows monthly average of water vapor content with the units are given in centimeters, which is the precipitable water or equivalent amount of water that could be produced if all the water vapor in the column were to condense. The lowest amounts of water vapor (0 centimeters) appear in yellow, and the highest amounts (6 centimeters) appear in dark blue. Areas of missing data appear in shades of gray. The maps are based on data collected by the Moderate Resolution Imaging Spectroradiometer (MODIS) sensor on NASA's Aqua satellite. The most noticeable pattern in the time series is the influence of seasonal temperature changes and incoming sunlight on water vapor. In the tropics, a band of extremely humid air wobbles north and south of the equator as the seasons change. This band of humidity is part of the Intertropical Convergence Zone, where the easterly trade winds from each hemisphere converge and produce near-daily thunderstorms and clouds. Farther from the equator, water vapor concentrations are high in the hemisphere experiencing summer and low in the one experiencing winter. Another pattern that shows up in the time series is that water vapor amounts over land areas decrease more in winter months than adjacent ocean areas do. This is largely because air temperatures over land drop more in the winter than temperatures over the ocean. Water vapor condenses more rapidly in colder air.[37]

As water vapour absorbs light in the visible spectral range, its absorption can be used in spectroscopic applications (such as DOAS) to determine the amount of water vapor in the atmosphere. This is done operationally, e.g. from the GOME spectrometers on ERS and MetOp.[38] The weaker water vapor absorption lines in the blue spectral range and further into the UV up to its dissociation limit around 243 nm are mostly based on quantum mechanical calculations[39] and are only partly confirmed by experiments.[40]

Lightning generation

Water vapor plays a key role in lightning production in the atmosphere. From cloud physics, usually, clouds are the real generators of static charge as found in Earth's atmosphere. But the ability, or capability of clouds to hold massive amounts of electrical energy is directly related to the amount of water vapor present in the local system.
The amount of water vapor directly controls the permittivity of the air. During times of low humidity, static discharge is quick and easy. During times of higher humidity, fewer static discharges occur. Permittivity and capacitance work hand in hand to produce the megawatt outputs of lightning.[41]

After a cloud, for instance, has started its way to becoming a lightning generator, atmospheric water vapor acts as a substance (or insulator) that decreases the ability of the cloud to discharge its electrical energy. Over a certain amount of time, if the cloud continues to generate and store more static electricity, the barrier that was created by the atmospheric water vapor will ultimately break down from the stored electrical potential energy.[42] This energy will be released to a locally, oppositely charged region in the form of lightning. The strength of each discharge is directly related to the atmospheric permittivity, capacitance, and the source's charge generating ability.[43]

Extraterrestrial

Water vapor is common in the Solar System and by extension, other planetary systems. Its signature has been detected in the atmospheres of the Sun, occurring in sunspots. The presence of water vapor has been detected in the atmospheres of all seven extraterrestrial planets in the solar system, the Earth's Moon,[44] and the moons of other planets,[which?] although typically in only trace amounts.


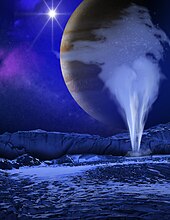
Cryogeyser erupting on Jupiter's moon Europa (artist concept)[45]

Artist's illustration of the signatures of water in exoplanet atmospheres detectable by instruments such as the Hubble Space Telescope.[46]

Geological formations such as cryogeysers are thought to exist on the surface of several icy moons ejecting water vapor due to tidal heating and may indicate the presence of substantial quantities of subsurface water. Plumes of water vapor have been detected on Jupiter's moon Europa and are similar to plumes of water vapor detected on Saturn's moon Enceladus.[45] Traces of water vapor have also been detected in the stratosphere of Titan.[47] Water vapor has been found to be a major constituent of the atmosphere of dwarf planet, Ceres, largest object in the asteroid belt[48] The detection was made by using the far-infrared abilities of the Herschel Space Observatory.[49] The finding is unexpected because comets, not asteroids, are typically considered to "sprout jets and plumes." According to one of the scientists, "The lines are becoming more and more blurred between comets and asteroids."[49] Scientists studying Mars hypothesize that if water moves about the planet, it does so as vapor.[50]

The brilliance of comet tails comes largely from water vapor. On approach to the Sun, the ice many comets carry sublimates to vapor, which reflects light from the Sun. Knowing a comet's distance from the sun, astronomers may deduce a comet's water content from its brilliance.[51]

Water vapor has also been confirmed outside the Solar System. Spectroscopic analysis of HD 209458 b, an extrasolar planet in the constellation Pegasus, provides the first evidence of atmospheric water vapor beyond the Solar System. A star called CW Leonis was found to have a ring of vast quantities of water vapor circling the aging, massive star. A NASA satellite designed to study chemicals in interstellar gas clouds, made the discovery with an onboard spectrometer. Most likely, "the water vapor was vaporized from the surfaces of orbiting comets."[52] HAT-P-11b a relatively small exoplanet has also been found to possess water vapour.[53]

Blinded experiment

From Wikipedia, the free encyclopedia

A blind or blinded-experiment is an experiment in which information about the test is masked (kept) from the participant, to reduce or eliminate bias, until after a trial outcome is known.[1] It is understood that bias may be intentional or subconscious, thus no dishonesty is implied by blinding. If both tester and subject are blinded, the trial is called a double-blind experiment.

Blind testing is used wherever items are to be compared without influences from testers' preferences or expectations, for example in clinical trials to evaluate the effectiveness of medicinal drugs and procedures without placebo effect, observer bias, or conscious deception; and comparative testing of commercial products to objectively assess user preferences without being influenced by branding and other properties not being tested.

Blinding can be imposed on researchers, technicians, or subjects. The opposite of a blind trial is an open trial. Blind experiments are an important tool of the scientific method, in many fields of research—medicine, psychology and the social sciences, natural sciences such as physics and biology, applied sciences such as market research, and many others. In some disciplines, such as medicinal drug testing, blind experiments are considered essential.

In some cases, while blind experiments would be useful, they are impractical or unethical; an example is in the field of developmental psychology: although it would be informative to raise children under arbitrary experimental conditions, such as on a remote island with a fabricated enculturation, it is a violation of ethics and human rights.

The terms blind (adjective) or to blind (transitive verb) when used in this sense are figurative extensions of the literal idea of blindfolding someone. The terms masked or to mask may be used for the same concept; this is commonly the case in ophthalmology, where the word 'blind' is often used in the literal sense.

Some[who?] argue that the use of the term "blind" for academic review or experiments is offensive and prefer the alternate term "masked" or "anonymous".[2][3]

History

The French Academy of Sciences originated the first recorded blind experiments in 1784: the Academy set up a commission to investigate the claims of animal magnetism proposed by Franz Mesmer. Headed by Benjamin Franklin and Antoine Lavoisier, the commission carried out experiments asking mesmerists to identify objects that had previously been filled with "vital fluid", including trees and flasks of water. The subjects were unable to do so. The commission went on to examine claims involving the curing of "mesmerized" patients. These patients showed signs of improved health, but the commission attributed this to the fact that these patients believed they would get better—the first scientific suggestion of the now well-known placebo effect.[4]

In 1799 the British chemist Humphry Davy performed another early blind experiment. In studying the effects of nitrous oxide (laughing gas) on human physiology, Davy deliberately did not tell his subjects what concentration of the gas they were breathing, or whether they were breathing ordinary air.[4][5]

Blind experiments went on to be used outside of purely scientific settings. In 1817, a committee of scientists and musicians compared a Stradivarius violin to one with a guitar-like design made by the naval engineer François Chanot. A well-known violinist played each instrument while the committee listened in the next room to avoid prejudice.[6][7]

One of the first essays advocating a blinded approach to experiments in general came from Claude Bernard in the latter half of the 19th century, who recommended splitting any scientific experiment between the theorist who conceives the experiment and a naive (and preferably uneducated) observer who registers the results without foreknowledge of the theory or hypothesis being tested. This suggestion contrasted starkly with the prevalent Enlightenment-era attitude that scientific observation can only be objectively valid when undertaken by a well-educated, informed scientist.[8]

Double-blind methods came into especial prominence in the mid-20th century.[9]

Single-blind trials

Single-blind describes experiments where information that could introduce bias or otherwise skew the result is withheld from the participants, but the experimenter will be in full possession of the facts.

In a single-blind experiment, the individual subjects do not know whether they are so-called "test" subjects or members of an "experimental control" group. Single-blind experimental design is used where the experimenters either must know the full facts (for example, when comparing sham to real surgery) and so the experimenters cannot themselves be blind, or where the experimenters will not introduce further bias and so the experimenters need not be blind. However, there is a risk that subjects are influenced by interaction with the researchers – known as the experimenter's bias. Single-blind trials are especially risky in psychology and social science research, where the experimenter has an expectation of what the outcome should be, and may consciously or subconsciously influence the behavior of the subject.

A classic example of a single-blind test is the Pepsi Challenge. A tester, often a marketing person, prepares two sets of cups of cola labeled "A" and "B". One set of cups is filled with Pepsi, while the other is filled with Coca-Cola. The tester knows which soda is in which cup but is not supposed to reveal that information to the subjects. Volunteer subjects are encouraged to try the two cups of soda and polled for which ones they prefer. One of the problems with a single-blind test like this is that the tester can unintentionally give subconscious cues which influence the subjects. In addition, it is possible the tester could intentionally introduce bias by preparing the separate sodas differently (e.g., by putting more ice in one cup or by pushing one cup closer to the subject). If the tester is a marketing person employed by the company which is producing the challenge, there's always the possibility of a conflict of interest where the marketing person is aware that future income will be based on the results of the test.

Double-blind trials

Double-blind describes an especially stringent way of conducting an experiment which attempts to eliminate subjective, unrecognized biases carried by an experiment's subjects (usually human) and conductors. Double-blind studies were first used in 1907 by W. H. R. Rivers and H. N. Webber in the investigation of the effects of caffeine.[10]

In most cases, double-blind experiments are regarded to achieve a higher standard of scientific rigor than single-blind or non-blind experiments.

In these double-blind experiments, neither the participants nor the researchers know which participants belong to the control group, nor the test group. Only after all data have been recorded (and, in some cases, analyzed) do the researchers learn which participants were which. Performing an experiment in double-blind fashion can greatly lessen the power of preconceived notions or physical cues (e.g., placebo effect, observer bias, experimenter's bias) to distort the results (by making researchers or participants behave differently from in everyday life). Random assignment of test subjects to the experimental and control groups is a critical part of any double-blind research design. The key that identifies the subjects and which group they belonged to is kept by a third party, and is not revealed to the researchers until the study is over.

Double-blind methods can be applied to any experimental situation in which there is a possibility that the results will be affected by conscious or unconscious bias on the part of researchers, participants, or both. For example, in animal studies, both the carer of the animals and the assessor of the results have to be blinded; otherwise the carer might treat control subjects differently and alter the results.[11]

Computer-controlled experiments are sometimes also erroneously referred to as double-blind experiments, since software may not cause the type of direct bias between researcher and subject. Development of surveys presented to subjects through computers shows that bias can easily be built into the process. Voting systems are also examples where bias can easily be constructed into an apparently simple machine based system. In analogy to the human researcher described above, the part of the software that provides interaction with the human is presented to the subject as the blinded researcher, while the part of the software that defines the key is the third party. An example is the ABX test, where the human subject has to identify an unknown stimulus X as being either A or B.

Triple-blind trials

A triple-blind study is an extension of the double-blind design; the committee monitoring response variables is not told the identity of the groups. The committee is simply given data for groups A and B. A triple-blind study has the theoretical advantage of allowing the monitoring committee to evaluate the response variable results more objectively. This assumes that appraisal of efficacy and harm, as well as requests for special analyses, may be biased if group identity is known. However, in a trial where the monitoring committee has an ethical responsibility to ensure participant safety, such a design may be counterproductive since in this case monitoring is often guided by the constellation of trends and their directions. In addition, by the time many monitoring committees receive data, often any emergency situation has long passed.[12]

Use

In medicine

Double-blinding is relatively easy to achieve in drug studies, by formulating the investigational drug and the control (either a placebo or an established drug) to have identical appearance (color, taste, etc.). Patients are randomly assigned to the control or experimental group and given random numbers by a study coordinator, who also encodes the drugs with matching random numbers. Neither the patients nor the researchers monitoring the outcome know which patient is receiving which treatment, until the study is over and the random code is revealed.

Effective blinding can be difficult to achieve where the treatment is notably effective (indeed, studies have been suspended in cases where the tested drug combinations were so effective that it was deemed unethical to continue withholding the findings from the control group, and the general population),[13][14] or where the treatment is very distinctive in taste or has unusual side-effects that allow the researcher and/or the subject to guess which group they were assigned to. It is also difficult to use the double blind method to compare surgical and non-surgical interventions (although sham surgery, involving a simple incision, might be ethically permitted). A good clinical protocol will foresee these potential problems to ensure blinding is as effective as possible. It has also been argued[15] that even in a double-blind experiment, general attitudes of the experimenter such as skepticism or enthusiasm towards the tested procedure can be subconsciously transferred to the test subjects.

Evidence-based medicine practitioners prefer blinded randomised controlled trials (RCTs), where that is a possible experimental design. These are high on the hierarchy of evidence; only a meta analysis of several well designed RCTs is considered more reliable.[16]

In physics

Modern nuclear physics and particle physics experiments often involve large numbers of data analysts working together to extract quantitative data from complex datasets. In particular, the analysts want to report accurate systematic error estimates for all of their measurements; this is difficult or impossible if one of the errors is observer bias. To remove this bias, the experimenters devise blind analysis techniques, where the experimental result is hidden from the analysts until they've agreed—based on properties of the data set other than the final value—that the analysis techniques are fixed.

One example of a blind analysis occurs in neutrino experiments, like the Sudbury Neutrino Observatory, where the experimenters wish to report the total number N of neutrinos seen. The experimenters have preexisting expectations about what this number should be, and these expectations must not be allowed to bias the analysis. Therefore, the experimenters are allowed to see an unknown fraction f of the dataset. They use these data to understand the backgrounds, signal-detection efficiencies, detector resolutions, etc.. However, since no one knows the "blinding fraction" f, no one has preexisting expectations about the meaningless neutrino count N' = N × f in the visible data; therefore, the analysis does not introduce any bias into the final number N which is reported. Another blinding scheme is used in B meson analyses in experiments like BaBar and CDF; here, the crucial experimental parameter is a correlation between certain particle energies and decay times—which require an extremely complex and painstaking analysis—and particle charge signs, which are fairly trivial to measure. Analysts are allowed to work with all the energy and decay data, but are forbidden from seeing the sign of the charge, and thus are unable to see the correlation (if any). At the end of the experiment, the correct charge signs are revealed; the analysis software is run once (with no subjective human intervention), and the resulting numbers are published. Searches for rare events, like electron neutrinos in MiniBooNE or proton decay in Super-Kamiokande, require a different class of blinding schemes.

The "hidden" part of the experiment—the fraction f for SNO, the charge-sign database for CDF—is usually called the "blindness box". At the end of the analysis period, one is allowed to "unblind the data" and "open the box".

In forensics

In a police photo lineup, an officer shows a group of photos to a witness or crime victim and asks him or her to pick out the suspect. This is basically a single-blind test of the witness's memory, and may be subject to subtle or overt influence by the officer. There is a growing movement in law enforcement to move to a double-blind procedure in which the officer who shows the photos to the witness does not know which photo is of the suspect.[17][18]

In music

In recruiting musicians to perform in orchestras and so on, blind auditions are now routinely done: the musicians perform behind a screen so that their physical appearance and gender cannot prejudice the listener judging the performance.

Representation of a Lie group

From Wikipedia, the free encyclopedia https://en.wikipedia.org/wiki/Representation_of_a_Lie_group...