Search This Blog

Saturday, December 30, 2023

Ice sheet

From Wikipedia, the free encyclopedia
One of Earth's two ice sheets: The Antarctic ice sheet covers about 98% of the Antarctic continent and is the largest single mass of ice on Earth, with an average thickness of over 2 kilometers.

In glaciology, an ice sheet, also known as a continental glacier, is a mass of glacial ice that covers surrounding terrain and is greater than 50,000 km2 (19,000 sq mi). The only current ice sheets are the Antarctic ice sheet and the Greenland ice sheet. Ice sheets are bigger than ice shelves or alpine glaciers. Masses of ice covering less than 50,000 km2 are termed an ice cap. An ice cap will typically feed a series of glaciers around its periphery.

Although the surface is cold, the base of an ice sheet is generally warmer due to geothermal heat. In places, melting occurs and the melt-water lubricates the ice sheet so that it flows more rapidly. This process produces fast-flowing channels in the ice sheet — these are ice streams.

In previous geologic time spans (glacial periods) there were other ice sheets: during the Last Glacial Period at Last Glacial Maximum, the Laurentide Ice Sheet covered much of North America, the Weichselian ice sheet covered Northern Europe and the Patagonian Ice Sheet covered southern South America.

Definition

An ice sheet is "an ice body originating on land that covers an area of continental size, generally defined as covering >50,000 km2 , and that has formed over thousands of years through accumulation and compaction of snow".

Common properties

Carbon stores and fluxes in present-day ice sheets (2019), and the predicted impact on carbon dioxide (where data exists).
Estimated carbon fluxes are measured in Tg C a−1 (megatonnes of carbon per year) and estimated sizes of carbon stores are measured in Pg C (thousands of megatonnes of carbon). DOC = dissolved organic carbon, POC = particulate organic carbon.

Ice sheets have the following properties: "An ice sheet flows outward from a high central ice plateau with a small average surface slope. The margins usually slope more steeply, and most ice is discharged through fast-flowing ice streams or outlet glaciers, often into the sea or into ice shelves floating on the sea."

Ice movement is dominated by the motion of glaciers, whose activity is determined by a number of processes. Their motion is the result of cyclic surges interspersed with longer periods of inactivity, on both hourly and centennial time scales.

Until recently, ice sheets were viewed as inert components of the carbon cycle and were largely disregarded in global models. Research in the past decade has transformed this view, demonstrating the existence of uniquely adapted microbial communities, high rates of biogeochemical/physical weathering in ice sheets and storage and cycling of organic carbon in excess of 100 billion tonnes, as well as nutrients (see diagram).

Earth's current two ice sheets

Antarctic ice sheet

An image of Antarctica differentiating its landmass (dark grey) from its ice shelves (light grey) and sea ice (white)
The Antarctic ice sheet is one of two ice sheets on Earth and covers about 98% of the Antarctic continent. It is the largest single mass of ice on Earth, with an average thickness of over 2 kilometres (1.2 mi). It is distinct from the Antarctic sea ice. The Antarctic ice sheet covers an area of almost 14 million square kilometres (5.4 million square miles) and contains 26.5 million cubic kilometres (6,400,000 cubic miles) of ice. The other ice sheet on Earth is the Greenland ice sheet.
The Western Antarctic Ice Sheet (WAIS) is the segment of the continental ice sheet that covers West Antarctica, the portion of Antarctica on the side of the Transantarctic Mountains that lies in the Western Hemisphere. The WAIS is classified as a marine-based ice sheet, meaning that its bed lies well below sea level and its edges flow into floating ice shelves. The WAIS is bounded by the Ross Ice Shelf, the Ronne Ice Shelf, and outlet glaciers that drain into the Amundsen Sea.

The East Antarctic Ice Sheet (EAIS) is one of two large ice sheets in Antarctica, and the largest on the entire planet. The EAIS lies between 45° west and 168° east longitudinally.

The EAIS holds enough ice to raise global sea levels by 53.3 m (175 ft) and is considerably larger in area and mass than the West Antarctic Ice Sheet (WAIS). It is separated from the WAIS by the Transantarctic Mountains. The EAIS is the driest, windiest, and coldest place on Earth, with temperatures reported down to nearly −100 °C. The EAIS holds the thickest ice on Earth, at 4,800 m (15,700 ft). It is home to the geographic South Pole and the Amundsen–Scott South Pole Station.

Greenland ice sheet

Greenland ice sheet as seen from space

The Greenland ice sheet (Danish: Grønlands indlandsis, Greenlandic: Sermersuaq) is an ice sheet about 1.67 km (1.0 mi) thick on average, and almost 3.5 km (2.2 mi) at its thickest point. It is almost 2,900 kilometres (1,800 mi) long in a north–south direction, with the greatest width of 1,100 kilometres (680 mi) at a latitude of 77°N, near its northern margin. It covers 1,710,000 square kilometres (660,000 sq mi), around 80% of the surface of Greenland, and is the second largest body of ice in the world, after the East Antarctic ice sheet. It is sometimes referred to as an ice cap, or inland ice or its Danish equivalent, indlandsis. The acronyms GIS or GrIS are also frequently used in the scientific literature.

While Greenland has had major glaciers and ice caps for at least 18 million years, the ice sheet first emerged as a single entity covering most of the island some 2.6 million years ago – a process which required significant changes to Greenland's orography millions of years earlier, as well as the low temperatures due to a reduction in atmospheric carbon dioxide levels. Since then it has both grown, sometimes to a significantly larger size than now, and shrunk, to less than 10% of its volume on at least one occasion around 400,000 years ago, when the temperatures were somewhat warmer than today. Its oldest known ice is about 1 million years old.

Melting due to climate change

The melting of the Greenland and West Antarctic ice sheets will continue to contribute to sea level rise over long time-scales. The Greenland ice sheet loss is mainly driven by melt from the top. Antarctic ice loss is driven by warm ocean water melting the outlet glaciers.

Future melt of the West Antarctic ice sheet is potentially abrupt under a high emission scenario, as a consequence of a partial collapse. Part of the ice sheet is grounded on bedrock below sea level. This makes it possibly vulnerable to the self-enhancing process of marine ice sheet instability. Marine ice cliff instability could also contribute to a partial collapse. But there is limited evidence for its importance. A partial collapse of the ice sheet would lead to rapid sea level rise and a local decrease in ocean salinity. It would be irreversible for decades and possibly even millennia. The complete loss of the West Antarctic ice sheet would cause over 5 metres (16 ft) of sea level rise.

In contrast to the West Antarctic ice sheet, melt of the Greenland ice sheet is projected to take place more gradually over millennia. Sustained warming between 1 °C (1.8 °F) (low confidence) and 4 °C (7.2 °F) (medium confidence) would lead to a complete loss of the ice sheet. This would contribute 7 m (23 ft) to sea levels globally. The ice loss could become irreversible due to a further self-enhancing feedback. This is called the elevation-surface mass balance feedback. When ice melts on top of the ice sheet, the elevation drops. Air temperature is higher at lower altitudes, so this promotes further melting.

In geologic timescales

Antarctic ice sheet during geologic timescales

Polar climatic temperature changes throughout the Cenozoic, showing glaciation of Antarctica toward the end of the Eocene, thawing near the end of the Oligocene and subsequent Miocene re-glaciation.

The icing of Antarctica began in the Late Palaeocene or middle Eocene between 60 and 45.5 million years ago and escalated during the Eocene–Oligocene extinction event about 34 million years ago. CO2 levels were then about 760 ppm and had been decreasing from earlier levels in the thousands of ppm. Carbon dioxide decrease, with a tipping point of 600 ppm, was the primary agent forcing Antarctic glaciation. The glaciation was favored by an interval when the Earth's orbit favored cool summers but oxygen isotope ratio cycle marker changes were too large to be explained by Antarctic ice-sheet growth alone indicating an ice age of some size. The opening of the Drake Passage may have played a role as well though models of the changes suggest declining CO2 levels to have been more important.

The Western Antarctic ice sheet declined somewhat during the warm early Pliocene epoch, approximately 5 to 3 million years ago; during this time the Ross Sea opened up. But there was no significant decline in the land-based Eastern Antarctic ice sheet.

Greenland ice sheet during geologic timescales

Timeline of the ice sheet's formation from 2.9 to 2.6 million years ago

While there is evidence of large glaciers in Greenland for most of the past 18 million years, they were more similar to various smaller modern formations, such as Maniitsoq and Flade Isblink, which cover 76,000 and 100,000 square kilometres (29,000 and 39,000 sq mi) around the periphery. The conditions in Greenland were not initially suitable to enable the presence of a single cohesive ice sheet, but this began to change around 10 million years ago, during the middle Miocene, when the two passive continental margins which now form the uplands of West and East Greenland had experienced uplift for the first time, which ultimately formed the Upper Planation Surface at a 2000 to 3000 meter height above mean sea level.

Later, during the Pliocene, a Lower Planation Surface, with the 500 to 1000 meter height above sea level, was formed during the second stage of uplift 5 million years ago, and the third stage had created multiple valleys and fjords below the planation surfaces. These increases in height had intensified glaciation due to increased orographic precipitation and cooler surface temperatures, which made it easier for ice to accumulate during colder periods and persist through higher temperature fluctuations. While as recently as 3 million years ago, during the Pliocene warm period, Greenland's ice was limited to the highest peaks in the east and the south, ice cover had gradually expanded since then, until the atmospheric CO2 levels dropped to between 280 and 320 ppm 2.7–2.6 million years ago, which had reduced the temperatures sufficiently for the disparate ice caps build up in the meantime to connect and cover most of the island.

For much of the past 120,000 years, the climate in and around Greenland had been colder than in the last few millennia of recorded history (upper half), allowing the ice sheet to become considerably larger than it is now (lower half).

Often, the base of ice sheet is warm enough due to geothermal activity to have some liquid water beneath it. This liquid water, subject to great pressure from the continued movement of massive layers of ice above it, becomes a tool of intense water erosion, which eventually leaves nothing but bedrock below the ice sheet. However, there are parts of the Greenland ice sheet, near the summit, where the upper layers of the ice sheet slide above the lowest layer of ice which had frozen solid to the ground, preserving ancient soil, which can then be discovered when scientists drill ice cores, up to 4 kilometres (2.5 mi) deep. The oldest such soil had been continuously covered by ice for around 2.7 million years, while another, 3 kilometres (1.9 mi) deep ice core from the summit reveals ice that is around ~1,000,000 years old.

On the other hand, ocean sediment samples from the Labrador Sea provide evidence that nearly all of south Greenland had melted around 400,000 years ago, during the Marine Isotope Stage 11, and other ice core samples, taken from Camp Century in northwestern Greenland at a depth of 1.4 km (0.87 mi), demonstrate that the ice there melted at least once during the past 1.4 million years, during the Pleistocene, and that it did not return for at least 280,000 years. Taken together, these findings suggest less than 10% of the current ice sheet's volume was left during those geologically recent periods, when the temperatures were less than 2.5 °C (4.5 °F) warmer than preindustrial, which contradicts how climate models typically simulate continuous presence of solid ice under those conditions.
Glaciology


From Wikipedia, the free encyclopedia
Lateral moraine on a glacier joining the Gorner Glacier, Zermatt, Swiss Alps. The moraine is the high bank of debris in the top left hand quarter of the image.
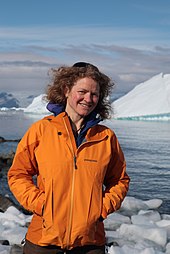
Glaciologist Erin Pettit in Antarctica, 2016

Glaciology (from Latin glacies 'frost, ice', and Ancient Greek λόγος (logos) 'subject matter'; lit.'study of ice') is the scientific study of glaciers, or more generally ice and natural phenomena that involve ice.

Glaciology is an interdisciplinary Earth science that integrates geophysics, geology, physical geography, geomorphology, climatology, meteorology, hydrology, biology, and ecology. The impact of glaciers on people includes the fields of human geography and anthropology. The discoveries of water ice on the Moon, Mars, Europa and Pluto add an extraterrestrial component to the field, which is referred to as "astroglaciology".

Overview

A glacier is an extended mass of ice formed from snow falling and accumulating over a long period of time; glaciers move very slowly, either descending from high mountains, as in valley glaciers, or moving outward from centers of accumulation, as in continental glaciers.

Areas of study within glaciology include glacial history and the reconstruction of past glaciation. A glaciologist is a person who studies glaciers. A glacial geologist studies glacial deposits and glacial erosive features on the landscape. Glaciology and glacial geology are key areas of polar research.

Types

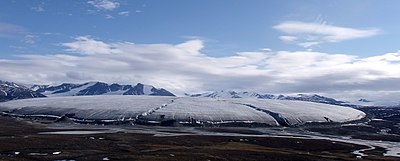
A Bylot Island glacier, Sirmilik National Park, Nunavut. This mountain glacier is one of many coming down from the interior ice cap on top of the Byam Martin Mountains.

Glaciers can be identified by their geometry and the relationship to the surrounding topography. There are two general categories of glaciation which glaciologists distinguish: alpine glaciation, accumulations or "rivers of ice" confined to valleys; and continental glaciation, unrestricted accumulations which once covered much of the northern continents.

  • Alpine – ice flows down the valleys of mountainous areas and forms a tongue of ice moving towards the plains below. Alpine glaciers tend to make topography more rugged by adding and improving the scale of existing features. Various features include large ravines called cirques and arêtes, which are ridges where the rims of two cirques meet.
  • Continental – an ice sheet found today, only in high latitudes (Greenland/Antarctica), thousands of square kilometers in area and thousands of meters thick. These tend to smooth out the landscapes.

Zones of glaciers

  • Accumulation zone – where the formation of ice is faster than its removal.
  • Ablation (or wastage) zone – when the sum of melting, calving, and evaporation (sublimation) is greater than the amount of snow added each year.

Glacier equilibrium line and ELA

The glacier equilibrium line is the line separating the glacial accumulation area above from the ablation area below. The equilibrium line altitude (ELA) and its change over the years is a key indicator of the health of a glacier. A long term monitoring of the ELA may be used as indication to climate change.

Movement

Khurdopin glacier and Shimshal River, Gilgit-Baltistan, northern Pakistan 2017. Several glaciers flow into the Shimshal Valley, and are prone to blocking the river. Khurdopin glacier surged in 2016–17, creating a sizable lake.
Glaciers of Shimsal Valley from space, May 13, 2017. Khurdopin glacier has dammed the Shimshal River, forming a glacial lake. The river has started to carve a path through the toe of the glacier. By early August 2017, the lake had completely drained.

When a glacier is experiencing an accumulation input by precipitation (snow or refreezing rain) that exceeds the output by ablation, the glacier shows a positive glacier mass balance and will advance. Conversely, if the loss of volume (from evaporation, sublimation, melting, and calving) exceeds the accumulation, the glacier shows a negative glacier mass balance and the glacier will melt back. During times in which the volume input to the glacier by precipitation is equivalent to the ice volume lost from calving, evaporation, and melting, the glacier has a steady-state condition.

Some glaciers show periods where the glacier is advancing at an extreme rate, that is typically 100 times faster than what is considered normal, it is referred to as a surging glacier. Surge periods may occur at an interval of 10 to 15 years, e.g. on Svalbard. This is caused mainly due to a long lasting accumulation period on subpolar glaciers frozen to the ground in the accumulation area. When the stress due to the additional volume in the accumulation area increases, the pressure melting point of the ice at its base may be reached, the basal glacier ice will melt, and the glacier will surge on a film of meltwater.

Rate of movement

The movement of glaciers is usually slow. Its velocity varies from a few centimeters to a few meters per day. The rate of movement depends upon the factors listed below:

  • Temperature of the ice. A polar glacier shows cold ice with temperatures well below the freezing point from its surface to its base. It is frozen to its bed. A temperate glacier is at a melting point temperature throughout the year, from its surface to its base. This allows the glacier to slide on a thin layer of meltwater. Most glaciers in alpine regions are temperate glaciers.
  • Gradient of the slope.
  • Thickness of the glacier
  • Subglacial water dynamics

Glacial Terminology

Ablation
Wastage of the glacier through sublimation, ice melting and iceberg calving.
Ablation zone
Area of a glacier in which the annual loss of ice through ablation exceeds the annual gain from precipitation.
Arête
An acute ridge of rock where two cirques meet.
Bergschrund
Crevasse formed near the head of a glacier, where the mass of ice has rotated, sheared and torn itself apart in the manner of a geological fault.
Cirque, Corrie or cwm
Bowl shaped depression excavated by the source of a glacier.
Creep
Adjustment to stress at a molecular level.
Flow
Movement (of ice) in a constant direction.
Fracture
Brittle failure (breaking of ice) under the stress raised when movement is too rapid to be accommodated by creep. It happens, for example, as the central part of a glacier moves faster than the edges.
Glacial landform
Collective name for the morphologic structures in/on/under/around a glacier.
Moraine
Accumulated debris that has been carried by a glacier and deposited at its sides (lateral moraine) or at its foot (terminal moraine).
Névé
Area at the top of a glacier (often a cirque) where snow accumulates and feeds the glacier.
Nunatak/Rognon/Glacial Island
Visible peak of a mountain otherwise covered by a glacier.
Horn
Spire of rock, also known as a pyramidal peak, formed by the headward erosion of three or more cirques around a single mountain. It is an extreme case of an arête.
Plucking/Quarrying
Where the adhesion of the ice to the rock is stronger than the cohesion of the rock, part of the rock leaves with the flowing ice.
Tarn
A post-glacial lake in a cirque.
Tunnel valley
The tunnel that is formed by hydraulic erosion of ice and rock below an ice sheet margin. The tunnel valley is what remains of it in the underlying rock when the ice sheet has melted.

Glacial deposits

A kettle pond in Hossa, Suomussalmi municipality, Finland

Stratified

Outwash sand/gravel
From front of glaciers, found on a plain.
Kettles
When a lock of stagnant ice leaves a depression or pit.
Eskers
Steep sided ridges of gravel/sand, possibly caused by streams running under stagnant ice.
Kames
Stratified drift builds up low, steep hills.
Varves
Alternating thin sedimentary beds (coarse and fine) of a proglacial lake. Summer conditions deposit more and coarser material and those of the winter, less and finer.

Unstratified

Drowned drumlin in Clew Bay, Ireland
Till-unsorted
(Glacial flour to boulders) deposited by receding/advancing glaciers, forming moraines, and drumlins.
Moraines
(Terminal) material deposited at the end; (ground) material deposited as glacier melts; (lateral) material deposited along the sides.
Drumlins
Smooth elongated hills composed of till.
Ribbed moraines
Large subglacial elongated hills transverse to former ice flow.

Geomathematics

From Wikipedia, the free encyclopedia

Geomathematics (also: mathematical geosciences, mathematical geology, mathematical geophysics) is the application of mathematical methods to solve problems in geosciences, including geology and geophysics, and particularly geodynamics and seismology.

Applications

Geophysical fluid dynamics

Geophysical fluid dynamics develops the theory of fluid dynamics for the atmosphere, ocean and Earth's interior. Applications include geodynamics and the theory of the geodynamo.

Geophysical inverse theory

Geophysical inverse theory is concerned with analyzing geophysical data to get model parameters. It is concerned with the question: What can be known about the Earth's interior from measurements on the surface? Generally there are limits on what can be known even in the ideal limit of exact data.

The goal of inverse theory is to determine the spatial distribution of some variable (for example, density or seismic wave velocity). The distribution determines the values of an observable at the surface (for example, gravitational acceleration for density). There must be a forward model predicting the surface observations given the distribution of this variable.

Applications include geomagnetism, magnetotellurics and seismology.

Fractals and complexity

Many geophysical data sets have spectra that follow a power law, meaning that the frequency of an observed magnitude varies as some power of the magnitude. An example is the distribution of earthquake magnitudes; small earthquakes are far more common than large earthquakes. This is often an indicator that the data sets have an underlying fractal geometry. Fractal sets have a number of common features, including structure at many scales, irregularity, and self-similarity (they can be split into parts that look much like the whole). The manner in which these sets can be divided determine the Hausdorff dimension of the set, which is generally different from the more familiar topological dimension. Fractal phenomena are associated with chaos, self-organized criticality and turbulence. Fractal Models in the Earth Sciences by Gabor Korvin was one of the earlier books on the application of Fractals in the Earth Sciences.

Data assimilation

Data assimilation combines numerical models of geophysical systems with observations that may be irregular in space and time. Many of the applications involve geophysical fluid dynamics. Fluid dynamic models are governed by a set of partial differential equations. For these equations to make good predictions, accurate initial conditions are needed. However, often the initial conditions are not very well known. Data assimilation methods allow the models to incorporate later observations to improve the initial conditions. Data assimilation plays an increasingly important role in weather forecasting.

Geophysical statistics

Some statistical problems come under the heading of mathematical geophysics, including model validation and quantifying uncertainty.

Terrestrial Tomography

An important research area that utilises inverse methods is seismic tomography, a technique for imaging the subsurface of the Earth using seismic waves. Traditionally seismic waves produced by earthquakes or anthropogenic seismic sources (e.g., explosives, marine air guns) were used.

Crystallography

Crystallography is one of the traditional areas of geology that use mathematics. Crystallographers make use of linear algebra by using the Metrical Matrix. The Metrical Matrix uses the basis vectors of the unit cell dimensions to find the volume of a unit cell, d-spacings, the angle between two planes, the angle between atoms, and the bond length. Miller's Index is also helpful in the application of the Metrical Matrix. Brag's equation is also useful when using an electron microscope to be able to show relationship between light diffraction angles, wavelength, and the d-spacings within a sample.

Geophysics

Geophysics is one of the most math heavy disciplines of Earth Science. There are many applications which include gravity, magnetic, seismic, electric, electromagnetic, resistivity, radioactivity, induced polarization, and well logging. Gravity and magnetic methods share similar characteristics because they're measuring small changes in the gravitational field based on the density of the rocks in that area. While similar gravity fields tend to be more uniform and smooth compared to magnetic fields. Gravity is used often for oil exploration and seismic can also be used, but it is often significantly more expensive. Seismic is used more than most geophysics techniques because of its ability to penetrate, its resolution, and its accuracy.

Geomorphology

Many applications of mathematics in geomorphology are related to water. In the soil aspect things like Darcy's law, Stoke's law, and porosity are used.

  • Darcy's law is used when one has a saturated soil that is uniform to describe how fluid flows through that medium. This type of work would fall under hydrogeology.
  • Stoke's law measures how quickly different sized particles will settle out of a fluid. This is used when doing pipette analysis of soils to find the percentage sand vs silt vs clay. A potential error is it assumes perfectly spherical particles which don't exist.
  • Stream power is used to find the ability of a river to incise into the river bed. This is applicable to see where a river is likely to fail and change course or when looking at the damage of losing stream sediments on a river system (like downstream of a dam).
  • Differential equations can be used in multiple areas of geomorphology including: The exponential growth equation, distribution of sedimentary rocks, diffusion of gas through rocks, and crenulation cleavages.

Glaciology

Mathematics in Glaciology consists of theoretical, experimental, and modeling. It usually covers glaciers, sea ice, waterflow, and the land under the glacier.

Polycrystalline ice deforms slower than single crystalline ice, due to the stress being on the basal planes that are already blocked by other ice crystals. It can be mathematically modeled with Hooke's Law to show the elastic characteristics while using Lamé constants. Generally the ice has its linear elasticity constants averaged over one dimension of space to simplify the equations while still maintaining accuracy.

Viscoelastic polycrystalline ice is considered to have low amounts of stress usually below one bar. This type of ice system is where one would test for creep or vibrations from the tension on the ice. One of the more important equations to this area of study is called the relaxation function. Where it's a stress-strain relationship independent of time. This area is usually applied to transportation or building onto floating ice.

Shallow-Ice approximation is useful for glaciers that have variable thickness, with a small amount of stress and variable velocity. One of the main goals of the mathematical work is to be able to predict the stress and velocity. Which can be affected by changes in the properties of the ice and temperature. This is an area in which the basal shear-stress formula can be used.

Geographic information system software

From Wikipedia, the free encyclopedia
https://en.wikipedia.org/wiki/Geographic_information_system_software

A GIS software program is a computer program to support the use of a geographic information system, providing the ability to create, store, manage, query, analyze, and visualize geographic data, that is, data representing phenomena for which location is important. The GIS software industry encompasses a broad range of commercial and open-source products that provide some or all of these capabilities within various information technology architectures.

History

The earliest geographic information systems, such as the Canadian Geographic Information System started in 1963, were bespoke programs developed specifically for a single installation (usually a government agency), based on custom-designed data models. During the 1950s and 1960s, academic researchers during the quantitative revolution of geography began writing computer programs to perform spatial analysis, especially at the University of Washington and the University of Michigan, but these were also custom programs that were rarely available to other potential users.

The thematic map types that could be generated by SYMAP.

Perhaps the first general-purpose software that provided a range of GIS functionality was the Synagraphic Mapping Package (SYMAP), developed by Howard T. Fisher and others at the nascent Harvard Laboratory for Computer Graphics and Spatial Analysis starting in 1965. While not a true full-range GIS program, it included some basic mapping and analysis functions, and was freely available to other users. Through the 1970s, the Harvard Lab continued to develop and publish other packages focused on automating specific operations, such as SYMVU (3-D surface visualization), CALFORM (choropleth maps), POLYVRT (topological vector data management), WHIRLPOOL (vector overlay), GRID and IMGRID (raster data management), and others. During the late 1970s, several of these modules were brought together into Odyssey, one of the first commercial complete GIS programs, released in 1980.

During the late 1970s and early 1980s, GIS was emerging in many large government agencies that were responsible for managing land and facilities. Particularly, federal agencies of the United States government developed software that was by definition in the public domain because of the Freedom of Information Act, and was thus released to the public. Notable examples included the Map Overlay and Statistical System (MOSS) developed by the Fish & Wildlife Service and Bureau of Land Management (BLM) starting in 1976; the PROJ library developed at the United States Geological Survey (USGS), one of the first programming libraries available; and GRASS GIS originally developed by the Army Corps of Engineers starting in 1982.[8] These formed the foundation of the open source GIS software community.

The 1980s also saw the beginnings of most commercial GIS software, including Esri ARC/INFO in 1982; Intergraph IGDS in 1985, and the Mapping Display and Analysis System (MIDAS), the first GIS product for MS-DOS personal computers, which later became MapInfo. These would proliferate in the 1990s with the advent of more powerful personal computers, Microsoft Windows, and the 1990 U.S. Census, which raised awareness of the usefulness of geographic data to businesses and other new users.

Several trends emerged in the late 1990s that have significantly changed the GIS software ecosystem leading to the present, by moving in directions beyond the traditional full-featured desktop GIS application. The emergence of object-oriented programming languages facilitated the release of component libraries and application programming interfaces, both commercial and open-source, which encapsulated specific GIS functions, allowing programmers to build spatial capabilities into their own programs. Second, the development of spatial extensions to object-relational database management systems (also both open-source and commercial) created new opportunities for data storage for traditional GIS, but also enabled spatial capabilities to be integrated into enterprise information systems, including business processes such as human resources. Third, as the World Wide Web emerged, web mapping quickly became one of its most popular applications; this led to the development of Server-based GIS software that could perform the same functions as a traditional GIS, but at a location remote from a client who only needed a web browser installed. All of these have combined to enable emerging trends in GIS software, such as the use of cloud computing, software as a service (SAAS), and smartphones to broaden the availability of spatial data, processing, and visualization.

Types of software

The software component of a traditional geographic information system is expected to provide a wide range of functions for handling spatial data:

The modern GIS software ecosystem includes a variety of products that may include more or less of these capabilities, collect them in a single program, or distribute them over the Internet. These products can be grouped into the following broad classes:

Desktop GIS application
The traditional form of GIS software, first developed for mainframes and minicomputers, then Unix workstations, and now personal computers. A desktop GIS program provides a full suite of capabilities, although some programs are modularized with extensions that can be purchased separately.
Server GIS application
A program which runs on a remote server (usually in concert with an HTTP server), handling many or all of the above functions, taking in requests and delivering results via the World Wide Web. Thus, the client typically accesses server capabilities using a normal web browser. Early server software was focused specifically on web mapping, only including the output phase, but current server GIS provides the full suite of functions. This server software is at the core of modern cloud-based platforms such as ArcGIS Online.
Geospatial library
A software component that provides a focused set of documented functions, which software developers can incorporate into their own programs. In modern object-oriented programming languages such as C#, JavaScript and Python, these are typically encapsulated as classes with a documented application programming interface (API).
Spatial database
An extension to an existing database software program (most commonly, an object-relational database management system) that creates a geometry datatype, enabling spatial data to be stored in a column in a table, but also provides new functions to query languages such as SQL that include many of the management and analysis functions of GIS. This enables database managers and programmers to perform GIS functions without traditional GIS software.

The current software industry consists of many competing products of each of these types, in both open-source and commercial forms. Many of these are listed below; for a direct comparison of the characteristics of some of them, see Comparison of geographic information systems software.

Open source software

The development of open source GIS software has—in terms of software history—a long tradition[12] with the appearance of a first system in 1978. Numerous systems are available which cover all sectors of geospatial data handling.

Desktop GIS

Capaware rc1 0.1
GRASS GIS 6.4
gvSIG 1.0
IDRISI Taiga 16.05
SAGA-GIS v. 2.0.3

The following open-source desktop GIS projects are reviewed in Steiniger and Bocher (2008/9):

  • GRASS GIS – Geospatial data management, vector and raster manipulation - developed by the U.S. Army Corps of Engineers
  • gvSIG – Mapping and geoprocessing with a 3D rendering plugin
  • ILWIS (Integrated Land and Water Information System) – Integrates image, vector and thematic data.
  • JUMP GIS / OpenJUMP ((Open) Java Unified Mapping Platform) – The desktop GISs OpenJUMP, SkyJUMP, deeJUMP and Kosmo all emerged from JUMP.
  • MapWindow GIS – Free desktop application with plugins and a programmer library 
  • QGIS (previously known as Quantum GIS) – Powerful cartographic and geospatial data processing tools with extensive plug-in support
  • SAGA GIS (System for Automated Geoscientific Analysis) – Tools for environmental modeling, terrain analysis, and 3D mapping
  • uDig – API and source code (Java) available.

Besides these, there are other open source GIS tools:

  • Generic Mapping Tools – A collection of command-line tools for manipulating geographic and Cartesian data sets and producing PostScript illustrations.
  • FalconView – A mapping system created by the Georgia Tech Research Institute for the Windows family of operating systems. A free, open source version is available.
  • Kalypso – Uses Java and GML3. Focuses mainly on numerical simulations in water management.
  • TerraView – Handles vector and raster data stored in a relational or geo-relational database, i.e. a frontend for TerraLib.
  • GWmodelS – free application software implementing Geographically Weighted (GW) models to analyse geo-spatial data.
  • Whitebox GAT – Cross-platform, free and open-source GIS software.

Other geospatial tools

Apart from desktop GIS, many other types of GIS software exist.

Web map servers

Spatial database management systems

  • PostGIS – Spatial extensions for the open source PostgreSQL database, allowing geospatial queries.
  • ArangoDB – Builtin features available for Spatial data management, allowing geospatial queries.
  • SpatiaLite – Spatial extensions for the open source SQLite database, allowing geospatial queries.
  • TerraLib – Provides advanced functions for GIS analysis.
  • OrientDB – Builtin features available for Spatial data management, allowing geospatial queries.

Software development frameworks and libraries (for web applications)

Software development frameworks and libraries (non-web)

Cataloging application for spatially referenced resources

  • GeoNetwork opensource – A catalog application to manage spatially referenced resources
  • pycsw – pycsw is an OGC CSW server implementation written in Python

Spatial analysis frameworks and libraries/packages

  • package:spmodel – free and open-source R package implementing a framework for fitting and applying geostatistics (i.e. mainly kriging models) to geo-spatial points, and spatial regressions (i.e. mainly spatial autoregressive models) to geo-spatial polygons.
  • package:GWmodel and package:gwverse – free and open-source R packages implementing two frameworks for instantiating and applying Geographically Weighted (GW) models, so to analyse any geo-spatial data.

Other tools

  • Chameleon – Environments for building applications with MapServer.

Commercial or proprietary GIS software

Desktop GIS

Note: Almost all of the companies below offer Desktop GIS and WebMap Server products. Some such as Manifold Systems and Esri offer Spatial DBMS products as well.

Companies with high market share

Companies with minor but notable market share

  • Cadcorp – Products include Cadcorp SIS, GeognoSIS, mSIS and developer kits.
  • Caliper – Products include Maptitude, TransModeler and TransCAD.
  • Conform by GameSim – Software for fusing and visualizing elevation, imagery, vectors, and LiDAR. The fused environment can be exported into 3D formats for gaming, simulation, and urban planning.
  • Dragon/ips – Remote sensing software with GIS capabilities.
  • Geosoft – GIS and data processing software used in natural resource exploration.
  • GeoTime – software for 3D visual analysis and reporting of location data over time; an ArcGIS extension is also available.
  • Global Mapper – GIS software package currently developed by Blue Marble Geographics; originally based on USGS dlgv32 source code.
  • Golden Software – GIS and scientific software. Products include Surfer for gridding and contouring, MapViewer for thematic mapping and spatial analysis, Strater for well or borehole logging and cross sections, Voxler for true 3D well and component mapping, Didger for digitizing and coordinate conversion, and Grapher for 2D and 3D graphing.
  • Kongsberg Gallium Ltd. – Products include InterMAPhics and InterView.
  • MapDotNet – Framework written in C#/.NET for building WPF, Silverlight, and HTML5 applications.
  • Manifold System – GIS software package.
  • RegioGraph by GfK GeoMarketing – GIS software for business planning and analyses; company also provides compatible maps and market data.
  • RemoteView
  • SuperMap Inc. – a GIS software provider that offers Desktop, Component, Web, and Mobile GIS.
  • TerrSet (formerly IDRISI) – GIS and Image Processing product developed by Clark Labs at Clark University.
  • TNTmips by MicroImages – a system integrating desktop GIS, advanced image processing, 2D-3D-stereo visualization, desktop cartography, geospatial database management, and webmap publishing.
  • twiGIS – a web based GIS/FM software, developed by Arkance Systems.

GIS as a service

Many suppliers are now starting to offer Internet based services as well as or instead of downloadable software and/or data. These can be free, funded by advertising or paid for on subscription; they split into three areas:

Spatial DBMS

  • Boeing's Spatial Query Server – Spatially enables Sybase ASE.
  • IBM Db2 – Allows spatial querying and storing of most spatial data types.
  • Informix – Allows spatial querying and storing of most spatial data types.
  • MySQL – Allows spatial querying and storing of most spatial data types.
  • Microsoft SQL Server (2008 and later) – GIS products such as MapInfo and Cadcorp SIS can read and edit this data while Esri and others are expected to be able to read and edit this data at some point in the future.
  • Oracle Spatial – Product allows users to perform geographic operations and store spatial data types in an Oracle environment. Most commercial GIS packages can read and edit spatial data stored in this way.
  • SAP HANA – Allows users to store common spatial data types, load spatial data files with well-known text (WKT) and well-known binary (WKB) formats and perform spatial processing using SQL. Open Geospatial Consortium (OGC) certification allows third party GIS software providers to store and process spatial data. GIS products such as ArcGIS from Esri work with HANA.
  • Teradata – Teradata geospatial allows storage and spatial analysis on location-based data which is stored using native geospatial data-types within the Teradata database.
  • VMDS – Version managed data store from Smallworld.
  • Crunchy Certified PostGIS - Open Geospatial Consortium certified open source distribution of PostgreSQL with PostGIS from Crunchy Data.

Geospatial Internet of Things

Inequality (mathematics)

From Wikipedia, the free encyclopedia https://en.wikipedia.org/wiki/Inequality...