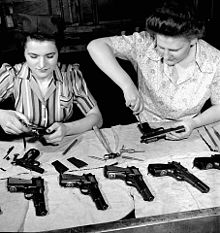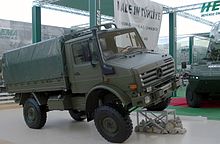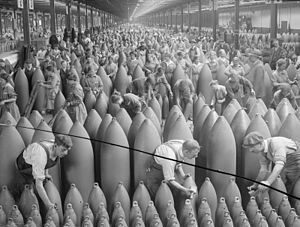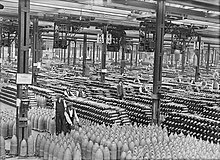
The arms industry, also known as the defence industry, military industry, or the arms trade, is a global industry which manufactures and sells weapons and military technology. Public sector and private sector firms conduct research and development, engineering, production, and servicing of military material, equipment, and facilities. Customers are the armed forces of states, and civilians. An arsenal is a place where arms and ammunition – whether privately or publicly owned – are made, maintained and repaired, stored, or issued, in any combination. Products of the arms industry include weapons, munitions, weapons platforms, military communications and other electronics, and more. The arms industry also provides other logistical and operational support.
The Stockholm International Peace Research Institute (SIPRI) estimated military expenditures as of 2018 at $1822 billion. This represented a relative decline from 1990, when military expenditures made up 4% of world GDP. Part of the money goes to the procurement of military hardware and services from the military industry. The combined arms-sales of the top 100 largest arms-producing companies and military services companies (excluding China) totaled $420 billion in 2018, according to SIPRI. This was 4.6 percent higher than sales in 2017 and marks the fourth consecutive year of growth in Top 100 arms sales. In 2004, over $30 billion were spent in the international arms-trade (a figure that excludes domestic sales of arms). According to the institute, the five largest exporters in 2014–18 were the United States, Russia, France, Germany and China whilst the five biggest importers were Saudi Arabia, India, Egypt, Australia and Algeria.
Many industrialized countries have a domestic arms-industry to supply their own military forces. Some countries also have a substantial legal or illegal domestic trade in weapons for use by their own citizens, primarily for self-defense, hunting or sporting purposes. Illegal trade in small arms occurs in many countries and regions affected by political instability. The Small Arms Survey estimates that 875 million small arms circulate worldwide, produced by more than 1,000 companies from nearly 100 countries.
Governments award contracts to supply their country's military; such arms contracts can become of substantial political importance. The link between politics and the arms trade can result in the development of what U.S. President Dwight D. Eisenhower described in 1961 as a military–industrial complex, where the armed forces, commerce, and politics become closely linked, similarly to the European multilateral defense procurement. Various corporations, some publicly held, others private, bid for these contracts, which are often worth many billions of dollars. Sometimes, as with the contract for the international Joint Strike Fighter, a competitive tendering process takes place, with the decision made on the merits of the designs submitted by the companies involved. Other times, no bidding or competition takes place.

History

During the early modern period, England, France, the Netherlands and some states in Germany became self-sufficient in arms production, with diffusion and migration of skilled workers to more peripheral countries such as Portugal and Russia.
The modern arms industry emerged in the second half of the nineteenth century as a product of the creation and expansion of the first large military–industrial companies. As smaller countries (and even newly industrializing countries like Russia and Japan) could no longer produce cutting-edge military equipment with their indigenous resources and capacity, they increasingly began to contract the manufacture of military equipment, such as battleships, artillery pieces and rifles to foreign firms.
In 1854, the British government awarded a contract to the Elswick Ordnance Company to supply the latest breech loading rifled artillery pieces. This galvanized the private sector into weapons production, with the surplus increasingly exported to foreign countries. William Armstrong became one of the first international arms dealers, selling his systems to governments across the world from Brazil to Japan. In 1884, he opened a shipyard at Elswick to specialize in warship production – at the time, it was the only factory in the world that could build a battleship and arm it completely. The factory produced warships for many navies, including the Imperial Japanese Navy. Several Armstrong cruisers played an important role in defeating the Russian fleet at the Battle of Tsushima in 1905.
In the American Civil War in 1861 the North had about ten times the manufacturing capacity of the economy of the Confederate States of America. This advantage over the South included the ability to produce (in relatively small numbers) breech-loading rifles for use against the muzzle-loading rifled muskets of the South. This began the transition to industrially produced mechanized weapons such as the Gatling gun.
This industrial innovation in the defense industry was adopted by Prussia in its 1866 and 1870–71 defeats of Austria and France respectively. By this time the machine gun had begun entering arsenals. The first examples of its effectiveness were in 1899 during the Boer War and in 1905 during the Russo-Japanese War. However, Germany led the innovation of weapons and this advantage in the weapons of World War I nearly defeated the allies.
In 1885, France decided to capitalize on this increasingly lucrative trade and repealed its ban on weapon exports. The regulatory framework for the period up to the First World War was characterized by a laissez-faire policy that placed little obstruction in the way of weapons exports. Due to the carnage of World War I, arms traders began to be regarded with odium as "merchants of death" and were accused of having instigated and perpetuated the war in order to maximize their profits from arms sales. An inquiry into these allegations in Britain failed to find evidence to support them. However, the sea change in attitude about war more generally meant that governments began to control and regulate the trade themselves.

The volume of the arms trade greatly increased during the 20th century, and it began to be used as a political tool, especially during the Cold War where the United States and the USSR supplied weapons to their proxies across the world, particularly third world countries (see Nixon Doctrine).
Sectors

Land-based weapon
This category includes everything from light arms to heavy artillery, and the majority of producers are small. Many are located in third world countries. International trade in handguns, machine guns, tanks, armored personnel carriers, and other relatively inexpensive weapons is substantial. There is relatively little regulation at the international level, and as a result, many weapons fall into the hands of organized crime, rebel forces, terrorists, or regimes under sanctions.
Small arms
The Control Arms Campaign, founded by Amnesty International, Oxfam, and the International Action Network on Small Arms, estimated in 2003 that there are over 639 million small arms in circulation, and that over 1,135 companies based in more than 98 countries manufacture small arms as well as their various components and ammunition.
Aerospace systems

Encompassing military aircraft (both land-based and naval aviation), conventional missiles, and military satellites, this is the most technologically advanced sector of the market. It is also the least competitive from an economic standpoint, with a handful of companies dominating the entire market. The top clients and major producers are virtually all located in the western world and Russia, with the United States easily in the first place. Prominent aerospace firms include Rolls-Royce, BAE Systems, Saab AB, Dassault Aviation, Sukhoi, Mikoyan, EADS, Leonardo, Thales Group, Lockheed Martin, Northrop Grumman, Raytheon Technologies, and Boeing. There are also several multinational consortia mostly involved in the manufacturing of fighter jets, such as the Eurofighter. The largest military contract in history, signed in October 2001, involved the development of the Joint Strike Fighter.
Some of the world's great powers maintain substantial naval forces to provide a global presence, with the largest nations possessing aircraft carriers, nuclear submarines and advanced anti-air defense systems. The vast majority of military ships are conventionally powered, but some are nuclear-powered. There is also a large global market in second-hand naval vessels, generally purchased by developing countries from Western governments.
Cybersecurity industry
The cybersecurity industry is becoming the most important defense industry as cyber attacks are being deemed as one of the greatest risks to defense in the next ten years as cited by the NATO review in 2013. Therefore, high levels of investment has been placed in the cybersecurity industry to produce new software to protect the ever-growing transition to digitally run hardware. For the military industry, it is vital that protections are used for systems used for reconnaissance, surveillance, and intelligence gathering.
Nevertheless, cyber attacks and cyber attackers have become more advanced in their field using techniques such as Dynamic Trojan Horse Network (DTHN) Internet Worm, Zero-Day Attack, and Stealth Bot. As a result, the cybersecurity industry has had to improve the defense technologies to remove any vulnerability to cyber attacks using systems such as the Security of Information (SIM), Next-Generation Firewalls (NGFWs), and DDoS techniques.
As the threat to computers grows, the demand for cyber protection will rise, resulting in the growth of the cybersecurity industry. It is expected that the industry will be dominated by the defense and homeland security agencies that will make up 40% of the industry.
International arms transfers
According to research institute SIPRI, the volume of international transfers of major weapons in 2010–14 was 16 percent higher than in 2005–2009. The five biggest exporters in 2010–2014 were the United States, Russia, China, Germany and France, and the five biggest importers were India, Saudi Arabia, China, the United Arab Emirates and Pakistan. The flow of arms to the Middle East increased by 87 percent between 2009–13 and 2014–18, while there was a decrease in flows to all other regions: Africa, the Americas, Asia and Oceania, and Europe.
SIPRI has identified 67 countries as exporters of major weapons in 2014–18. The top 5 exporters during the period were responsible for 75 percent of all arms exports. The composition of the five largest exporters of arms changed between 2014 and 2018 remained unchanged compared to 2009–13, although their combined total exports of major arms were 10 percent higher. In 2014–18 there can be seen significant increases in arms exports from the US, France and Germany, while Chinese exports rose marginally and Russian exports decreased.
In 2014–18, 155 countries (about three-quarters of all countries) imported major weapons. The top 5 recipients accounted for 33 percent of the total arms imports during the period. The top five arms importers - Saudi Arabia, India, Egypt, Australia and Algeria - accounted for 35 percent of total arms imports in 2014–18. Of these, Saudi Arabia and India were among the top five importers in both 2009–13 and 2014–18.
In 2014–18, the volume of major arms international transfers was 7.8 percent higher than in 2009-13 and 23 percent than that in 2004–08. The largest arms importer was Saudi Arabia, importing arms primarily from the United States, United Kingdom and France. Between 2009–13 and 2014–18, the flow of arms to the Middle East increased by 87 percent. Also including India, Egypt, Australia and Algeria, the top five importers received 35 percent of the total arms imports, during 2014–18. Besides, the largest exporters were the United States, Russia, France, Germany and China.
The 2022 Russian invasion of Ukraine changed the National Shooting Sports Foundation members ability to obtain an export license from taking a month to taking just four days. This was due to the United States Department of Commerce and agencies associated with ITAR expediting weapons shipments to Ukraine. In addition, the time it took to obtain a permit to buy a firearm in Ukraine also decreased from a few months to a few days.
World's largest arms exporters
Figures are SIPRI Trend Indicator Values (TIVs) expressed in millions. These numbers may not represent real financial flows as prices for the underlying arms can be as low as zero in the case of military aid. The following are estimates from Stockholm International Peace Research Institute.
| 2022 Rank |
Supplier | Arms Exp (in million TIV) |
|---|---|---|
| 1 | 14,515 | |
| 2 | 3,021 | |
| 3 | 2,820 | |
| 4 | 2,017 | |
| 5 | 1,825 | |
| 6 | 1,510 | |
| 7 | 1,504 | |
| 8 | 950 | |
| 9 | 831 | |
| 10 | 452 |

Overall global arms exports rose of about 6 per-cent in the last 5 years compared to the period 2010-2014 and increased by 20 per-cent since 2005–2009.
Rankings for exporters below a billion dollars are less meaningful, as they can be swayed by single contracts. A much more accurate picture of export volume, free from yearly fluctuations, is presented by 5-year moving averages.
Next to SIPRI, there are several other sources that provide data on international transfers of arms. These include national reports by national governments about arms exports, the UN register on conventional arms, and an annual publication by the U.S. Congressional Research Service that includes data on arms exports to developing countries as compiled by U.S. intelligence agencies. Due to the different methodologies and definitions used different sources often provide significantly different data.
World's largest postwar arms exporter

SIPRI uses the "trend-indicator values" (TIV). These are based on the known unit production costs of weapons and represent the transfer of military resources rather than the financial value of the transfer.
| 1950–2019 Rank |
Supplier | Arms Exp (in billion TIV) |
|---|---|---|
| 1 | 692,123 | |
| 2 | 598,375 | |
| 3 | 143,205 | |
| 4 | 125,932 | |
| 5 | 87,431 | |
| 6 | 56,160 | |
| 7 | 33,296 | |
| 8 | 31,291 | |
| 9 | 24,543 | |
| 10 | 17,643 |
*Soviet Union until 1991
World's largest arms importers
Units are in Trend Indicator Values expressed as millions of U.S. dollars at 1990s prices. These numbers may not represent real financial flows as prices for the underlying arms can be as low as zero in the case of military aid.
| 2022 Rank |
Recipient | Arms Imp (in million TIV) |
|---|---|---|
| 1 | 3,342 | |
| 2 | 2,846 | |
| 3 | 2,644 | |
| 4 | 2,272 | |
| 5 | 2,249 | |
| 6 | 1,565 | |
| 7 | 1,291 | |
| 8 | 848 | |
| 9 | 837 | |
| 10 | 829 |
Arms import rankings fluctuate heavily as countries enter and exit wars. Export data tend to be less volatile as exporters tend to be more technologically advanced and have stable production flows. 5-year moving averages present a much more accurate picture of import volume, free from yearly fluctuations.
List of major weapon manufacturers
This is a list of the world's largest arms manufacturers and other military service companies who profit the most from the War economy, their origin is shown as well. The information is based on a list published by the Stockholm International Peace Research Institute for 2020. The list provided by the SIPRI The numbers are in billions of US dollars.
| Rank | Company name | Defense Revenue (US$ billions) |
% of Total Revenue from Defense |
|---|---|---|---|
| 1 | 53.2 | 89% | |
| 2 | 33.5 | 44% | |
| 3 | 29.2 | 86% | |
| 4 | 25.3 | 87% | |
| 5 | 24.5 | 62% | |
| 6 | 22.4 | 34% | |
| 7 | 22.2 | 95% | |
| 8 | 15.0 | 46% | |
| 9 | 14.5 | 22% | |
| 10 | 13.9 | 77% | |
| 11 | 13.1 | 17% | |
| 12 | 11.1 | 72% | |
| 13 | 11.0 | 14% | |
| 14 | 9.4 | 46% | |
| 15 | 9.4 | 98% |
Arms control
Arms control refers to international restrictions upon the development, production, stockpiling, proliferation and usage of small arms, conventional weapons, and weapons of mass destruction. It is typically exercised through the use of diplomacy, which seeks to persuade governments to accept such limitations through agreements and treaties, although it may also be forced upon non-consenting governments.
Notable international arms control treaties

- Geneva Protocol on chemical and biological weapons, 1925
- Outer Space Treaty, signed and entered into force 1967
- Biological Weapons Convention, signed 1972, entered into force 1975
- Missile Technology Control Regime (MTCR), 1987
- Chemical Weapons Convention, signed 1993, entered into force 1997
- Ottawa Treaty on anti-personnel land mines, signed 1997, entered into force 1999
- New START Treaty, signed by Russia and the United States in April 2010, entered into force in February 2011
- Arms Trade Treaty, concluded in 2013, entered into force on 24 December 2014.
