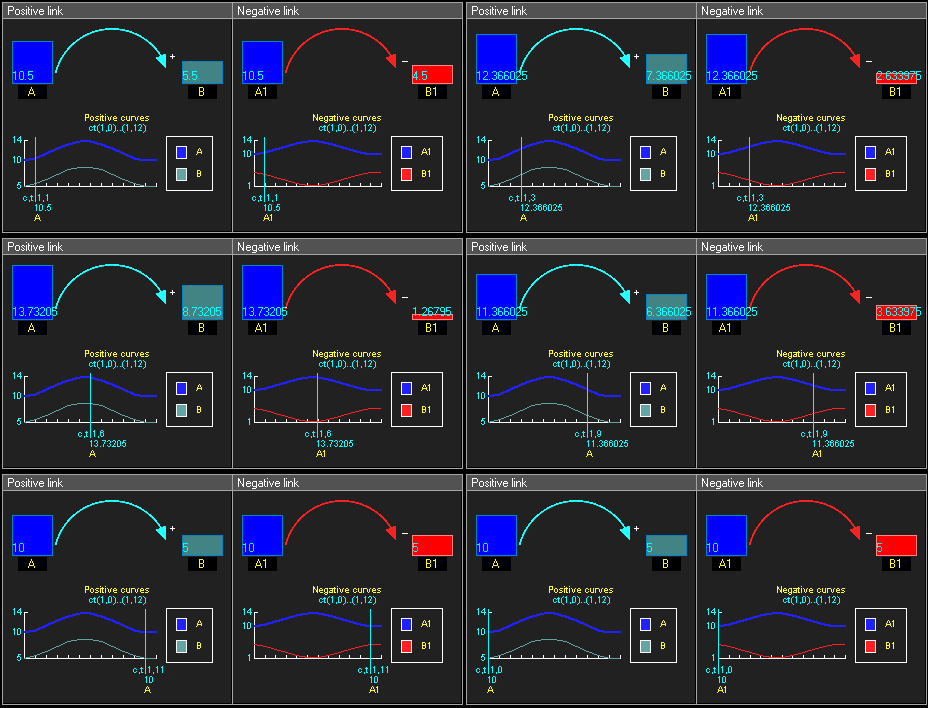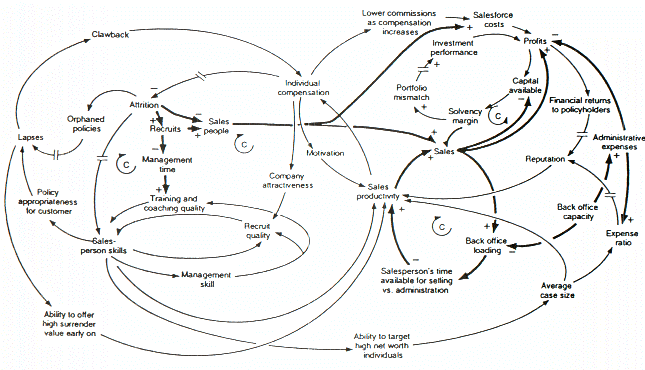
A causal loop diagram (CLD) is a causal diagram that aids in visualizing how different variables in a system are causally interrelated. The diagram consists of a set of words and arrows. Causal loop diagrams are accompanied by a narrative which describes the causally closed situation the CLD describes. Closed loops, or causal feedback loops, in the diagram are very important features of CLDs because they may help identify non-obvious vicious circles and virtuous circles.
The words with arrows coming in and out represent variables, or
quantities whose value changes over time and the links represent a
causal relationship between the two variables (i.e., they do not
represent a material flow). A link marked +
indicates a positive relation where an increase in the causal variable
leads, all else equal, to an increase in the effect variable, or a
decrease in the causal variable leads, all else equal, to a decrease in
the effect variable. A link marked -
indicates a negative relation where an increase in the causal variable
leads, all else equal, to a decrease in the effect variable, or a
decrease in the causal variable leads, all else equal, to an increase in
the effect variable. A positive causal link can be said to lead to a
change in the same direction, and an opposite link can be said to lead
to change in the opposite direction, i.e. if the variable in which the
link starts increases, the other variable decreases and vice versa.
The words without arrows are loop labels. As with the links, feedback loops have either positive (i.e., reinforcing) or negative (i.e., balancing) polarity. CLDs contain labels for these processes, often using numbering (e.g., B1 for the first balancing loop being described in a narrative, B2 for the second one, etc.), and phrases that describe the function of the loop (i.e., "haste makes waste"). A reinforcing loop is a cycle in which the effect of a variation in any variable propagates through the loop and returns to reinforce the initial deviation (i.e. if a variable increases in a reinforcing loop the effect through the cycle will return an increase to the same variable and vice versa). A balancing loop is the cycle in which the effect of a variation in any variable propagates through the loop and returns to the variable a deviation opposite to the initial one (i.e. if a variable increases in a balancing loop the effect through the cycle will return a decrease to the same variable and vice versa). Balancing loops are typically goal-seeking, or error-sensitive, processes and are presented with the variable indicating the goal of the loop. Reinforcing loops are typically vicious or virtuous cycles.
Example of positive reinforcing loop shown in the illustration:
- The amount of the
Bank Balancewill affect the amount of theEarned Interest, as represented by the top blue arrow, pointing from 'Bank BalancetoEarned Interest. - Since an increase in
Bank balanceresults in an increase inEarned Interest, this link is positive, which is denoted with a+. - The
Earned interestgets added to theBank balance, also a positive link, represented by the bottom blue arrow. - The causal effect between these variables forms a positive reinforcing loop, represented by the green arrow, which is denoted with an R. (The terms positive and negative mean "tends to increase" and "tend to reduce", not subjective value judgements.)
History
The use of words and arrows (known in network theory as nodes and edges) to construct directed graph models of cause and effect dates back, at least, to the use of path analysis by Sewall Wright in 1918. According to George Richardson's book "Feedback Thought in Social Science and Systems Theory", the first published, formal use of a causal loop diagram to describe a feedback system was Magoroh Maruyama's 1963 article "The Second Cybernetics: Deviation-Amplifying Mutual Causal Processes".
Positive and negative causal links
- Positive causal link means that the two variables change in the same direction, i.e. if the variable in which the link starts decreases, the other variable also decreases. Similarly, if the variable in which the link starts increases, the other variable increases.
- Negative causal link means that the two variables change in opposite directions, i.e. if the variable in which the link starts increases, then the other variable decreases, and vice versa.
Example

Reinforcing and balancing loops
To determine if a causal loop is reinforcing or balancing, one can start with an assumption, e.g. "Variable 1 increases" and follow the loop around. The loop is:
- reinforcing if, after going around the loop, one ends up with the same result as the initial assumption.
- balancing if the result contradicts the initial assumption.
Or to put it in other words:
- reinforcing loops have an even number of negative links (zero also is even, see example below)
- balancing loops have an odd number of negative links.
Identifying reinforcing and balancing loops is an important step for identifying Reference Behaviour Patterns, i.e. possible dynamic behaviours of the system.
- Reinforcing loops are associated with exponential increases/decreases.
- Balancing loops are associated with reaching a plateau.
If the system has delays (often denoted by drawing a short line across the causal link), the system might fluctuate.
Example


