Search This Blog

Friday, July 24, 2026

Cognitive bias

From Wikipedia, the free encyclopedia
The Cognitive Bias Codex

A cognitive bias is a systematic pattern of deviation from norm or rationality in judgment. Individuals create their own "subjective reality" from their perception of the input. An individual's construction of reality, not the objective input, may dictate their behavior in the world. Thus, cognitive biases may sometimes lead to perceptual distortion, inaccurate judgment, illogical interpretation, and irrationality.

While cognitive biases may initially appear to be negative, some are adaptive. They may lead to more effective actions in a given context. Furthermore, allowing cognitive biases enables faster decisions which can be desirable when timeliness is more valuable than accuracy, as illustrated in heuristics. Other cognitive biases are a "by-product" of human processing limitations, resulting from a lack of appropriate mental mechanisms (bounded rationality), the impact of an individual's constitution and biological state (see embodied cognition), or simply from a limited capacity for information processing. Cognitive biases can make individuals more inclined to endorsing pseudoscientific beliefs by requiring less evidence for claims that confirm their preconceptions. This can potentially distort their perceptions and lead to inaccurate judgments.

A continually evolving list of cognitive biases has been identified over the last six decades of research on human judgment and decision-making in cognitive science, social psychology, and behavioral economics. The study of cognitive biases has practical implications for areas including clinical judgment, entrepreneurship, finance, and management.

Overview

When making judgments under uncertainty, people rely on mental shortcuts or heuristics, which provide swift estimates about the possibility of uncertain occurrences. For example, the representativeness heuristic is defined as the tendency to judge the frequency or likelihood of an occurrence by the extent of which the event resembles the typical case. Similarly the availability heuristic is that individuals estimate the likelihood of events by how easy they are to recall, and the anchoring heuristic prefers the initial reference points that are recalled. While these heuristics are efficient and simple for the brain to compute, they sometimes introduce predictable and systematic cognitive errors, or biases.

The "Linda Problem" illustrates the representativeness heuristic and corresponding bias. Participants were given a description of "Linda" that suggests Linda might well be a feminist (e.g., she is said to be concerned about discrimination and social justice issues). They were then asked whether they thought Linda was more likely to be (a) a "bank teller" or (b) a "bank teller and active in the feminist movement." A majority chose answer (b). Independent of the information given about Linda, though, the more restrictive answer (b) is under any circumstance statistically less likely than answer (a). This is an example of the conjunction fallacy: respondents chose (b) because it seemed more "representative" or typical of persons who might fit the description of Linda. If they assumed that choosing (a) would entail Linda not being active in the feminist movement, that would be a pragmatic implicature. The representativeness heuristic may lead to errors such as activating stereotypes and inaccurate judgments of others.

Gerd Gigerenzer argues that heuristics should not lead us to conceive of human thinking as riddled with irrational cognitive biases. They should rather conceive rationality as an adaptive tool, not identical to the rules of formal logic or the probability calculus. Gigerenzer believes that cognitive biases are not biases, but rules of thumb, or as he would put it "gut feelings" that can actually help us make accurate decisions in our lives. There is not clear evidence that these behaviors are genuinely, severely biased once the actual problems people face are understood. Advances in economics and cognitive neuroscience now suggest that many behaviors previously labeled as biases might instead represent optimal decision-making strategies.

Definitions

DefinitionSource
"bias ... that occurs when humans are processing and interpreting information" ISO/IEC TR 24027:2021(en), 3.2.4, ISO/IEC TR 24368:2022(en), 3.8
"...we can define cognitive biases as systematic errors in cognition that occur when, having an epistemic goal, we non-consciously deviate from it by relying on irrelevant or partially relevant information and ignoring that which is relevant." Nadurak V. (2025). Heuristics and cognitive biases: A conceptual analysis. Memory & cognition, 10.3758/s13421-025-01814-w. Advance online publication. https://doi.org/10.3758/s13421-025-01814-w

History

The notion of cognitive biases was introduced by Amos Tversky and Daniel Kahneman in 1972 and grew out of their experience of people's innumeracy, or inability to reason intuitively with the greater orders of magnitude. Tversky, Kahneman, and colleagues demonstrated several replicable ways in which human judgments and decisions differ from rational choice theory. Their 1974 paper, Judgment under Uncertainty: Heuristics and Biases, outlined how people rely on mental shortcuts when making judgments under uncertainty. Experiments such as the "Linda problem" grew into heuristics and biases research programs, which spread beyond academic psychology into other disciplines including medicine and political science.

The list of cognitive biases has long been a topic of critique. In psychology a "rationality war" unfolded between Gerd Gigerenzer and the Kahneman and Tversky school, which pivoted on whether biases are primarily defects of human cognition or the result of behavioural patterns that are actually adaptive or "ecologically rational". Gerd Gigerenzer has historically been one of the main opponents to cognitive biases and heuristics. This debate has recently reignited, with critiques arguing there has been an overemphasis on biases in human cognition.

A kind of middle ground was put forward by Martie Haselton and David Buss, which acknowledges both the defect and adaptivity of cognitive biases. In this model, evolution favors a bias toward the least costly error.

Koster, Fox & MacLeod (2009) introduced the concept of cognitive bias modification, which focuses on reducing maladaptive cognitive patterns through computer-based attention training and behavioral tasks.

Types

Biases can be distinguished on a number of dimensions. Examples of cognitive biases include -

  • Biases specific to groups (such as the risky shift) versus biases at the individual level.
  • Biases that affect decision-making, where the desirability of options has to be considered (e.g., sunk costs fallacy).
  • Biases, such as illusory correlation, that affect judgment of how likely something is or whether one thing is the cause of another.
  • Biases that affect memory, such as consistency bias (remembering one's past attitudes and behavior as more similar to one's present attitudes).
  • Biases that reflect a subject's motivation, for example, the desire for a positive self-image leading to egocentric bias and the avoidance of unpleasant cognitive dissonance.

Other biases are due to the particular way the brain perceives, forms memories and makes judgments. This distinction is sometimes described as "hot cognition" versus "cold cognition", as motivated reasoning can involve a state of arousal. Among the "cold" biases,

  • some are due to ignoring relevant information (e.g., neglect of probability),
  • some involve a decision or judgment being affected by irrelevant information (for example the framing effect where the same problem receives different responses depending on how it is described; or the distinction bias where choices presented together have different outcomes than those presented separately), and
  • others give excessive weight to an unimportant but salient feature of the problem (e.g., anchoring).

As some biases reflect motivation specifically the motivation to have positive attitudes to oneself. It accounts for the fact that many biases are self-motivated or self-directed (e.g., illusion of asymmetric insight, self-serving bias). There are also biases in how subjects evaluate in-groups or out-groups; evaluating in-groups as more diverse and "better" in many respects, even when those groups are arbitrarily defined (ingroup bias, outgroup homogeneity bias).

Some cognitive biases belong to the subgroup of attentional biases, which refers to paying increased attention to certain stimuli. It has been shown, for example, that people addicted to alcohol and other drugs pay more attention to drug-related stimuli. Common psychological tests to measure those biases are the Stroop task and the dot probe task.

Individuals' susceptibility to some types of cognitive biases can be measured by the Cognitive Reflection Test (CRT) developed by Shane Frederick (2005).

List of biases

The following is a list of the more commonly studied cognitive biases:

Name Description
Fundamental attribution error (FAE, aka correspondence bias) Tendency to overemphasize personality-based explanations for behaviors observed in others. At the same time, individuals under-emphasize the role and power of situational influences on the same behavior. Edward E. Jones and Victor A. Harris' (1967) classic study illustrates the FAE. Despite being made aware that the target's speech direction (pro-Castro/anti-Castro) was assigned to the writer, participants ignored the situational pressures and attributed pro-Castro attitudes to the writer when the speech represented such attitudes.
Implicit bias (aka implicit stereotype, unconscious bias) Tendency to attribute positive or negative qualities to a group of individuals. It can be fully non-factual or be an abusive generalization of a frequent trait in a group to all individuals of that group.
Priming bias Tendency to be influenced by the first presentation of an issue to create our preconceived idea of it, which we then can adjust with later information.
Confirmation bias Tendency to search for or interpret information in a way that confirms one's preconceptions, and discredit information that does not support the initial opinion. Related to the concept of cognitive dissonance, in that individuals may reduce inconsistency by searching for information which reconfirms their views (Jermias, 2001, p. 146).
Affinity bias Tendency to be favorably biased toward people most like ourselves.
Self-serving bias Tendency to claim more responsibility for successes than for failures. It may also manifest itself as a tendency for people to evaluate ambiguous information in a way beneficial to their interests.
Belief bias Tendency to evaluate the logical strength of an argument based on current belief and perceived plausibility of the statement's conclusion.
Framing Tendency to narrow the description of a situation in order to guide to a selected conclusion. The same primer can be framed differently and therefore lead to different conclusions.
Hindsight bias Tendency to view past events as being predictable. Also called the "I-knew-it-all-along" effect.
Embodied cognition Tendency to have selectivity in perception, attention, decision making, and motivation based on the biological state of the body.
Anchoring bias The inability of people to make appropriate adjustments from a starting point in response to a final answer. It can lead people to make sub-optimal decisions. Anchoring affects decision making in negotiations, medical diagnoses, and judicial sentencing.
Status quo bias Tendency to hold to the current situation rather than an alternative situation, to avoid risk and loss (loss aversion). In status quo bias, a decision-maker has the increased propensity to choose an option because it is the default option or status quo. Has been shown to affect various important economic decisions, for example, a choice of car insurance or electrical service.
Overconfidence effect Tendency to overly trust one's own capability to make correct decisions. People tended to overrate their abilities and skills as decision makers. See also the Dunning–Kruger effect.
Physical attractiveness stereotype The tendency to assume people who are physically attractive also possess other desirable personality traits.
Halo Effect Tendency for positive impressions to contaminate other evaluations. In marketing, it may manifest itself in positive bias towards a certain product based on previous positive experiences with another product from the same brand. In psychology, the halo effect explains why people often assume individuals who are viewed as attractive to be also popular, successful, and happy.

Practical significance

Many social institutions rely on individuals to make rational judgments. Across management, finance, medicine, and law, the most recurrent bias is overconfidence, though anchoring and framing also play substantial roles. While research in finance often uses large-scale data, studies in medicine and law frequently rely on vignette-based designs. Berthet highlights the lack of ecological validity in many studies and the need for deeper exploration of individual differences in susceptibility to bias. The securities regulation regime largely assumes that all investors act as perfectly rational persons. In truth, actual investors face cognitive limitations from biases, heuristics, and framing effects. In some academic disciplines, the study of bias is very popular. For instance, bias is a wide spread and well studied phenomenon because most decisions that concern the minds and hearts of entrepreneurs are computationally intractable.

In law enforcement and legal decision-making, confirmation bias and related errors frequently influence investigative decisions and evidence evaluation. Structured intervention strategies, such as accountability measures and checklists, show some promise in reducing bias during case evaluations. A fair jury trial, for example, requires that the jury ignore irrelevant features of the case, weigh the relevant features appropriately, consider different possibilities open-mindedly and resist fallacies such as appeal to emotion. The various biases demonstrated in these psychological experiments suggest that people will frequently fail to do all these things. However, they fail to do so in systematic, directional ways that are predictable.

Cognitive biases can create other issues that arise in everyday life. Study participants who ate more unhealthy snack food tended to have less inhibitory control and more reliance on approach bias. Cognitive biases could be linked to various eating disorders and how people view their bodies and their body image.

Cognitive biases can be used in destructive ways. Some believe that there are people in authority who use cognitive biases and heuristics in order to manipulate others so that they can reach their end goals. Some medications and other health care treatments rely on cognitive biases in order to persuade others who are susceptible to cognitive biases to use their products. Many see this as taking advantage of one's natural struggle of judgement and decision-making. Some also believe that it is the government's responsibility to regulate these misleading ads.

Cognitive biases also seem to play a role in property sale price and value. Participants in the experiment were shown a residential property. Afterwards, they were shown another property that was completely unrelated to the first property. They were asked to say what they believed the value and the sale price of the second property would be. They found that showing the participants an unrelated property did have an effect on how they valued the second property.

Cognitive biases can be used in non-destructive ways. In team science and collective problem-solving, the superiority bias can be beneficial. It leads to a diversity of solutions within a group, especially in complex problems, by preventing premature consensus on suboptimal solutions. This example demonstrates how a cognitive bias, typically seen as a hindrance, can enhance collective decision-making by encouraging a wider exploration of possibilities.

Cognitive biases are interlinked with collective illusions, a phenomenon where a group of people mistakenly believe that their views and preferences are not shared by the majority, when in reality, they are. These illusions often arise from various cognitive biases that misrepresent our perception of social norms and influence how we assess the beliefs of others. The mirror image of this, where one falsely believes one's own views to be held by the majority, is the false consensus effect.

Cognitive biases also influence the spread of misinformation, particularly in digital environments. Lazer, Baum, and Grinberg (2018) analyzed over 16,000 false news stories shared by millions of Twitter users during the 2016 U.S. election and found that false information spread significantly faster than accurate news. This occurs partly because misinformation aligns with existing beliefs and triggers emotional reactions, both of which are linked to confirmation and availability biases. These findings illustrate how cognitive biases can distort public understanding and contribute to the rapid dissemination of false narratives.

Reducing

The content and direction of cognitive biases are not "arbitrary". Debiasing is the reduction of biases in judgment and decision-making through incentives, nudges, and training. Cognitive bias mitigation and cognitive bias modification are forms of debiasing specifically applicable to cognitive biases and their effects. One debiasing technique aims to decrease biases by encouraging individuals to use controlled processing compared to automatic processing. Because they cause systematic errors, cognitive biases cannot be compensated for using a wisdom of the crowd technique of averaging answers from several people. Reference class forecasting is a method for systematically debiasing estimates and decisions, based on what Daniel Kahneman has dubbed the outside view.

Cognitive bias modification (CBM) refers to the process of modifying cognitive biases in healthy people and also refers to a growing area of psychological (non-pharmaceutical) therapies for anxiety, depression and addiction called cognitive bias modification therapy (CBMT). CBMT is sub-group of therapies within a growing area of psychological therapies based on modifying cognitive processes with or without accompanying medication and talk therapy, sometimes referred to as applied cognitive processing therapies (ACPT). Although cognitive bias modification can refer to modifying cognitive processes in healthy individuals, CBMT is a growing area of evidence-based psychological therapy, in which cognitive processes are modified to relieve suffering from serious depression, anxiety, and addiction. CBMT techniques are technology-assisted therapies that are delivered via a computer with or without clinician support. CBM combines evidence and theory from the cognitive model of anxiety, cognitive neuroscience, and attentional models. Even one-shot training interventions, such as educational videos and debiasing games that taught mitigating strategies, significantly reduced the commission of several cognitive biases.

Cognitive bias modification has also been used to help those with obsessive-compulsive beliefs and obsessive-compulsive disorder. This therapy has shown that it decreases the obsessive-compulsive beliefs and behaviors.

In relation to reducing the fundamental attribution error, monetary incentives and informing participants they will be held accountable for their attributions have been linked to the increase of accurate attributions.

Common theoretical causes of some cognitive biases

Bias arises from various processes that are sometimes difficult to distinguish. These include:

Individual differences in cognitive biases

Bias habit convention
The relation between cognitive bias, habit and social convention is still an important issue.

People do appear to have stable individual differences in their susceptibility to decision biases such as overconfidence, temporal discounting, and bias blind spot. That said, these stable levels of bias within individuals are possible to change. Participants in experiments who watched training videos and played debiasing games showed medium to large reductions both immediately and up to three months later in the extent to which they exhibited susceptibility to six cognitive biases: anchoring, bias blind spot, confirmation bias, fundamental attribution error, projection bias, and representativeness.

Individual differences in cognitive bias have also been linked to varying levels of cognitive abilities and functions. The Cognitive Reflection Test (CRT) has been used to help understand the connection between cognitive biases and cognitive ability. There have been inconclusive results when using the Cognitive Reflection Test to understand ability. However, there does seem to be a correlation; those who gain a higher score on the Cognitive Reflection Test, have higher cognitive ability and rational-thinking skills. This in turn helps predict the performance on cognitive bias and heuristic tests. Those with higher CRT scores tend to be able to answer more correctly on different heuristic and cognitive bias tests and tasks.

Age is another individual difference that has an effect on one's ability to be susceptible to cognitive bias. Older individuals tend to be more susceptible to cognitive biases and have less cognitive flexibility. However, older individuals were able to decrease their susceptibility to cognitive biases throughout ongoing trials. These experiments had both young and older adults complete a framing task. Younger adults had more cognitive flexibility than older adults. Cognitive flexibility is linked to helping overcome pre-existing biases.

Climate change feedbacks

From Wikipedia, the free encyclopedia
The relative magnitude of the top 6 climate change feedbacks and what they influence. Positive feedbacks amplify the global warming response to greenhouse gas emissions and negative feedbacks reduce it. In this chart, the horizontal lengths of the red and blue bars indicate the strength of respective feedbacks.

Climate change feedbacks are natural processes that impact how much global temperatures will increase for a given amount of greenhouse gas emissions. Positive feedbacks amplify global warming while negative feedbacks diminish it. Feedbacks influence both the amount of greenhouse gases in the atmosphere and the amount of temperature change that happens in response. While emissions are the forcing that causes climate change, feedbacks combine to control climate sensitivity to that forcing.

While the overall sum of feedbacks is negative, it is becoming less negative as greenhouse gas emissions continue. This means that warming is slower than it would be in the absence of feedbacks, but that warming will accelerate if emissions continue at current levels. Net feedbacks will stay negative largely because of increased thermal radiation as the planet warms, which is an effect that is several times larger than any other singular feedback. Accordingly, anthropogenic climate change alone cannot cause a runaway greenhouse effect.

Feedbacks can be divided into physical feedbacks and partially biological feedbacks. Physical feedbacks include decreased surface reflectivity (from diminished snow and ice cover) and increased water vapor in the atmosphere. Water vapor is not only a powerful greenhouse gas, it also influences feedbacks in the distribution of clouds and temperatures in the atmosphere. Biological feedbacks are mostly associated with changes to the rate at which plant matter accumulates CO2 as part of the carbon cycle. The carbon cycle absorbs more than half of CO2 emissions every year into plants and into the ocean. Over the long term the percentage will be reduced as carbon sinks become saturated and higher temperatures lead to effects like drought and wildfires.

Feedback strengths and relationships are estimated through global climate models, with their estimates calibrated against observational data whenever possible. Some feedbacks rapidly impact climate sensitivity, while the feedback response from ice sheets is drawn out over several centuries. Feedbacks can also result in localized differences, such as polar amplification resulting from feedbacks that include reduced snow and ice cover. While basic relationships are well understood, feedback uncertainty exists in certain areas, particularly regarding cloud feedbacks. Carbon cycle uncertainty is driven by the large rates at which CO2 is both absorbed into plants and released when biomass burns or decays. For instance, permafrost thaw produces both CO2 and methane emissions in ways that are difficult to model. Climate change scenarios use models to estimate how Earth will respond to greenhouse gas emissions over time, including how feedbacks will change as the planet warms.

Definition and terminology

The Planck response is the additional thermal radiation objects emit as they get warmer. Whether Planck response is a climate change feedback depends on the context. In climate science the Planck response can be treated as an intrinsic part of warming that is separate from radiative feedbacks and carbon cycle feedbacks. However, the Planck response is included when calculating climate sensitivity.

A feedback that amplifies an initial change is called a positive feedback while a feedback that reduces an initial change is called a negative feedback. Climate change feedbacks are in the context of global warming, so positive feedbacks enhance warming and negative feedbacks diminish it. Naming a feedback positive or negative does not imply that the feedback is good or bad.

The initial change that triggers a feedback may be externally forced, or may arise through the climate system's internal variability. External forcing refers to "a forcing agent outside the climate system causing a change in the climate system" that may push the climate system in the direction of warming or cooling. External forcings may be human-caused (for example, greenhouse gas emissions or land use change) or natural (for example, volcanic eruptions).

Physical feedbacks

Planck response (negative)

Climate change occurs because the amount of thermal radiation absorbed by different parts of the Earth's environment currently exceeds the amount radiated away to space. As the warming increases, outgoing radiation to space increases quickly due to the Planck response, which eventually helps to stabilize the Earth at some higher temperature level

Planck response is "the most fundamental feedback in the climate system". As the temperature of a black body increases, the emission of infrared radiation increases with the fourth power of its absolute temperature according to the Stefan–Boltzmann law. This increases the amount of outgoing radiation back into space as the Earth warms. It is a strong stabilizing response and has sometimes been called the "no-feedback response" because it is an intensive property of a thermodynamic system when considered to be purely a function of temperature. Although Earth has an effective emissivity less than unity, the ideal black body radiation emerges as a separable quantity when investigating perturbations to the planet's outgoing radiation.

The Planck "feedback" or Planck response is the comparable radiative response obtained from analysis of practical observations or global climate models (GCMs). Its expected strength has been most simply estimated from the derivative of the Stefan-Boltzmann equation as −4σT3 = −3.8 W/m2·K (watts per square meter per degree of warming). Accounting from GCM applications has sometimes yielded a reduced strength, as caused by extensive properties of the stratosphere and similar residual artifacts subsequently identified as being absent from such models.

Most extensive "grey body" properties of Earth that influence the outgoing radiation are usually postulated to be encompassed by the other GCM feedback components, and to be distributed in accordance with a particular forcing-feedback framework. Ideally the Planck response strength obtained from GCMs, indirect measurements, and black body estimates will further converge as analysis methods continue to mature.

Water vapor feedback (positive)

Atmospheric gases only absorb some wavelengths of energy but are transparent to others. The absorption patterns of water vapor (blue peaks) and carbon dioxide (pink peaks) overlap in some wavelengths.

According to Clausius–Clapeyron relation, saturation vapor pressure is higher in a warmer atmosphere, and so the absolute amount of water vapor will increase as the atmosphere warms. It is sometimes also called the specific humidity feedback, because relative humidity (RH) stays practically constant over the oceans, but it decreases over land. This occurs because land experiences faster warming than the ocean, and a decline in RH has been observed after the year 2000.

Since water vapor is a greenhouse gas, the increase in water vapor content makes the atmosphere warm further, which allows the atmosphere to hold still more water vapor. Thus, a positive feedback loop is formed, which continues until the negative feedbacks bring the system to equilibrium. Increases in atmospheric water vapor have been detected from satellites, and calculations based on these observations place this feedback strength at 1.85 ± 0.32 W/m2·K. This is very similar to model estimates, which are at 1.77 ± 0.20 W/m2·K Either value effectively doubles the warming that would otherwise occur from CO2 increases alone. Like with the other physical feedbacks, this is already accounted for in the warming projections under climate change scenarios.

Lapse rate (negative)

Lapse rate (green) is a negative feedback everywhere on Earth besides the polar latitudes. The net climate feedback (black) becomes less negative if it were excluded (orange)

The lapse rate is the rate at which an atmospheric variable, normally temperature in Earth's atmosphere, falls with altitude. It is therefore a quantification of temperature, related to radiation, as a function of altitude, and is not a separate phenomenon in this context. The lapse rate feedback is generally a negative feedback. However, it is in fact a positive feedback in polar regions where it strongly contributed to polar amplified warming, one of the biggest consequences of climate change. This is because in regions with strong inversions, such as the polar regions, the lapse rate feedback can be positive because the surface warms faster than higher altitudes, resulting in inefficient longwave cooling.

The atmosphere's temperature decreases with height in the troposphere. Since emission of infrared radiation varies with temperature, longwave radiation escaping to space from the relatively cold upper atmosphere is less than that emitted toward the ground from the lower atmosphere. Thus, the strength of the greenhouse effect depends on the atmosphere's rate of temperature decrease with height. Both theory and climate models indicate that global warming will reduce the rate of temperature decrease with height, producing a negative lapse rate feedback that weakens the greenhouse effect.

Surface albedo feedback (positive)

Average decadal extent and area of the Arctic Ocean sea ice since 1979.
Average decadal extent and area of the Arctic Ocean sea ice since the start of satellite observations.
 
Annual trend in the Arctic sea ice extent and area for the 2011-2022 time period.

Albedo is the measure of how strongly the planetary surface can reflect solar radiation, which prevents its absorption and thus has a cooling effect. Brighter and more reflective surfaces have a high albedo and darker surfaces have a low albedo, so they heat up more. The most reflective surfaces are ice and snow, so surface albedo changes are overwhelmingly associated with what is known as the ice-albedo feedback. A minority of the effect is also associated with changes in physical oceanography, soil moisture and vegetation cover.

The presence of ice cover and sea ice makes the North Pole and the South Pole colder than they would have been without it. During glacial periods, additional ice increases the reflectivity and thus lowers absorption of solar radiation, cooling the planet. But when warming occurs and the ice melts, darker land or open water takes its place and this causes more warming, which in turn causes more melting. In both cases, a self-reinforcing cycle continues until an equilibrium is found. Consequently, recent Arctic sea ice decline is a key reason behind the Arctic warming nearly four times faster than the global average since 1979 (the start of continuous satellite readings), in a phenomenon known as Arctic amplification. Conversely, the high stability of ice cover in Antarctica, where the East Antarctic ice sheet rises nearly 4 km above the sea level, means that it has experienced very little net warming over the past seven decades.

Aerial photograph showing a section of sea ice. The lighter blue areas are melt ponds and the darkest areas are open water; both have a lower albedo than the white sea ice, so their presence increases local and global temperatures, which helps to spur more melting

As of 2021, the total surface feedback strength is estimated at 0.35 [0.10 to 0.60] W/m2·K. On its own, Arctic sea ice decline between 1979 and 2011 was responsible for 0.21 (W/m2) of radiative forcing. This is equivalent to a quarter of impact from CO2 emissions over the same period. The combined change in all sea ice cover between 1992 and 2018 is equivalent to 10% of all the anthropogenic greenhouse gas emissions. Ice-albedo feedback strength is not constant and depends on the rate of ice loss - models project that under high warming, its strength peaks around 2100 and declines afterwards, as most easily melted ice would already be lost by then.

When CMIP5 models estimate a total loss of Arctic sea ice cover from June to September (a plausible outcome under higher levels of warming), it increases the global temperatures by 0.19 °C (0.34 °F), with a range of 0.16–0.21 °C, while the regional temperatures would increase by over 1.5 °C (2.7 °F). These calculations include second-order effects such as the impact from ice loss on regional lapse rate, water vapor and cloud feedbacks, and do not cause "additional" warming on top of the existing model projections.

Cloud feedback (positive)

Details of how clouds interact with shortwave and longwave radiation at different atmospheric heights

Seen from below, clouds emit infrared radiation back to the surface, which has a warming effect; seen from above, clouds reflect sunlight and emit infrared radiation to space, leading to a cooling effect. Low clouds are bright and very reflective, so they lead to strong cooling, while high clouds are too thin and transparent to effectively reflect sunlight, so they cause overall warming. As a whole, clouds have a substantial cooling effect. However, climate change is expected to alter the distribution of cloud types in a way which collectively reduces their cooling and thus accelerates overall warming. While changes to clouds act as a negative feedback in some latitudes, they represent a clear positive feedback on a global scale.

As of 2021, cloud feedback strength is estimated at 0.42 [–0.10 to 0.94] W/m2·K. This is the largest confidence interval of any climate feedback, and it occurs because some cloud types (most of which are present over the oceans) have been very difficult to observe, so climate models don't have as much data to go on with when they attempt to simulate their behaviour. Additionally, clouds have been strongly affected by aerosol particles, mainly from the unfiltered burning of sulfur-rich fossil fuels such as coal and bunker fuel. Any estimate of cloud feedback needs to disentangle the effects of so-called global dimming caused by these particles as well.

Thus, estimates of cloud feedback differ sharply between climate models. Models with the strongest cloud feedback have the highest climate sensitivity, which means that they simulate much stronger warming in response to a doubling of CO2 (or equivalent greenhouse gas) concentrations than the rest. Around 2020, a small fraction of models was found to simulate so much warming as the result that they had contradicted paleoclimate evidence from fossils, and their output was effectively excluded from the climate sensitivity estimate of the IPCC Sixth Assessment Report.

Biogeophysical and biogeochemical feedbacks

CO2 feedbacks (mostly negative)

This diagram of the fast carbon cycle shows the movement of carbon between land, atmosphere, soil and oceans in billions of tons of carbon per year. Yellow numbers are natural fluxes, red are human contributions in billions of tons of carbon per year. White numbers indicate stored carbon.

There are positive and negative climate feedbacks from Earth's carbon cycle. Negative feedbacks are large, and play a great role in the studies of climate inertia or of dynamic (time-dependent) climate change. Because they are considered relatively insensitive to temperature changes, they are sometimes considered separately or disregarded in studies which aim to quantify climate sensitivity. Global warming projections have included carbon cycle feedbacks since the IPCC Fourth Assessment Report (AR4) in 2007. While the scientific understanding of these feedbacks was limited at the time, it had improved since then. These positive feedbacks include an increase in wildfire frequency and severity, substantial losses from tropical rainforests due to fires and drying and tree losses elsewhere.

The Amazon rainforest is a well-known example due to its enormous size and importance, and because the damage it experiences from climate change is exacerbated by the ongoing deforestation. The combination of two threats can potentially transform much or all of the rainforest to a savannah-like state, although this would most likely require relatively high warming of 3.5 °C (6.3 °F).

Altogether, carbon sinks in the land and ocean absorb around half of the current emissions. Their future absorption is dynamic. In the future, if the emissions decrease, the fraction they absorb will increase, and they will absorb up to three-quarters of the remaining emissions - yet, the raw amount absorbed will decrease from the present. On the contrary, if the emissions will increase, then the raw amount absorbed will increase from now, yet the fraction could decline to one-third by the end of the 21st century. If the emissions remain very high after the 21st century, carbon sinks would eventually be completely overwhelmed, with the ocean sink diminished further and land ecosystems outright becoming a net source. Hypothetically, very strong carbon dioxide removal could also result in land and ocean carbon sinks becoming net sources for several decades.

Role of oceans

The impulse response following a 100 GtC injection of CO2 into Earth's atmosphere. The majority of excess carbon is removed by ocean and land sinks in less than a few centuries, while a substantial portion persists.

Following Le Chatelier's principle, the chemical equilibrium of the Earth's carbon cycle will shift in response to anthropogenic CO2 emissions. The primary driver of this is the ocean, which absorbs anthropogenic CO2 via the so-called solubility pump. At present this accounts for only about one third of the current emissions, but ultimately most (~75%) of the CO2 emitted by human activities will dissolve in the ocean over a period of centuries: "A better approximation of the lifetime of fossil fuel CO2 for public discussion might be 300 years, plus 25% that lasts forever". However, the rate at which the ocean will take it up in the future is less certain, and will be affected by stratification induced by warming and, potentially, changes in the ocean's thermohaline circulation. It is believed that the single largest factor in determining the total strength of the global carbon sink is the state of the Southern Ocean - particularly of the Southern Ocean overturning circulation.

Chemical weathering

Chemical weathering over the geological long term acts to remove CO2 from the atmosphere. With current global warming, weathering is increasing, demonstrating significant feedbacks between climate and Earth surface. Biosequestration also captures and stores CO2 by biological processes. The formation of shells by organisms in the ocean, over a very long time, removes CO2 from the oceans. The complete conversion of CO2 to limestone takes thousands to hundreds of thousands of years.

Primary production through photosynthesis

Increase in global leaf area between 1982 and 2015, which was primarily caused by the CO2 fertilization effect

Net primary productivity of plants' and phytoplankton grows as the increased CO2 fuels their photosynthesis in what is known as the CO2 fertilization effect. Additionally, plants require less water as the atmospheric CO2 concentrations increase, because they lose less moisture to evapotranspiration through open stomata (the pores in leaves through which CO2 is absorbed). However, increased droughts in certain regions can still limit plant growth, and the warming beyond optimum conditions has a consistently negative impact. Thus, estimates for the 21st century show that plants would become a lot more abundant at high latitudes near the poles but grow much less near the tropics - there is only medium confidence that tropical ecosystems would gain more carbon relative to now. However, there is high confidence that the total land carbon sink will remain positive.

Non-CO2 climate-relevant gases (unclear)

Methane climate feedbacks in natural ecosystems.

Release of gases of biological origin would be affected by global warming, and this includes climate-relevant gases such as methane, nitrous oxide or dimethyl sulfide. Others, such as dimethyl sulfide released from oceans, have indirect effects. Emissions of methane from land (particularly from wetlands) and of nitrous oxide from land and oceans are a known positive feedback. I.e. long-term warming changes the balance in the methane-related microbial community within freshwater ecosystems so they produce more methane while proportionately less is oxidised to carbon dioxide. There would also be biogeophysical changes which affect the albedo. For instance, larch in some sub-arctic forests are being replaced by spruce trees. This has a limited contribution to warming, because larch trees shed their needles in winter and so they end up more extensively covered in snow than the spruce trees which retain their dark needles all year.

On the other hand, changes in emissions of compounds such sea salt, dimethyl sulphide, dust, ozone and a range of biogenic volatile organic compounds are expected to be negative overall. As of 2021, all of these non-CO2 feedbacks are believed to practically cancel each other out, but there is only low confidence, and the combined feedbacks could be up to 0.25 W/m2·K in either direction.

Permafrost (positive)

Permafrost is not included in the estimates above, as it is difficult to model, and the estimates of its role is strongly time-dependent as its carbon pools are depleted at different rates under different warming levels. Instead, it is treated as a separate process that will contribute to near-term warming, with the best estimates shown below.

Nine probable scenarios of greenhouse gas emissions from permafrost thaw during the 21st century, which show a limited, moderate and intense CO2 and CH4 emission response to low, medium and high-emission Representative Concentration Pathways. The vertical bar uses emissions of selected large countries as a comparison: the right-hand side of the scale shows their cumulative emissions since the start of the Industrial Revolution, while the left-hand side shows each country's cumulative emissions for the rest of the 21st century if they remained unchanged from their 2019 levels.

Altogether, it is expected that cumulative greenhouse gas emissions from permafrost thaw will be smaller than the cumulative anthropogenic emissions, yet still substantial on a global scale, with some experts comparing them to emissions caused by deforestation. The IPCC Sixth Assessment Report estimates that carbon dioxide and methane released from permafrost could amount to the equivalent of 14–175 billion tonnes of carbon dioxide per 1 °C (1.8 °F) of warming. For comparison, by 2019, annual anthropogenic emissions of carbon dioxide alone stood around 40 billion tonnes. A major review published in the year 2022 concluded that if the goal of preventing 2 °C (3.6 °F) of warming was realized, then the average annual permafrost emissions throughout the 21st century would be equivalent to the year 2019 annual emissions of Russia. Under RCP4.5, a scenario considered close to the current trajectory and where the warming stays slightly below 3 °C (5.4 °F), annual permafrost emissions would be comparable to year 2019 emissions of Western Europe or the United States, while under the scenario of high global warming and worst-case permafrost feedback response, they would approach year 2019 emissions of China.

Fewer studies have attempted to describe the impact directly in terms of warming. A 2018 paper estimated that if global warming was limited to 2 °C (3.6 °F), gradual permafrost thaw would add around 0.09 °C (0.16 °F) to global temperatures by 2100, while a 2022 review concluded that every 1 °C (1.8 °F) of global warming would cause 0.04 °C (0.072 °F) and 0.11 °C (0.20 °F) from abrupt thaw by the year 2100 and 2300. Around 4 °C (7.2 °F) of global warming, abrupt (around 50 years) and widespread collapse of permafrost areas could occur, resulting in an additional warming of 0.2–0.4 °C (0.36–0.72 °F).

A study published in 2024 in Nature Climate Change found that coastal erosion in the Arctic, driven by permafrost thaw, reduces the ocean's capacity to absorb carbon dioxide, thereby triggering additional carbon–climate feedbacks in the region.

Long-term feedbacks

Ice sheets

The loss of albedo from major ice areas on Earth adds to warming: the values shown are for the initial warming of 1.5 °C (2.7 °F). Total ice sheet loss requires multiple millennia: the others can be lost in a century or two

The Earth's two remaining ice sheets, the Greenland ice sheet and the Antarctic ice sheet, cover the world's largest island and an entire continent, and both of them are also around 2 km (1 mi) thick on average. Due to this immense size, their response to warming is measured in thousands of years and is believed to occur in two stages.

The first stage would be the effect from ice melt on thermohaline circulation. Because meltwater is completely fresh, it makes it harder for the surface layer of water to sink beneath the lower layers, and this disrupts the exchange of oxygen, nutrients and heat between the layers. This would act as a negative feedback - sometimes estimated as a cooling effect of 0.2 °C (0.36 °F) over a 1000-year average, though the research on these timescales has been limited. An even longer-term effect is the ice-albedo feedback from ice sheets reaching their ultimate state in response to whatever the long-term temperature change would be. Unless the warming is reversed entirely, this feedback would be positive.

The total loss of the Greenland Ice Sheet is estimated to add 0.13 °C (0.23 °F) to global warming (with a range of 0.04–0.06 °C), while the loss of the West Antarctic Ice Sheet adds 0.05 °C (0.090 °F) (0.04–0.06 °C), and East Antarctic ice sheet 0.6 °C (1.1 °F) Total loss of the Greenland ice sheet would also increase regional temperatures in the Arctic by between 0.5 °C (0.90 °F) and 3 °C (5.4 °F), while the regional temperature in Antarctica is likely to go up by 1 °C (1.8 °F) after the loss of the West Antarctic ice sheet and 2 °C (3.6 °F) after the loss of the East Antarctic ice sheet.

These estimates assume that global warming stays at an average of 1.5 °C (2.7 °F). Because of the logarithmic growth of the greenhouse effect, the impact from ice loss would be larger at the slightly lower warming level of 2020s, but it would become lower if the warming proceeds towards higher levels. While Greenland and the West Antarctic ice sheet are likely committed to melting entirely if the long-term warming is around 1.5 °C (2.7 °F), the East Antarctic ice sheet would not be at risk of complete disappearance until the very high global warming of 5–10 °C (9.0–18.0 °F).

Methane hydrates

Methane hydrates or methane clathrates are frozen compounds where a large amount of methane is trapped within a crystal structure of water, forming a solid similar to ice. On Earth, they generally lie beneath sediments on the ocean floors, (approximately 1,100 m (3,600 ft) below the sea level). Around 2008, there was a serious concern that a large amount of hydrates from relatively shallow deposits in the Arctic, particularly around the East Siberian Arctic Shelf, could quickly break down and release large amounts of methane, potentially leading to 6 °C (11 °F) within 80 years. Current research shows that hydrates react very slowly to warming, and that it's very difficult for methane to reach the atmosphere after dissociation on the seafloor. Thus, no "detectable" impact on the global temperatures is expected to occur in this century due to methane hydrates. Some research suggests hydrate dissociation can still cause a warming of 0.4–0.5 °C (0.72–0.90 °F) over several millennia.

Forcing-feedback formulation of climate sensitivity

Earth is a thermodynamic system for which long-term temperature changes follow the global energy imbalance (EEI stands for Earth's energy imbalance):

where ASR is the absorbed solar radiation and OLR is the outgoing longwave radiation at top of atmosphere. When EEI is positive the system is warming, when it is negative they system is cooling, and when it is approximately zero then there is neither warming or cooling. The ASR and OLR terms in this expression encompass many temperature-dependent properties and complex interactions that govern system behavior.

In order to diagnose that behavior around a relatively stable equilibrium state, one may consider a perturbation to EEI as indicated by the symbol Δ. Such a perturbation is typically induced by a radiative forcing (ΔF) which can be natural or man-made. Responses within the system to either return towards the stable state, or to move further away from the stable state are called feedbacks λΔT:

.

A feedback is a thermodynamic process while a forcing is a thermodynamic operation according to classical principles.

Collectively the feedbacks may be approximated by the linearized parameter λ and the perturbed temperature ΔT because all components of λ (assumed to be first-order to act independently and additively) are also functions of temperature, albeit to varying extents, by definition for a thermodynamic system:

.

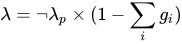
Some feedback components having significant influence on EEI are: = water vapor, = clouds, = surface albedo, = carbon cycle, = Planck response, and = lapse rate. All quantities are understood to be global averages, while T is usually translated to temperature at the surface because of its direct relevance to humans and much other life.

The negative Planck response, being an especially strong function of temperature, is sometimes factored out to give an expression in terms of the relative feedback gains gi from other components:

.

For example for the water vapor feedback.

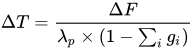
Within the context of modern numerical climate modelling and analysis, the linearized formulation has limited use. One such use is to diagnose the relative strengths of different feedback mechanisms. An estimate of climate sensitivity to a forcing is then obtained for the case where the net feedback remains negative and the system reaches a new equilibrium state (ΔEEI=0) after some time has passed:

.

Implications for climate policy

diagram showing five historical estimates of equilibrium climate sensitivity by the IPCC
Historical estimates of climate sensitivity from the IPCC assessments. The first three reports gave a qualitative likely range, and the next three had formally quantified it, by adding >66% likely range (dark blue). This uncertainty primarily depends on feedbacks.

Uncertainty over climate change feedbacks has implications for climate policy. For instance, uncertainty over carbon cycle feedbacks may affect targets for reducing greenhouse gas emissions (climate change mitigation). Emissions targets are often based on a target stabilization level of atmospheric greenhouse gas concentrations, or on a target for limiting global warming to a particular magnitude. Both of these targets (concentrations or temperatures) require an understanding of future changes in the carbon cycle.

If models incorrectly project future changes in the carbon cycle, then concentration or temperature targets could be missed. For example, if models underestimate the amount of carbon released into the atmosphere due to positive feedbacks (e.g., due to thawing permafrost), then they may also underestimate the extent of emissions reductions necessary to meet a concentration or temperature target.

Existence of God

From Wikipedia, the free encyclopedia https://en.wikipedia.org/wiki/Existence_of_God The existence ...